
|
|||||
|
 | |
| |
| |
| |
| |
| |
|
Gene: HCCS |
Gene summary for HCCS |
| Gene information | Species | Human | Gene symbol | HCCS | Gene ID | 3052 |
| Gene name | holocytochrome c synthase | |
| Gene Alias | CCHL | |
| Cytomap | Xp22.2 | |
| Gene Type | protein-coding | GO ID | GO:0006464 | UniProtAcc | A0A024RBY9 |
Top |
Malignant transformation analysis |
| Identification of the aberrant gene expression in precancerous and cancerous lesions by comparing the gene expression of stem-like cells in diseased tissues with normal stem cells |
| Entrez ID | Symbol | Replicates | Species | Organ | Tissue | Adj P-value | Log2FC | Malignancy |
| 3052 | HCCS | LZE2T | Human | Esophagus | ESCC | 4.27e-03 | 5.43e-01 | 0.082 |
| 3052 | HCCS | LZE4T | Human | Esophagus | ESCC | 8.08e-10 | 2.80e-01 | 0.0811 |
| 3052 | HCCS | LZE7T | Human | Esophagus | ESCC | 2.85e-02 | 2.91e-01 | 0.0667 |
| 3052 | HCCS | LZE8T | Human | Esophagus | ESCC | 6.57e-17 | 4.93e-01 | 0.067 |
| 3052 | HCCS | LZE20T | Human | Esophagus | ESCC | 3.50e-07 | 2.91e-01 | 0.0662 |
| 3052 | HCCS | LZE24T | Human | Esophagus | ESCC | 1.36e-11 | 1.96e-01 | 0.0596 |
| 3052 | HCCS | LZE21T | Human | Esophagus | ESCC | 4.00e-03 | 1.45e-01 | 0.0655 |
| 3052 | HCCS | LZE6T | Human | Esophagus | ESCC | 1.15e-03 | 1.42e-01 | 0.0845 |
| 3052 | HCCS | P1T-E | Human | Esophagus | ESCC | 1.74e-07 | 3.70e-01 | 0.0875 |
| 3052 | HCCS | P2T-E | Human | Esophagus | ESCC | 7.19e-20 | 5.02e-01 | 0.1177 |
| 3052 | HCCS | P4T-E | Human | Esophagus | ESCC | 4.03e-16 | 4.04e-01 | 0.1323 |
| 3052 | HCCS | P5T-E | Human | Esophagus | ESCC | 3.11e-19 | 3.32e-01 | 0.1327 |
| 3052 | HCCS | P8T-E | Human | Esophagus | ESCC | 1.67e-12 | 2.81e-01 | 0.0889 |
| 3052 | HCCS | P9T-E | Human | Esophagus | ESCC | 7.81e-17 | 2.00e-01 | 0.1131 |
| 3052 | HCCS | P10T-E | Human | Esophagus | ESCC | 1.20e-09 | 8.53e-02 | 0.116 |
| 3052 | HCCS | P11T-E | Human | Esophagus | ESCC | 1.84e-12 | 6.07e-01 | 0.1426 |
| 3052 | HCCS | P12T-E | Human | Esophagus | ESCC | 1.33e-20 | 2.27e-01 | 0.1122 |
| 3052 | HCCS | P15T-E | Human | Esophagus | ESCC | 7.71e-22 | 1.65e-01 | 0.1149 |
| 3052 | HCCS | P16T-E | Human | Esophagus | ESCC | 8.64e-16 | 2.35e-01 | 0.1153 |
| 3052 | HCCS | P17T-E | Human | Esophagus | ESCC | 3.23e-05 | 2.06e-01 | 0.1278 |
| Page: 1 2 3 4 5 6 |
| Tissue | Expression Dynamics | Abbreviation |
| Esophagus | 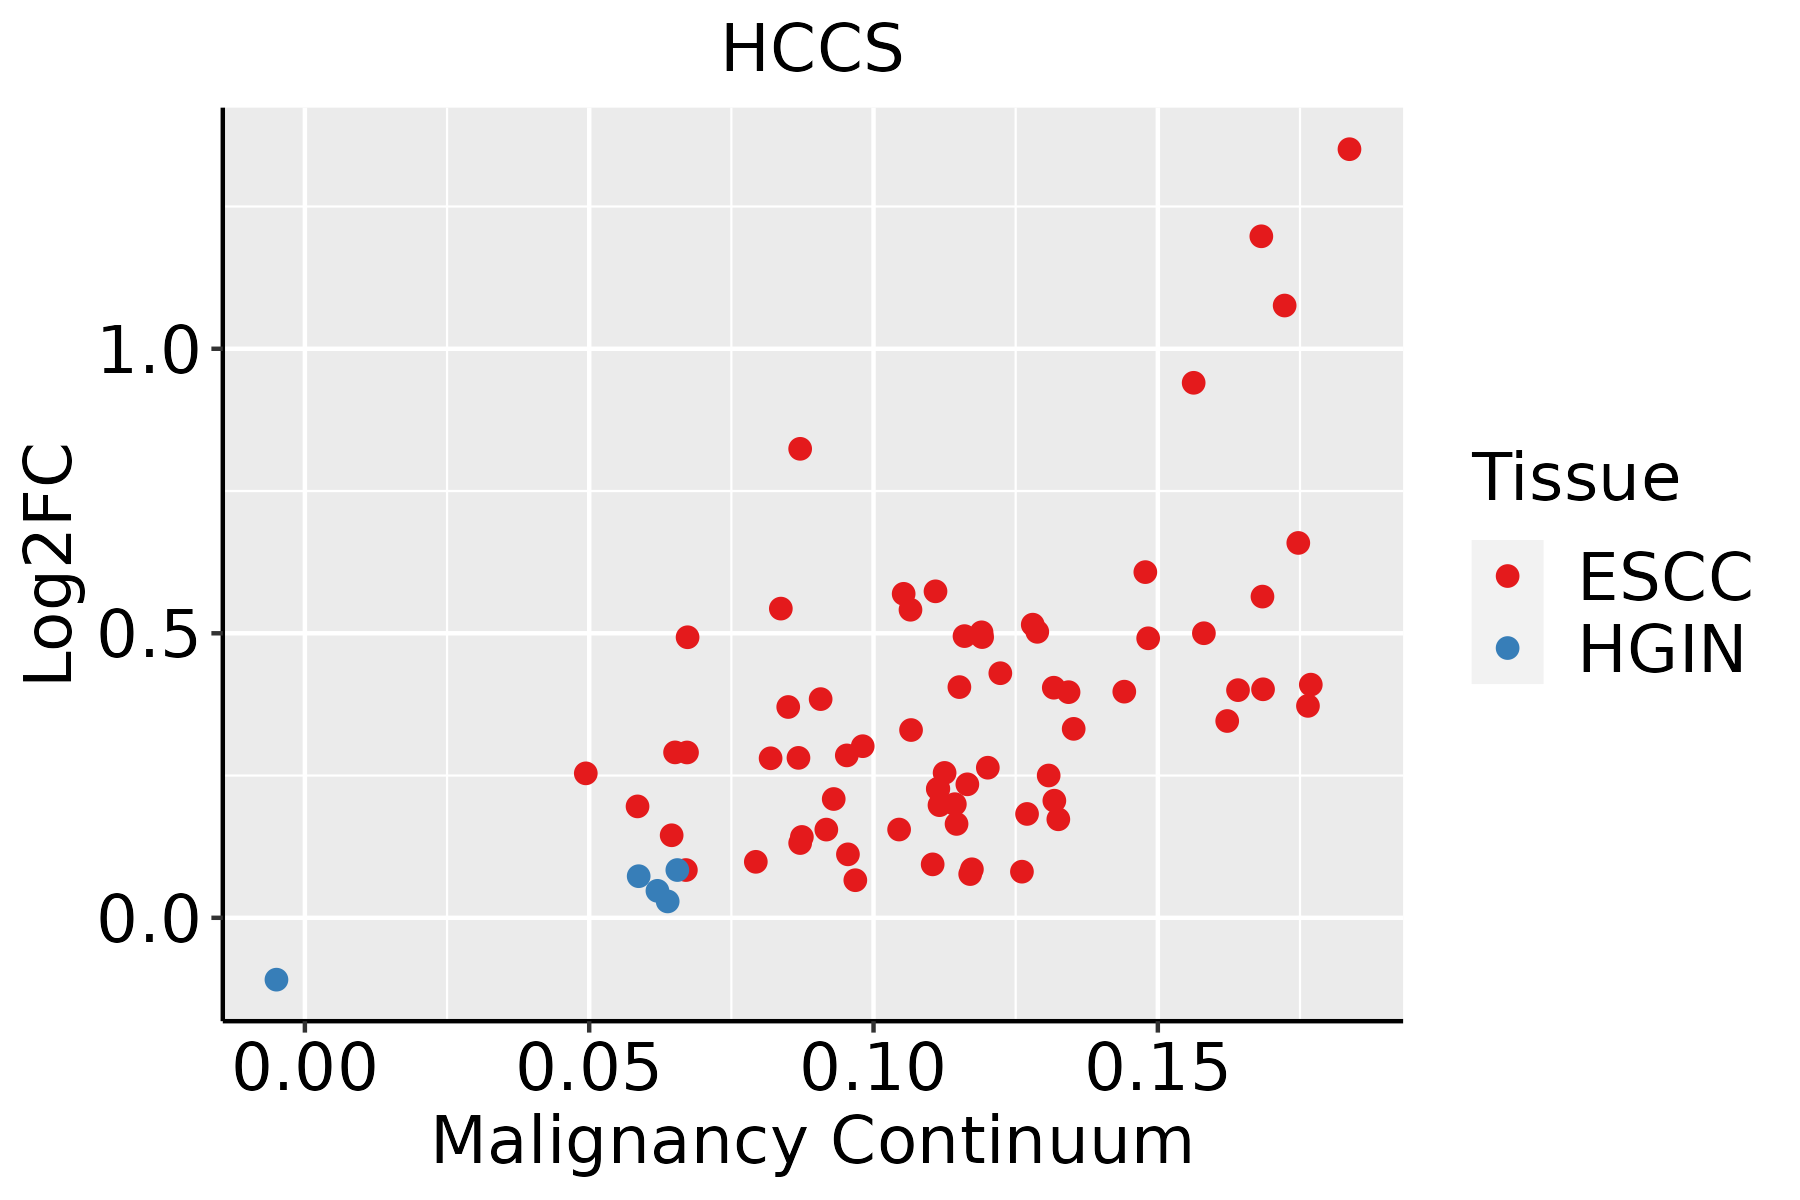 | ESCC: Esophageal squamous cell carcinoma |
| HGIN: High-grade intraepithelial neoplasias | ||
| LGIN: Low-grade intraepithelial neoplasias | ||
| Liver | 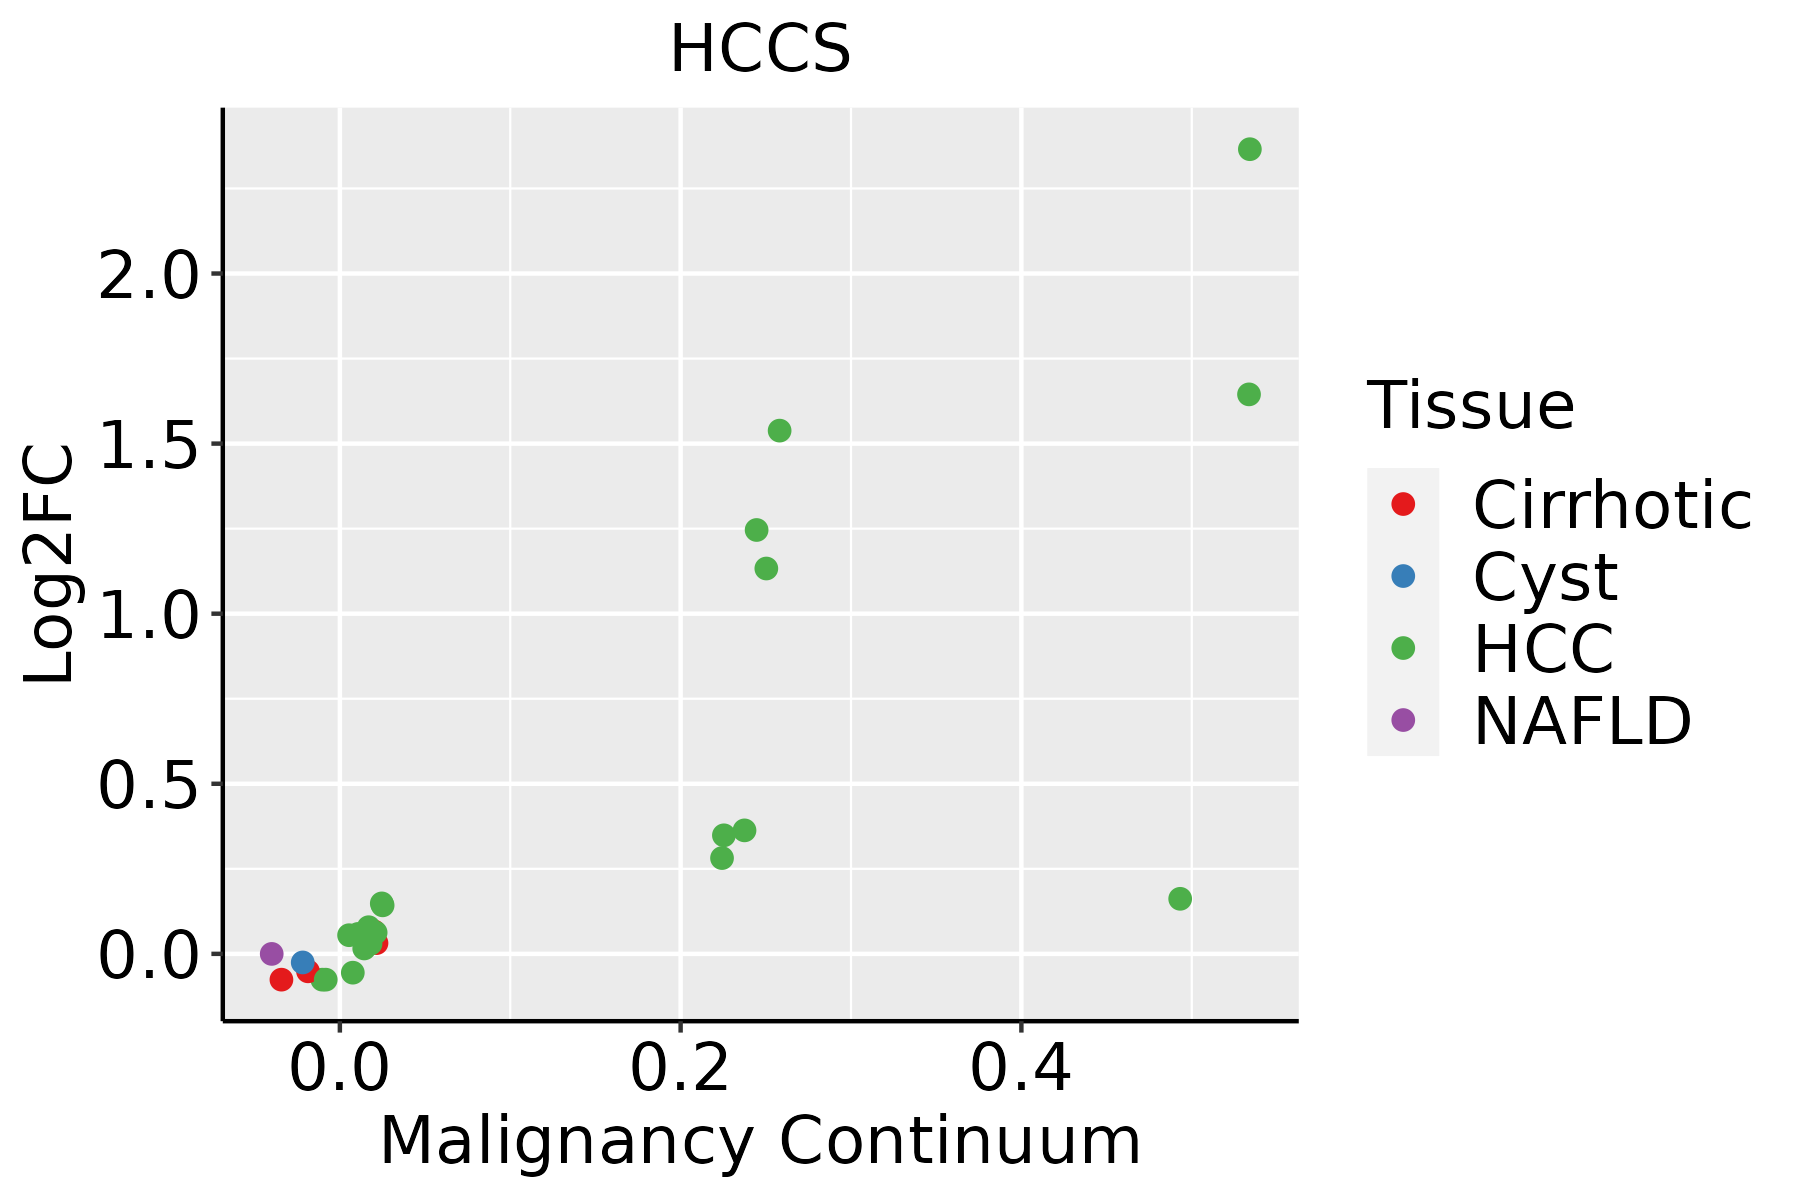 | HCC: Hepatocellular carcinoma |
| NAFLD: Non-alcoholic fatty liver disease | ||
| Oral Cavity |  | EOLP: Erosive Oral lichen planus |
| LP: leukoplakia | ||
| NEOLP: Non-erosive oral lichen planus | ||
| OSCC: Oral squamous cell carcinoma | ||
| Skin | 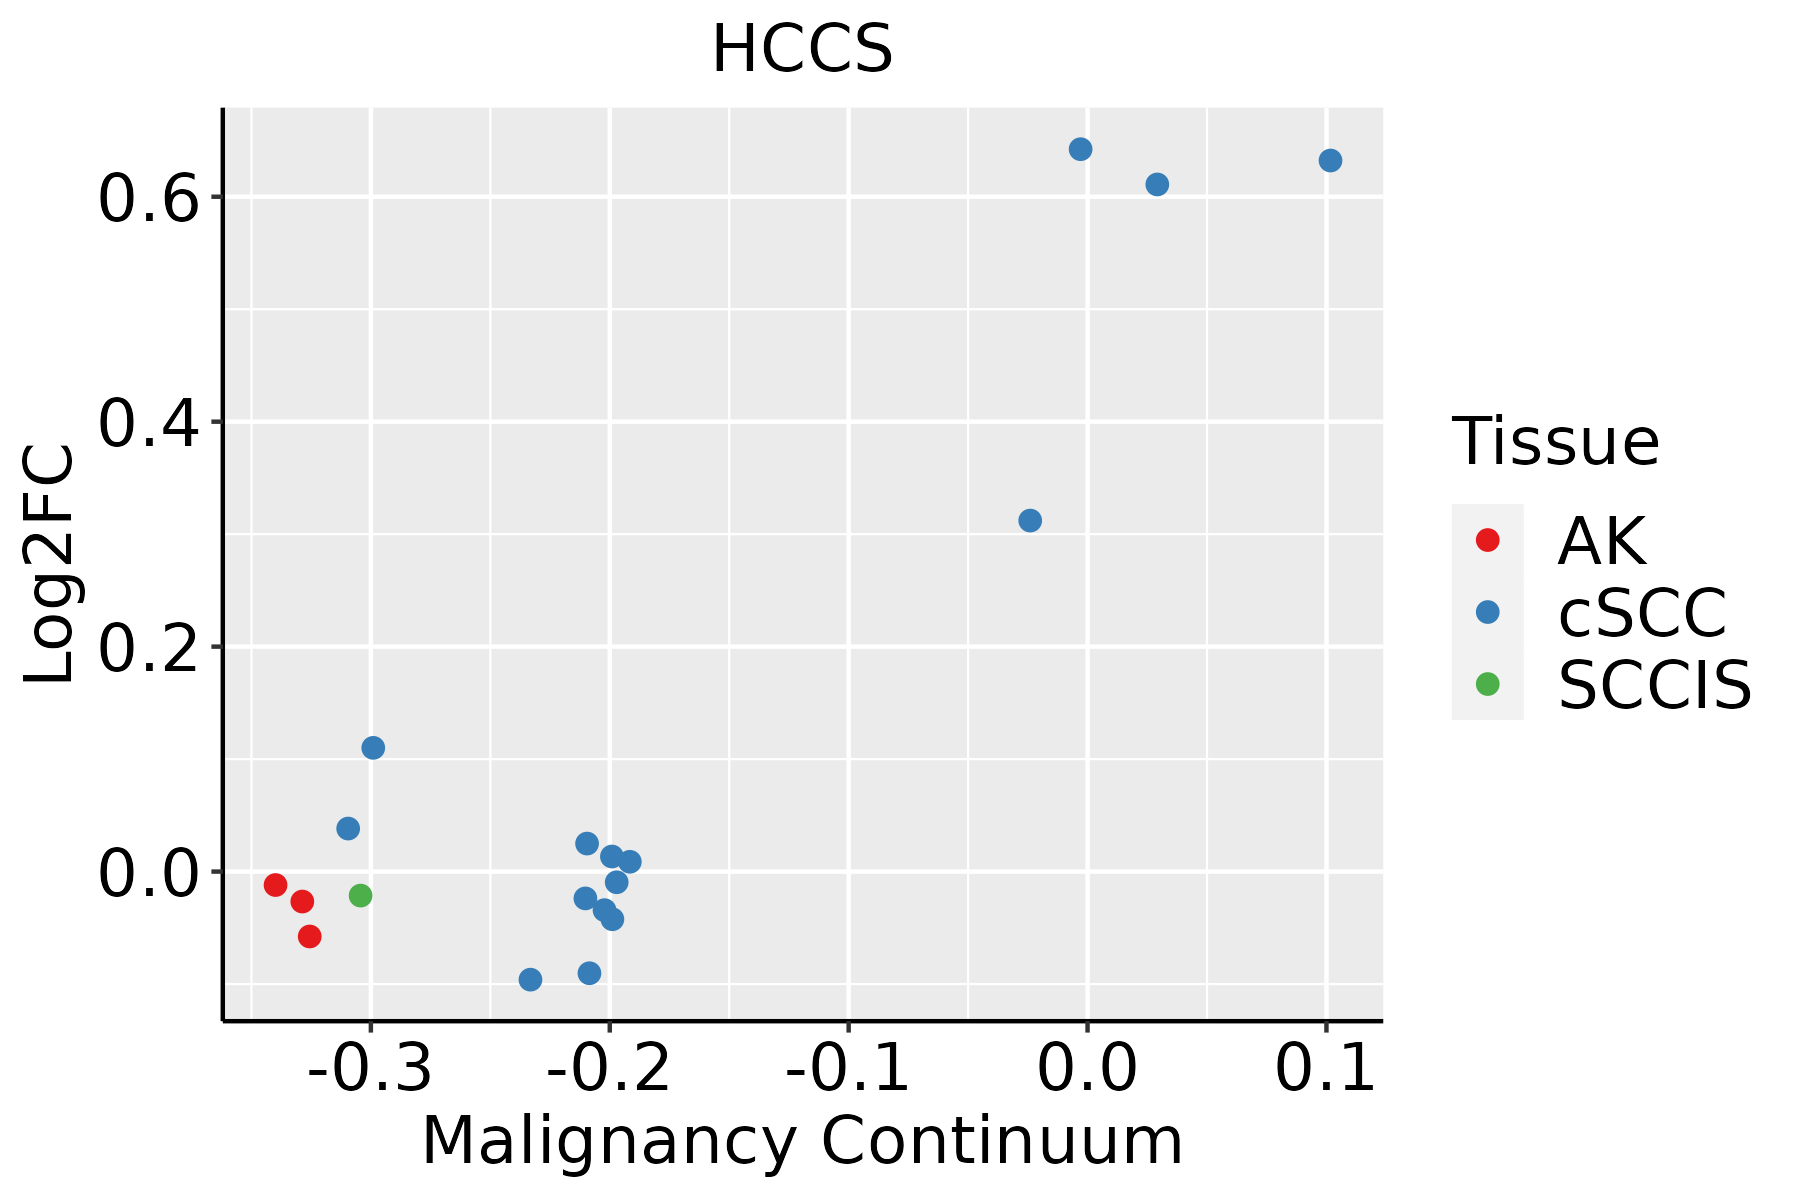 | AK: Actinic keratosis |
| cSCC: Cutaneous squamous cell carcinoma | ||
| SCCIS:squamous cell carcinoma in situ |
| ∗log2FC in expression of this searched gene in stem-like cells from each diseased tissue sample relative to stem-like cells in normal samples in each tissue plotted against the malignancy continuum. Samples are colored based on if they are from different disease stage. |
Top |
Malignant transformation related pathway analysis |
| Find out the enriched GO biological processes and KEGG pathways involved in transition from healthy to precancer to cancer |
| Tissue | Disease Stage | Enriched GO biological Processes |
| Colorectum | AD |  |
| Colorectum | SER |  |
| Colorectum | MSS |  |
| Colorectum | MSI-H |  |
| Colorectum | FAP |  |
| ∗Top 15 enriched GO BP terms are showed in the bar plot of each disease state in each tissue. Each row represents a significant GO biological process which is colored according to the -log10(p.adjust). |
| Page: 1 2 3 4 5 6 7 8 9 |
| GO ID | Tissue | Disease Stage | Description | Gene Ratio | Bg Ratio | pvalue | p.adjust | Count |
| GO:001700413 | Esophagus | ESCC | cytochrome complex assembly | 34/8552 | 36/18723 | 5.08e-10 | 1.31e-08 | 34 |
| GO:0017004 | Liver | Cirrhotic | cytochrome complex assembly | 22/4634 | 36/18723 | 3.92e-06 | 6.70e-05 | 22 |
| GO:00170041 | Liver | HCC | cytochrome complex assembly | 30/7958 | 36/18723 | 5.69e-07 | 9.03e-06 | 30 |
| GO:00170043 | Oral cavity | OSCC | cytochrome complex assembly | 31/7305 | 36/18723 | 7.28e-09 | 1.53e-07 | 31 |
| GO:001700412 | Oral cavity | LP | cytochrome complex assembly | 25/4623 | 36/18723 | 1.93e-08 | 7.11e-07 | 25 |
| GO:00170045 | Skin | cSCC | cytochrome complex assembly | 22/4864 | 36/18723 | 9.20e-06 | 1.21e-04 | 22 |
| Page: 1 |
| Pathway ID | Tissue | Disease Stage | Description | Gene Ratio | Bg Ratio | pvalue | p.adjust | qvalue | Count |
| Page: 1 |
Top |
Cell-cell communication analysis |
| Identification of potential cell-cell interactions between two cell types and their ligand-receptor pairs for different disease states |
| Ligand | Receptor | LRpair | Pathway | Tissue | Disease Stage |
| Page: 1 |
Top |
Single-cell gene regulatory network inference analysis |
| Find out the significant the regulons (TFs) and the target genes of each regulon across cell types for different disease states |
| TF | Cell Type | Tissue | Disease Stage | Target Gene | RSS | Regulon Activity |
| ∗The dot plots of a searched regulon are shown for all cell subpopulations in each disease state of each tissue based on the regulon specific score inferred using pySCENIC and by calculating the average expression. |
| Page: 1 |
Top |
Somatic mutation of malignant transformation related genes |
| Annotation of somatic variants for genes involved in malignant transformation |
| Hugo Symbol | Variant Class | Variant Classification | dbSNP RS | HGVSc | HGVSp | HGVSp Short | SWISSPROT | BIOTYPE | SIFT | PolyPhen | Tumor Sample Barcode | Tissue | Histology | Sex | Age | Stage | Therapy Types | Drugs | Outcome |
| HCCS | SNV | Missense_Mutation | novel | c.14N>A | p.Pro5Gln | p.P5Q | P53701 | protein_coding | tolerated_low_confidence(0.21) | benign(0.03) | TCGA-AN-A0FV-01 | Breast | breast invasive carcinoma | Female | <65 | I/II | Unknown | Unknown | SD |
| HCCS | SNV | Missense_Mutation | c.455N>A | p.Arg152Lys | p.R152K | P53701 | protein_coding | tolerated(1) | benign(0.003) | TCGA-GM-A2DO-01 | Breast | breast invasive carcinoma | Female | <65 | I/II | Hormone Therapy | tamoxiphen | CR | |
| HCCS | SNV | Missense_Mutation | novel | c.62N>A | p.Pro21Gln | p.P21Q | P53701 | protein_coding | deleterious_low_confidence(0.01) | benign(0.261) | TCGA-OL-A6VO-01 | Breast | breast invasive carcinoma | Female | <65 | I/II | Chemotherapy | taxotere | CR |
| HCCS | insertion | In_Frame_Ins | novel | c.72_73insTGGTTTCTCAGCGAC | p.Gly24_Cys25insTrpPheLeuSerAsp | p.G24_C25insWFLSD | P53701 | protein_coding | TCGA-AN-A0FX-01 | Breast | breast invasive carcinoma | Female | <65 | I/II | Unknown | Unknown | SD | ||
| HCCS | insertion | Nonsense_Mutation | novel | c.764_765insGGCTTAGGTCTCTTCCCC | p.Val255_Trp256insAlaTerValSerSerPro | p.V255_W256insA*VSSP | P53701 | protein_coding | TCGA-B6-A0I5-01 | Breast | breast invasive carcinoma | Female | <65 | I/II | Unknown | Unknown | SD | ||
| HCCS | deletion | Frame_Shift_Del | novel | c.71delG | p.Gly24AspfsTer9 | p.G24Dfs*9 | P53701 | protein_coding | TCGA-EW-A2FV-01 | Breast | breast invasive carcinoma | Female | <65 | III/IV | Chemotherapy | docetaxel | SD | ||
| HCCS | SNV | Missense_Mutation | novel | c.523N>C | p.Glu175Gln | p.E175Q | P53701 | protein_coding | deleterious(0.03) | benign(0.314) | TCGA-MA-AA3Z-01 | Cervix | cervical & endocervical cancer | Female | <65 | I/II | Unknown | Unknown | SD |
| HCCS | SNV | Missense_Mutation | rs771870658 | c.343N>C | p.Glu115Gln | p.E115Q | P53701 | protein_coding | tolerated(0.11) | benign(0.024) | TCGA-MU-A51Y-01 | Cervix | cervical & endocervical cancer | Female | <65 | I/II | Unknown | Unknown | SD |
| HCCS | SNV | Missense_Mutation | c.77N>G | p.Pro26Arg | p.P26R | P53701 | protein_coding | deleterious(0) | probably_damaging(1) | TCGA-AD-6548-01 | Colorectum | colon adenocarcinoma | Female | >=65 | I/II | Unknown | Unknown | SD | |
| HCCS | SNV | Missense_Mutation | rs752050558 | c.253N>G | p.Met85Val | p.M85V | P53701 | protein_coding | deleterious(0) | possibly_damaging(0.897) | TCGA-AG-3881-01 | Colorectum | rectum adenocarcinoma | Female | >=65 | I/II | Unknown | Unknown | SD |
| Page: 1 2 3 4 |
Top |
Related drugs of malignant transformation related genes |
| Identification of chemicals and drugs interact with genes involved in malignant transfromation |
| (DGIdb 4.0) |
| Entrez ID | Symbol | Category | Interaction Types | Drug Claim Name | Drug Name | PMIDs |
| Page: 1 |

Copyright 2023-Present -The University of Texas Health Science Center at Houston |