
|
|||||
|
 | |
| |
| |
| |
| |
| |
|
Gene: HBS1L |
Gene summary for HBS1L |
| Gene information | Species | Human | Gene symbol | HBS1L | Gene ID | 10767 |
| Gene name | HBS1 like translational GTPase | |
| Gene Alias | EF-1a | |
| Cytomap | 6q23.3 | |
| Gene Type | protein-coding | GO ID | GO:0006412 | UniProtAcc | Q9Y450 |
Top |
Malignant transformation analysis |
| Identification of the aberrant gene expression in precancerous and cancerous lesions by comparing the gene expression of stem-like cells in diseased tissues with normal stem cells |
| Entrez ID | Symbol | Replicates | Species | Organ | Tissue | Adj P-value | Log2FC | Malignancy |
| 10767 | HBS1L | LZE2T | Human | Esophagus | ESCC | 8.24e-07 | 5.11e-01 | 0.082 |
| 10767 | HBS1L | LZE4T | Human | Esophagus | ESCC | 5.99e-10 | 3.01e-01 | 0.0811 |
| 10767 | HBS1L | LZE7T | Human | Esophagus | ESCC | 5.07e-09 | 8.39e-01 | 0.0667 |
| 10767 | HBS1L | LZE8T | Human | Esophagus | ESCC | 4.91e-08 | 2.50e-01 | 0.067 |
| 10767 | HBS1L | LZE20T | Human | Esophagus | ESCC | 3.51e-04 | 8.97e-02 | 0.0662 |
| 10767 | HBS1L | LZE22T | Human | Esophagus | ESCC | 8.26e-04 | 1.83e-01 | 0.068 |
| 10767 | HBS1L | LZE24T | Human | Esophagus | ESCC | 7.47e-15 | 2.82e-01 | 0.0596 |
| 10767 | HBS1L | LZE21T | Human | Esophagus | ESCC | 4.93e-04 | 3.53e-01 | 0.0655 |
| 10767 | HBS1L | LZE6T | Human | Esophagus | ESCC | 2.68e-07 | 2.29e-01 | 0.0845 |
| 10767 | HBS1L | P1T-E | Human | Esophagus | ESCC | 1.16e-03 | 2.85e-01 | 0.0875 |
| 10767 | HBS1L | P2T-E | Human | Esophagus | ESCC | 4.84e-54 | 1.15e+00 | 0.1177 |
| 10767 | HBS1L | P4T-E | Human | Esophagus | ESCC | 1.04e-12 | 4.37e-01 | 0.1323 |
| 10767 | HBS1L | P5T-E | Human | Esophagus | ESCC | 2.76e-14 | 3.04e-01 | 0.1327 |
| 10767 | HBS1L | P8T-E | Human | Esophagus | ESCC | 9.45e-19 | 3.08e-01 | 0.0889 |
| 10767 | HBS1L | P9T-E | Human | Esophagus | ESCC | 1.98e-07 | 1.37e-01 | 0.1131 |
| 10767 | HBS1L | P10T-E | Human | Esophagus | ESCC | 9.05e-27 | 3.62e-01 | 0.116 |
| 10767 | HBS1L | P11T-E | Human | Esophagus | ESCC | 5.51e-09 | 2.66e-01 | 0.1426 |
| 10767 | HBS1L | P12T-E | Human | Esophagus | ESCC | 8.53e-20 | 4.93e-01 | 0.1122 |
| 10767 | HBS1L | P15T-E | Human | Esophagus | ESCC | 3.97e-25 | 6.13e-01 | 0.1149 |
| 10767 | HBS1L | P16T-E | Human | Esophagus | ESCC | 1.54e-50 | 9.20e-01 | 0.1153 |
| Page: 1 2 3 4 5 6 |
| Tissue | Expression Dynamics | Abbreviation |
| Esophagus | 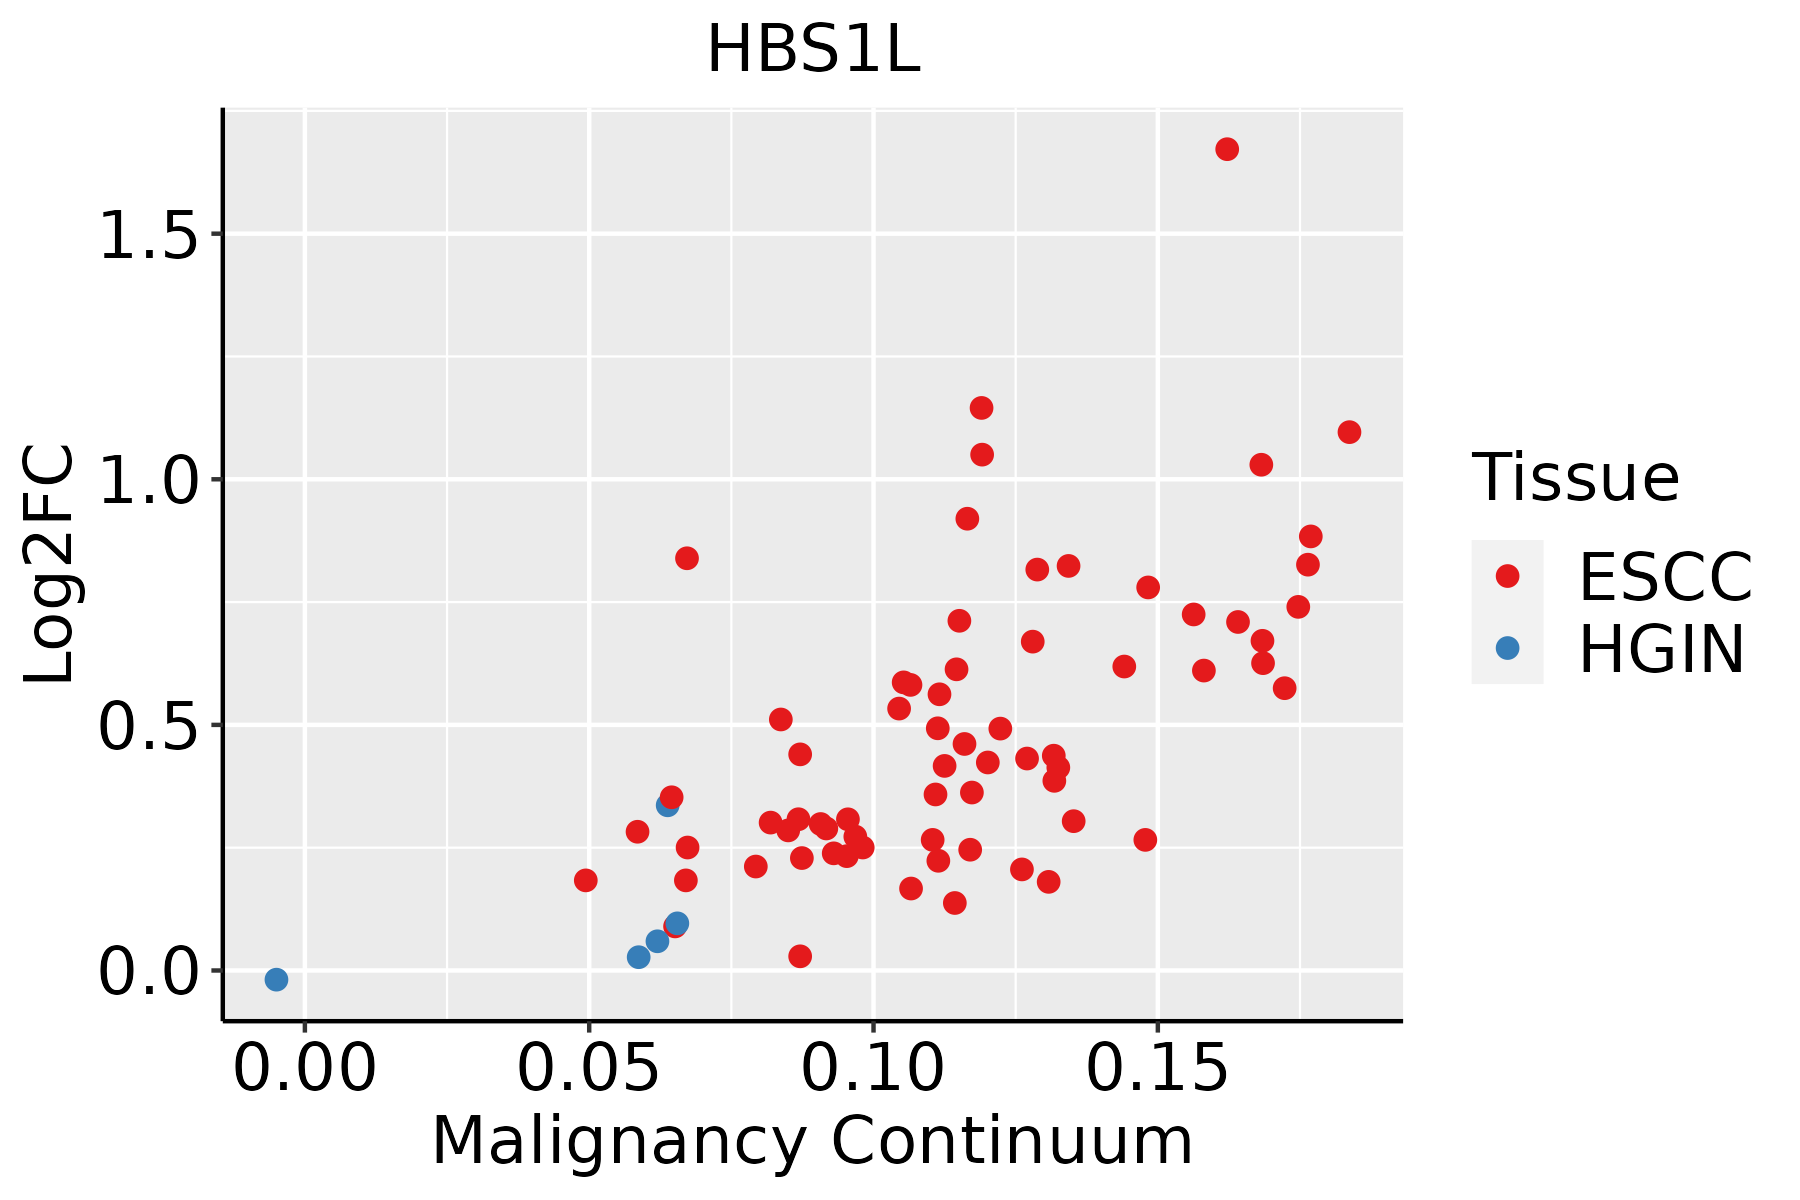 | ESCC: Esophageal squamous cell carcinoma |
| HGIN: High-grade intraepithelial neoplasias | ||
| LGIN: Low-grade intraepithelial neoplasias | ||
| Liver |  | HCC: Hepatocellular carcinoma |
| NAFLD: Non-alcoholic fatty liver disease | ||
| Oral Cavity |  | EOLP: Erosive Oral lichen planus |
| LP: leukoplakia | ||
| NEOLP: Non-erosive oral lichen planus | ||
| OSCC: Oral squamous cell carcinoma | ||
| Skin |  | AK: Actinic keratosis |
| cSCC: Cutaneous squamous cell carcinoma | ||
| SCCIS:squamous cell carcinoma in situ | ||
| Thyroid | 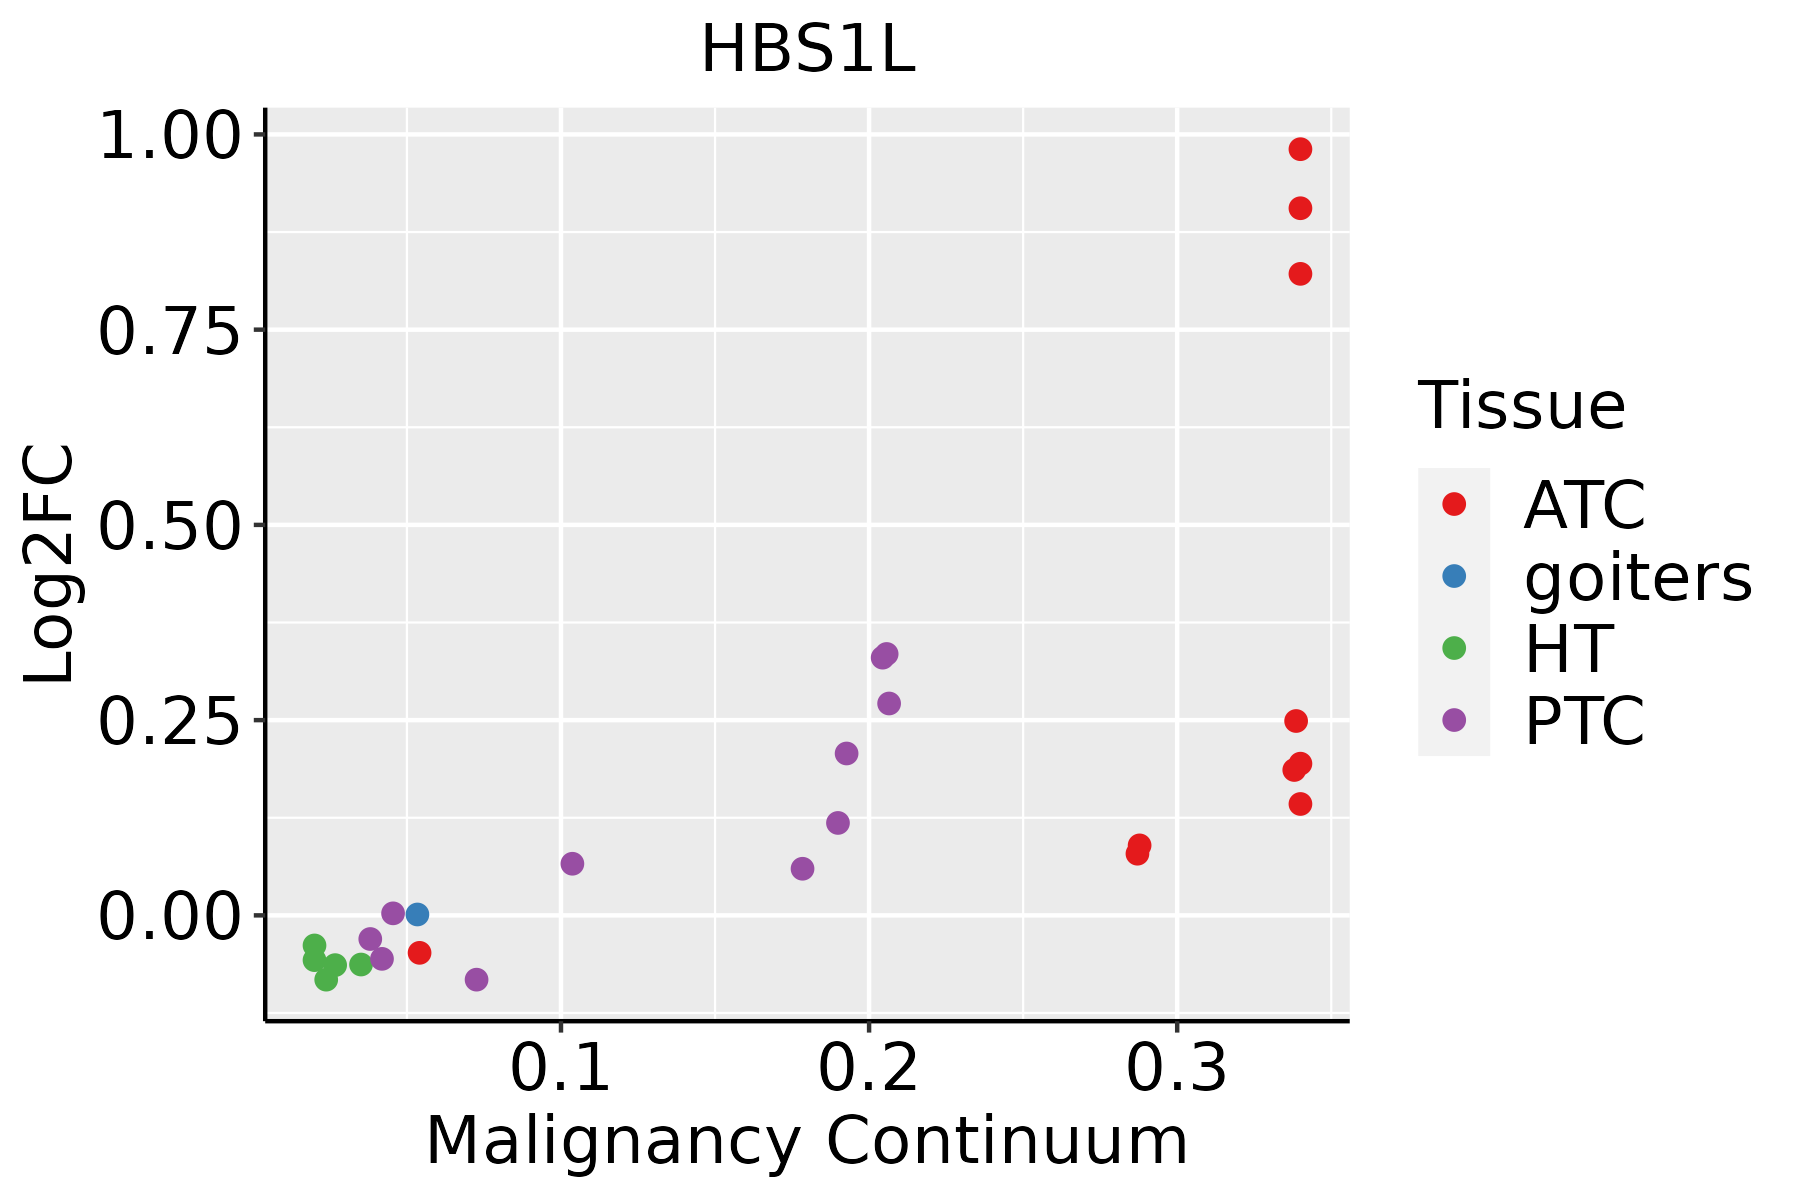 | ATC: Anaplastic thyroid cancer |
| HT: Hashimoto's thyroiditis | ||
| PTC: Papillary thyroid cancer |
| ∗log2FC in expression of this searched gene in stem-like cells from each diseased tissue sample relative to stem-like cells in normal samples in each tissue plotted against the malignancy continuum. Samples are colored based on if they are from different disease stage. |
Top |
Malignant transformation related pathway analysis |
| Find out the enriched GO biological processes and KEGG pathways involved in transition from healthy to precancer to cancer |
| Tissue | Disease Stage | Enriched GO biological Processes |
| Colorectum | AD |  |
| Colorectum | SER |  |
| Colorectum | MSS |  |
| Colorectum | MSI-H |  |
| Colorectum | FAP |  |
| ∗Top 15 enriched GO BP terms are showed in the bar plot of each disease state in each tissue. Each row represents a significant GO biological process which is colored according to the -log10(p.adjust). |
| Page: 1 2 3 4 5 6 7 8 9 |
| GO ID | Tissue | Disease Stage | Description | Gene Ratio | Bg Ratio | pvalue | p.adjust | Count |
| GO:0006417111 | Esophagus | ESCC | regulation of translation | 304/8552 | 468/18723 | 1.53e-17 | 1.33e-15 | 304 |
| GO:000641419 | Esophagus | ESCC | translational elongation | 41/8552 | 55/18723 | 1.26e-05 | 1.16e-04 | 41 |
| GO:000641722 | Liver | HCC | regulation of translation | 287/7958 | 468/18723 | 8.79e-17 | 8.08e-15 | 287 |
| GO:000641412 | Liver | HCC | translational elongation | 36/7958 | 55/18723 | 4.94e-04 | 3.23e-03 | 36 |
| GO:000641720 | Oral cavity | OSCC | regulation of translation | 274/7305 | 468/18723 | 4.39e-18 | 4.63e-16 | 274 |
| GO:000641416 | Oral cavity | OSCC | translational elongation | 37/7305 | 55/18723 | 2.03e-05 | 1.94e-04 | 37 |
| GO:0006417110 | Oral cavity | LP | regulation of translation | 175/4623 | 468/18723 | 4.49e-10 | 2.22e-08 | 175 |
| GO:000641417 | Oral cavity | LP | translational elongation | 25/4623 | 55/18723 | 6.27e-04 | 5.71e-03 | 25 |
| GO:000641726 | Oral cavity | EOLP | regulation of translation | 108/2218 | 468/18723 | 4.04e-12 | 7.34e-10 | 108 |
| GO:000641422 | Oral cavity | EOLP | translational elongation | 17/2218 | 55/18723 | 1.36e-04 | 1.48e-03 | 17 |
| GO:000641728 | Skin | AK | regulation of translation | 102/1910 | 468/18723 | 6.79e-14 | 2.36e-11 | 102 |
| GO:000641420 | Skin | AK | translational elongation | 12/1910 | 55/18723 | 8.41e-03 | 4.16e-02 | 12 |
| GO:000641729 | Skin | cSCC | regulation of translation | 226/4864 | 468/18723 | 8.78e-26 | 2.62e-23 | 226 |
| GO:000641423 | Skin | cSCC | translational elongation | 30/4864 | 55/18723 | 6.13e-06 | 8.70e-05 | 30 |
| GO:0006417113 | Thyroid | PTC | regulation of translation | 236/5968 | 468/18723 | 2.70e-17 | 2.52e-15 | 236 |
| GO:000641735 | Thyroid | ATC | regulation of translation | 236/6293 | 468/18723 | 2.39e-14 | 1.34e-12 | 236 |
| Page: 1 |
| Pathway ID | Tissue | Disease Stage | Description | Gene Ratio | Bg Ratio | pvalue | p.adjust | qvalue | Count |
| hsa0301524 | Esophagus | ESCC | mRNA surveillance pathway | 72/4205 | 97/8465 | 6.12e-07 | 4.10e-06 | 2.10e-06 | 72 |
| hsa0513428 | Esophagus | ESCC | Legionellosis | 42/4205 | 57/8465 | 1.83e-04 | 6.90e-04 | 3.53e-04 | 42 |
| hsa0301534 | Esophagus | ESCC | mRNA surveillance pathway | 72/4205 | 97/8465 | 6.12e-07 | 4.10e-06 | 2.10e-06 | 72 |
| hsa0513436 | Esophagus | ESCC | Legionellosis | 42/4205 | 57/8465 | 1.83e-04 | 6.90e-04 | 3.53e-04 | 42 |
| hsa0301521 | Liver | HCC | mRNA surveillance pathway | 66/4020 | 97/8465 | 3.16e-05 | 1.88e-04 | 1.04e-04 | 66 |
| hsa0301531 | Liver | HCC | mRNA surveillance pathway | 66/4020 | 97/8465 | 3.16e-05 | 1.88e-04 | 1.04e-04 | 66 |
| hsa030158 | Oral cavity | OSCC | mRNA surveillance pathway | 75/3704 | 97/8465 | 1.30e-11 | 2.01e-10 | 1.02e-10 | 75 |
| hsa0513425 | Oral cavity | OSCC | Legionellosis | 42/3704 | 57/8465 | 4.18e-06 | 2.15e-05 | 1.10e-05 | 42 |
| hsa0301513 | Oral cavity | OSCC | mRNA surveillance pathway | 75/3704 | 97/8465 | 1.30e-11 | 2.01e-10 | 1.02e-10 | 75 |
| hsa05134111 | Oral cavity | OSCC | Legionellosis | 42/3704 | 57/8465 | 4.18e-06 | 2.15e-05 | 1.10e-05 | 42 |
| hsa0301523 | Oral cavity | LP | mRNA surveillance pathway | 50/2418 | 97/8465 | 1.39e-06 | 1.50e-05 | 9.66e-06 | 50 |
| hsa0513426 | Oral cavity | LP | Legionellosis | 33/2418 | 57/8465 | 3.29e-06 | 3.23e-05 | 2.08e-05 | 33 |
| hsa0301533 | Oral cavity | LP | mRNA surveillance pathway | 50/2418 | 97/8465 | 1.39e-06 | 1.50e-05 | 9.66e-06 | 50 |
| hsa0513435 | Oral cavity | LP | Legionellosis | 33/2418 | 57/8465 | 3.29e-06 | 3.23e-05 | 2.08e-05 | 33 |
| hsa0301541 | Oral cavity | EOLP | mRNA surveillance pathway | 30/1218 | 97/8465 | 2.26e-05 | 1.20e-04 | 7.07e-05 | 30 |
| hsa0513443 | Oral cavity | EOLP | Legionellosis | 18/1218 | 57/8465 | 7.27e-04 | 2.73e-03 | 1.61e-03 | 18 |
| hsa0301551 | Oral cavity | EOLP | mRNA surveillance pathway | 30/1218 | 97/8465 | 2.26e-05 | 1.20e-04 | 7.07e-05 | 30 |
| hsa0513453 | Oral cavity | EOLP | Legionellosis | 18/1218 | 57/8465 | 7.27e-04 | 2.73e-03 | 1.61e-03 | 18 |
| Page: 1 |
Top |
Cell-cell communication analysis |
| Identification of potential cell-cell interactions between two cell types and their ligand-receptor pairs for different disease states |
| Ligand | Receptor | LRpair | Pathway | Tissue | Disease Stage |
| Page: 1 |
Top |
Single-cell gene regulatory network inference analysis |
| Find out the significant the regulons (TFs) and the target genes of each regulon across cell types for different disease states |
| TF | Cell Type | Tissue | Disease Stage | Target Gene | RSS | Regulon Activity |
| ∗The dot plots of a searched regulon are shown for all cell subpopulations in each disease state of each tissue based on the regulon specific score inferred using pySCENIC and by calculating the average expression. |
| Page: 1 |
Top |
Somatic mutation of malignant transformation related genes |
| Annotation of somatic variants for genes involved in malignant transformation |
| Hugo Symbol | Variant Class | Variant Classification | dbSNP RS | HGVSc | HGVSp | HGVSp Short | SWISSPROT | BIOTYPE | SIFT | PolyPhen | Tumor Sample Barcode | Tissue | Histology | Sex | Age | Stage | Therapy Types | Drugs | Outcome |
| HBS1L | SNV | Missense_Mutation | c.1205C>T | p.Ala402Val | p.A402V | Q9Y450 | protein_coding | tolerated(0.08) | possibly_damaging(0.615) | TCGA-AC-A23H-01 | Breast | breast invasive carcinoma | Female | >=65 | I/II | Unknown | Unknown | PD | |
| HBS1L | SNV | Missense_Mutation | novel | c.869G>T | p.Arg290Ile | p.R290I | Q9Y450 | protein_coding | deleterious(0) | probably_damaging(0.989) | TCGA-AN-A046-01 | Breast | breast invasive carcinoma | Female | >=65 | I/II | Unknown | Unknown | SD |
| HBS1L | SNV | Missense_Mutation | rs370235823 | c.2003N>A | p.Arg668His | p.R668H | Q9Y450 | protein_coding | deleterious(0) | probably_damaging(1) | TCGA-AO-A128-01 | Breast | breast invasive carcinoma | Female | <65 | I/II | Chemotherapy | doxorubicin | SD |
| HBS1L | SNV | Missense_Mutation | c.1917G>C | p.Gln639His | p.Q639H | Q9Y450 | protein_coding | tolerated(0.08) | possibly_damaging(0.827) | TCGA-BH-A0DK-01 | Breast | breast invasive carcinoma | Female | <65 | I/II | Hormone Therapy | tamoxiphen | SD | |
| HBS1L | SNV | Missense_Mutation | rs758000781 | c.952G>A | p.Glu318Lys | p.E318K | Q9Y450 | protein_coding | deleterious(0) | probably_damaging(0.999) | TCGA-2W-A8YY-01 | Cervix | cervical & endocervical cancer | Female | <65 | I/II | Chemotherapy | cisplatin | CR |
| HBS1L | SNV | Missense_Mutation | rs540664818 | c.760C>T | p.Arg254Trp | p.R254W | Q9Y450 | protein_coding | deleterious(0) | probably_damaging(0.999) | TCGA-2W-A8YY-01 | Cervix | cervical & endocervical cancer | Female | <65 | I/II | Chemotherapy | cisplatin | CR |
| HBS1L | SNV | Missense_Mutation | c.1960N>C | p.Glu654Gln | p.E654Q | Q9Y450 | protein_coding | deleterious(0) | probably_damaging(1) | TCGA-C5-A3HE-01 | Cervix | cervical & endocervical cancer | Female | <65 | I/II | Unknown | Unknown | PD | |
| HBS1L | SNV | Missense_Mutation | novel | c.393N>C | p.Lys131Asn | p.K131N | Q9Y450 | protein_coding | tolerated(0.1) | benign(0.16) | TCGA-C5-A8XJ-01 | Cervix | cervical & endocervical cancer | Female | >=65 | I/II | Chemotherapy | cisplatin | SD |
| HBS1L | SNV | Missense_Mutation | rs774407298 | c.2002C>T | p.Arg668Cys | p.R668C | Q9Y450 | protein_coding | deleterious(0) | probably_damaging(1) | TCGA-5M-AAT6-01 | Colorectum | colon adenocarcinoma | Female | <65 | III/IV | Unknown | Unknown | PD |
| HBS1L | SNV | Missense_Mutation | rs777731477 | c.239G>A | p.Arg80His | p.R80H | Q9Y450 | protein_coding | deleterious(0.02) | possibly_damaging(0.755) | TCGA-A6-6653-01 | Colorectum | colon adenocarcinoma | Male | >=65 | I/II | Unknown | Unknown | SD |
| Page: 1 2 3 4 5 6 7 |
Top |
Related drugs of malignant transformation related genes |
| Identification of chemicals and drugs interact with genes involved in malignant transfromation |
| (DGIdb 4.0) |
| Entrez ID | Symbol | Category | Interaction Types | Drug Claim Name | Drug Name | PMIDs |
| Page: 1 |

Copyright 2023-Present -The University of Texas Health Science Center at Houston |