
|
|||||
|
 | |
| |
| |
| |
| |
| |
|
Gene: HBEGF |
Gene summary for HBEGF |
| Gene information | Species | Human | Gene symbol | HBEGF | Gene ID | 1839 |
| Gene name | heparin binding EGF like growth factor | |
| Gene Alias | DTR | |
| Cytomap | 5q31.3 | |
| Gene Type | protein-coding | GO ID | GO:0001558 | UniProtAcc | Q99075 |
Top |
Malignant transformation analysis |
| Identification of the aberrant gene expression in precancerous and cancerous lesions by comparing the gene expression of stem-like cells in diseased tissues with normal stem cells |
| Entrez ID | Symbol | Replicates | Species | Organ | Tissue | Adj P-value | Log2FC | Malignancy |
| 1839 | HBEGF | HSIL_HPV_1 | Human | Cervix | HSIL_HPV | 3.46e-02 | -1.61e-01 | 0.0116 |
| 1839 | HBEGF | sample1 | Human | Cervix | CC | 2.83e-05 | 5.23e-01 | 0.0959 |
| 1839 | HBEGF | T1 | Human | Cervix | CC | 3.56e-21 | 6.75e-01 | 0.0918 |
| 1839 | HBEGF | T2 | Human | Cervix | CC | 3.10e-04 | 4.79e-01 | 0.0709 |
| 1839 | HBEGF | LZE21D1 | Human | Esophagus | HGIN | 2.75e-05 | -6.87e-01 | 0.0632 |
| 1839 | HBEGF | LZE24T | Human | Esophagus | ESCC | 3.18e-10 | -7.38e-01 | 0.0596 |
| 1839 | HBEGF | LZE6T | Human | Esophagus | ESCC | 3.64e-03 | -5.82e-01 | 0.0845 |
| 1839 | HBEGF | P1T-E | Human | Esophagus | ESCC | 7.73e-03 | 1.03e-01 | 0.0875 |
| 1839 | HBEGF | P2T-E | Human | Esophagus | ESCC | 2.39e-06 | -6.34e-01 | 0.1177 |
| 1839 | HBEGF | P10T-E | Human | Esophagus | ESCC | 8.88e-37 | -8.45e-01 | 0.116 |
| 1839 | HBEGF | P11T-E | Human | Esophagus | ESCC | 1.09e-10 | 1.45e+00 | 0.1426 |
| 1839 | HBEGF | P12T-E | Human | Esophagus | ESCC | 6.77e-11 | -3.97e-01 | 0.1122 |
| 1839 | HBEGF | P16T-E | Human | Esophagus | ESCC | 4.27e-28 | -7.89e-01 | 0.1153 |
| 1839 | HBEGF | P20T-E | Human | Esophagus | ESCC | 9.06e-07 | 1.66e+00 | 0.1124 |
| 1839 | HBEGF | P22T-E | Human | Esophagus | ESCC | 1.58e-08 | -2.60e-01 | 0.1236 |
| 1839 | HBEGF | P24T-E | Human | Esophagus | ESCC | 1.90e-07 | -5.39e-01 | 0.1287 |
| 1839 | HBEGF | P28T-E | Human | Esophagus | ESCC | 4.94e-17 | 1.34e+00 | 0.1149 |
| 1839 | HBEGF | P30T-E | Human | Esophagus | ESCC | 9.05e-11 | 1.27e+00 | 0.137 |
| 1839 | HBEGF | P38T-E | Human | Esophagus | ESCC | 1.66e-04 | -6.05e-01 | 0.127 |
| 1839 | HBEGF | P39T-E | Human | Esophagus | ESCC | 1.55e-05 | -4.38e-01 | 0.0894 |
| Page: 1 2 3 4 5 |
| Tissue | Expression Dynamics | Abbreviation |
| Cervix | 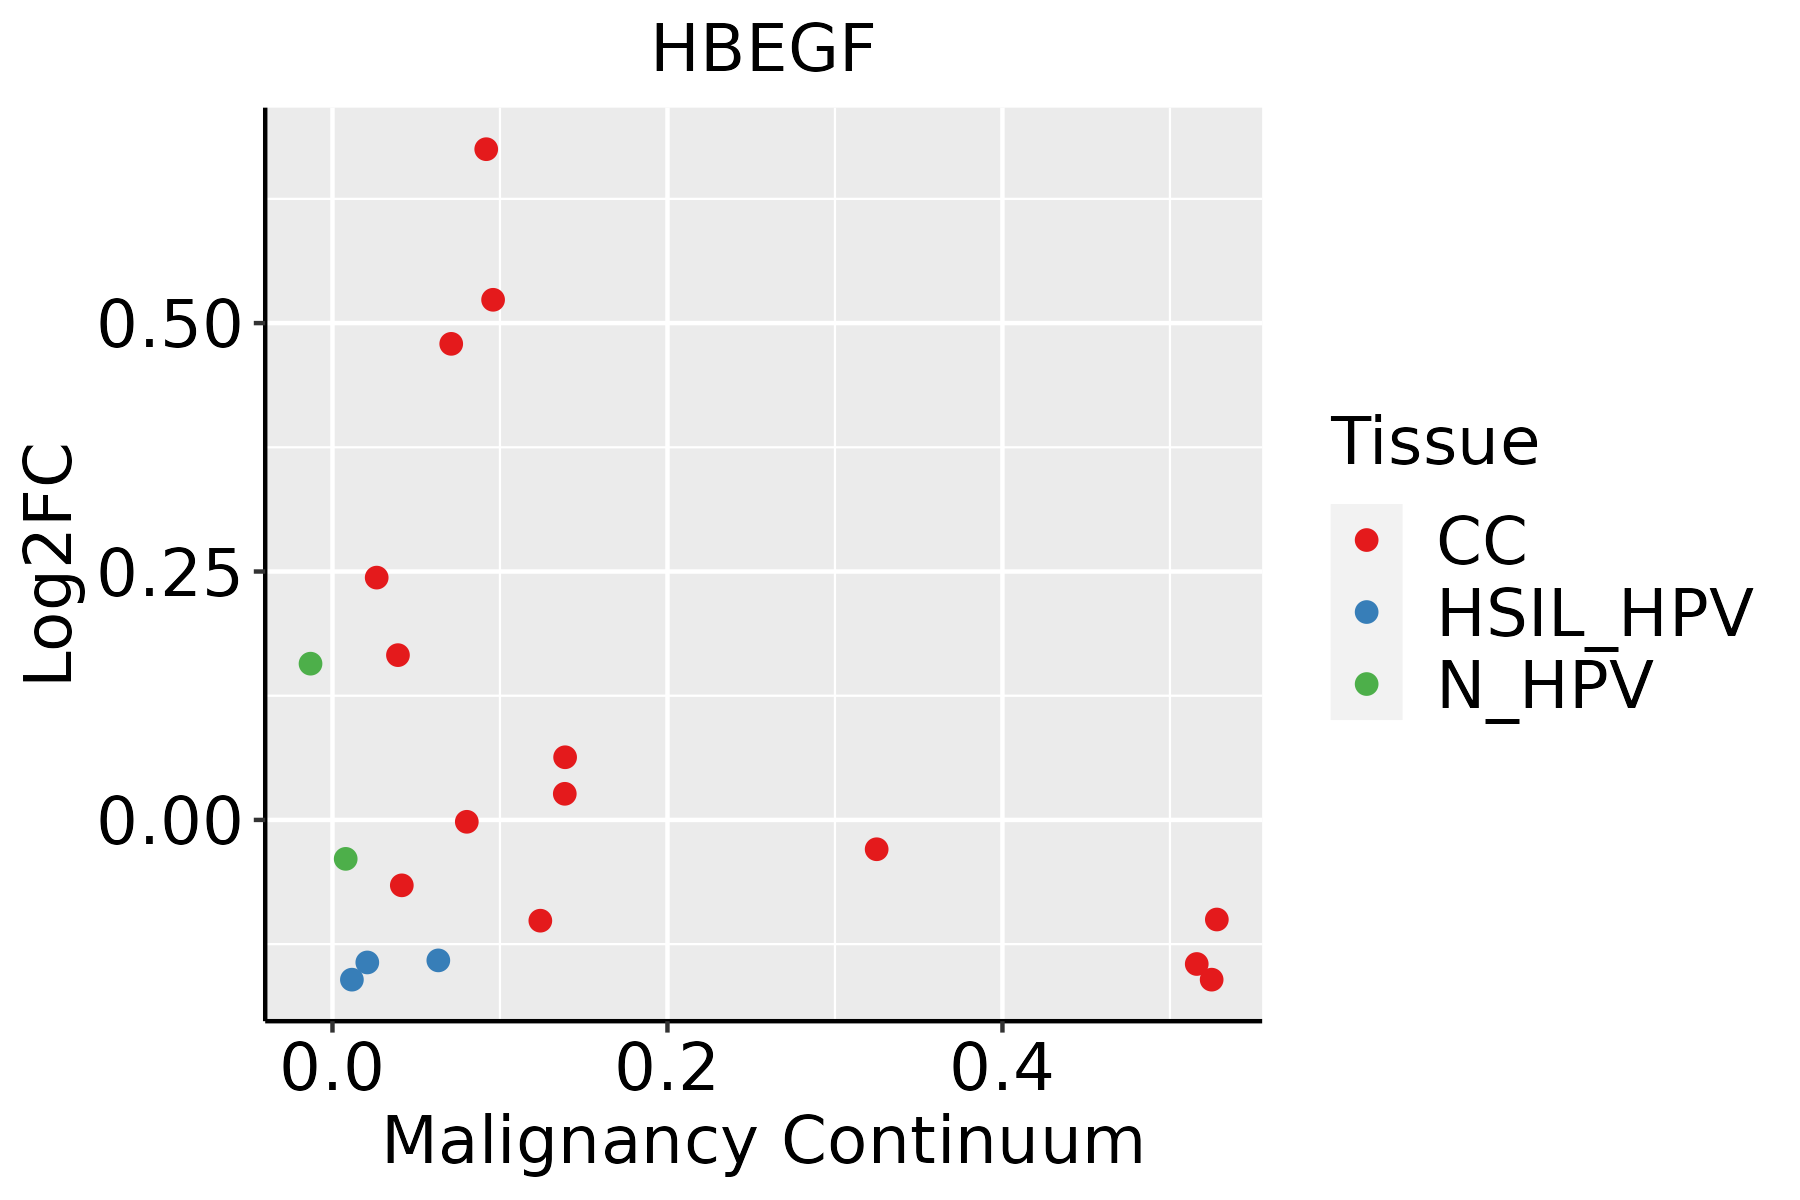 | CC: Cervix cancer |
| HSIL_HPV: HPV-infected high-grade squamous intraepithelial lesions | ||
| N_HPV: HPV-infected normal cervix | ||
| Esophagus | 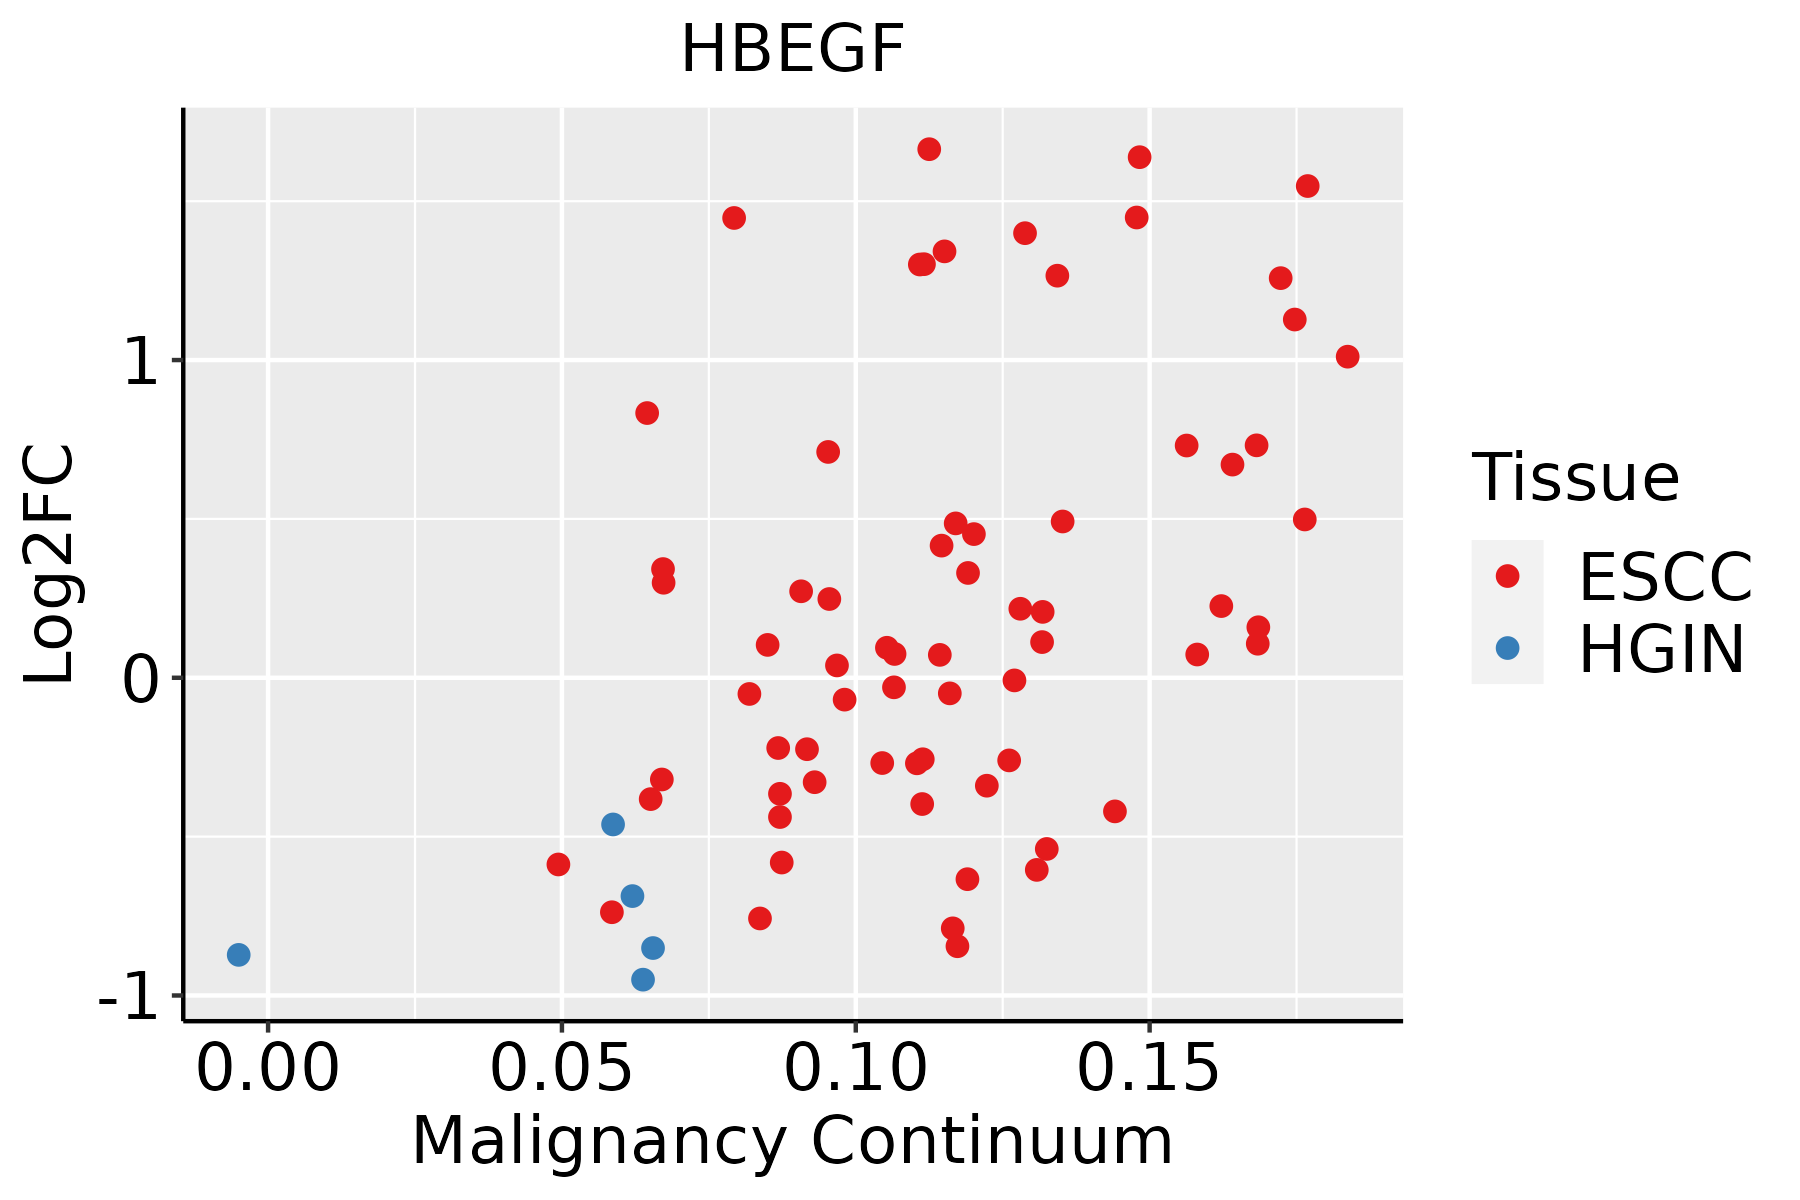 | ESCC: Esophageal squamous cell carcinoma |
| HGIN: High-grade intraepithelial neoplasias | ||
| LGIN: Low-grade intraepithelial neoplasias | ||
| Oral Cavity | 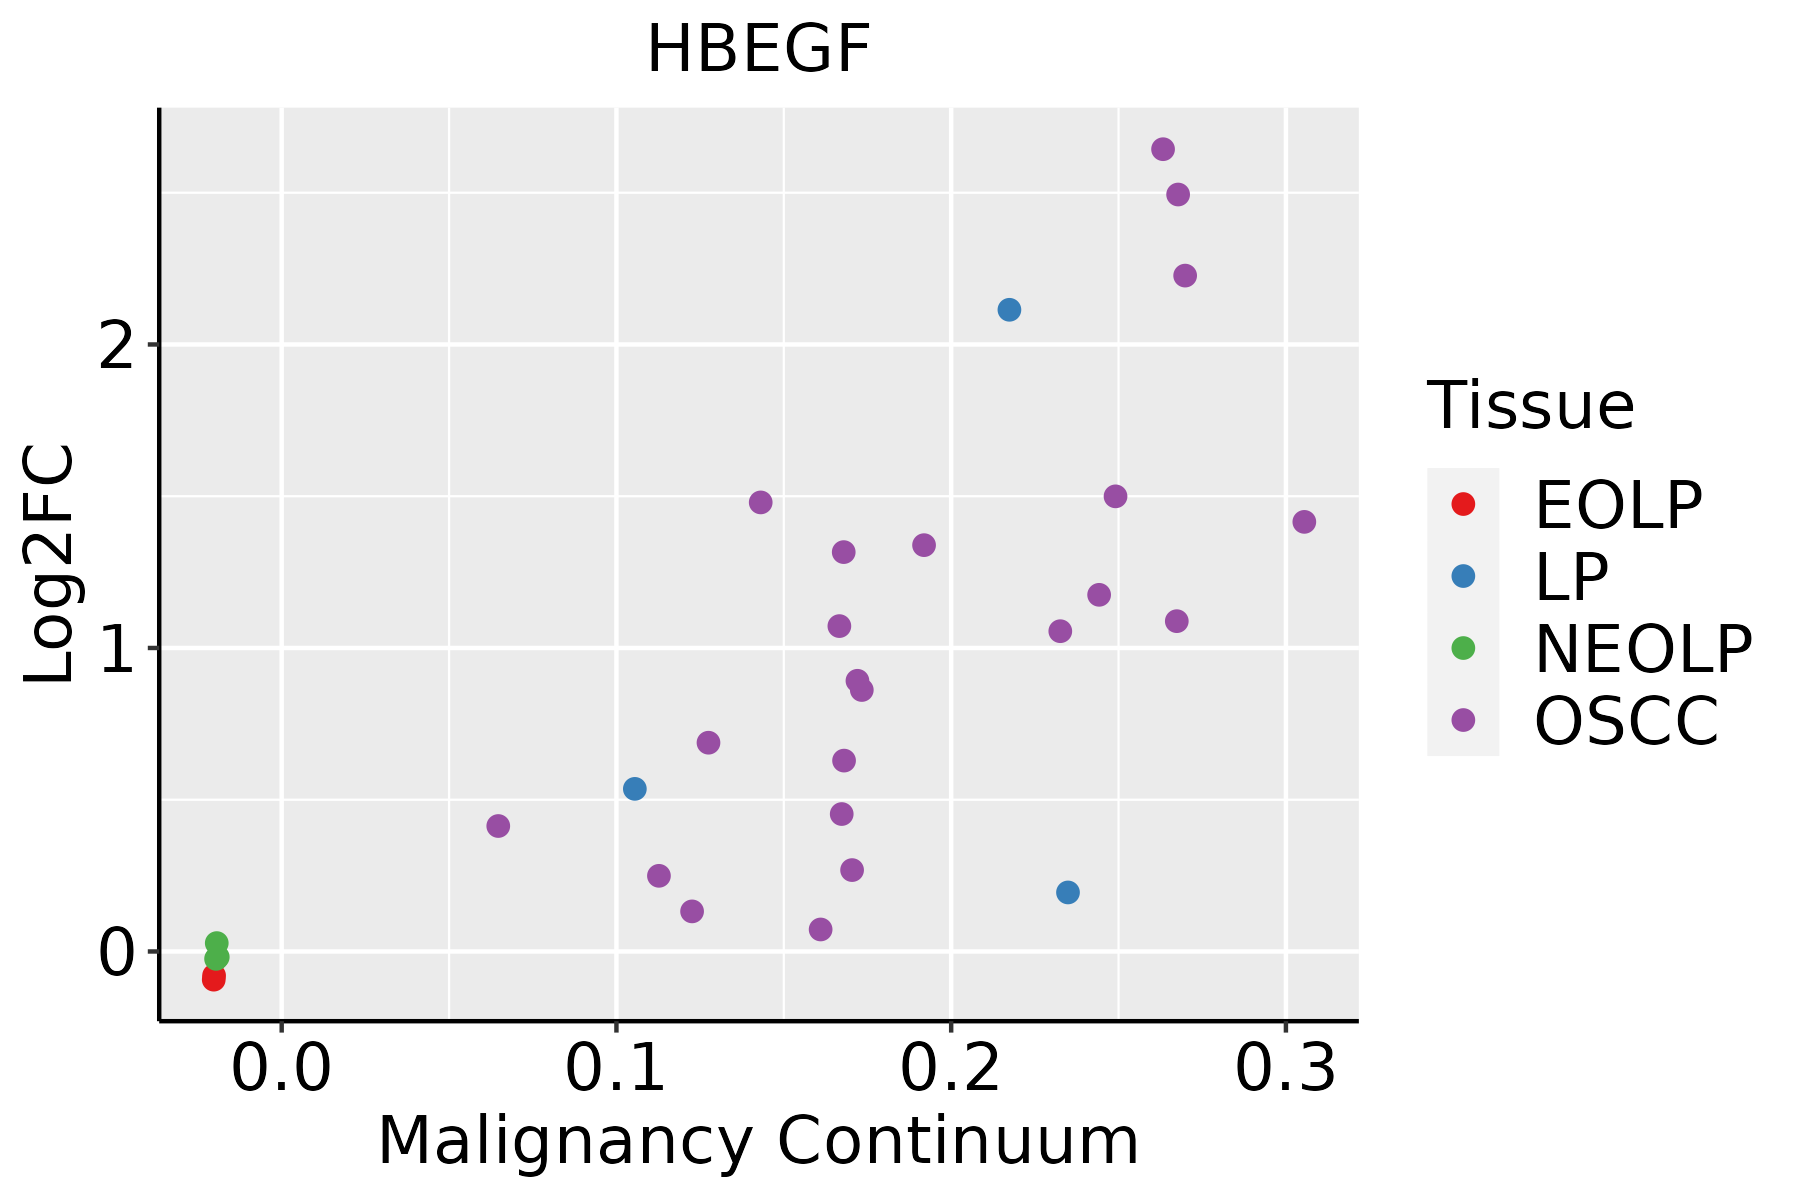 | EOLP: Erosive Oral lichen planus |
| LP: leukoplakia | ||
| NEOLP: Non-erosive oral lichen planus | ||
| OSCC: Oral squamous cell carcinoma | ||
| Prostate | 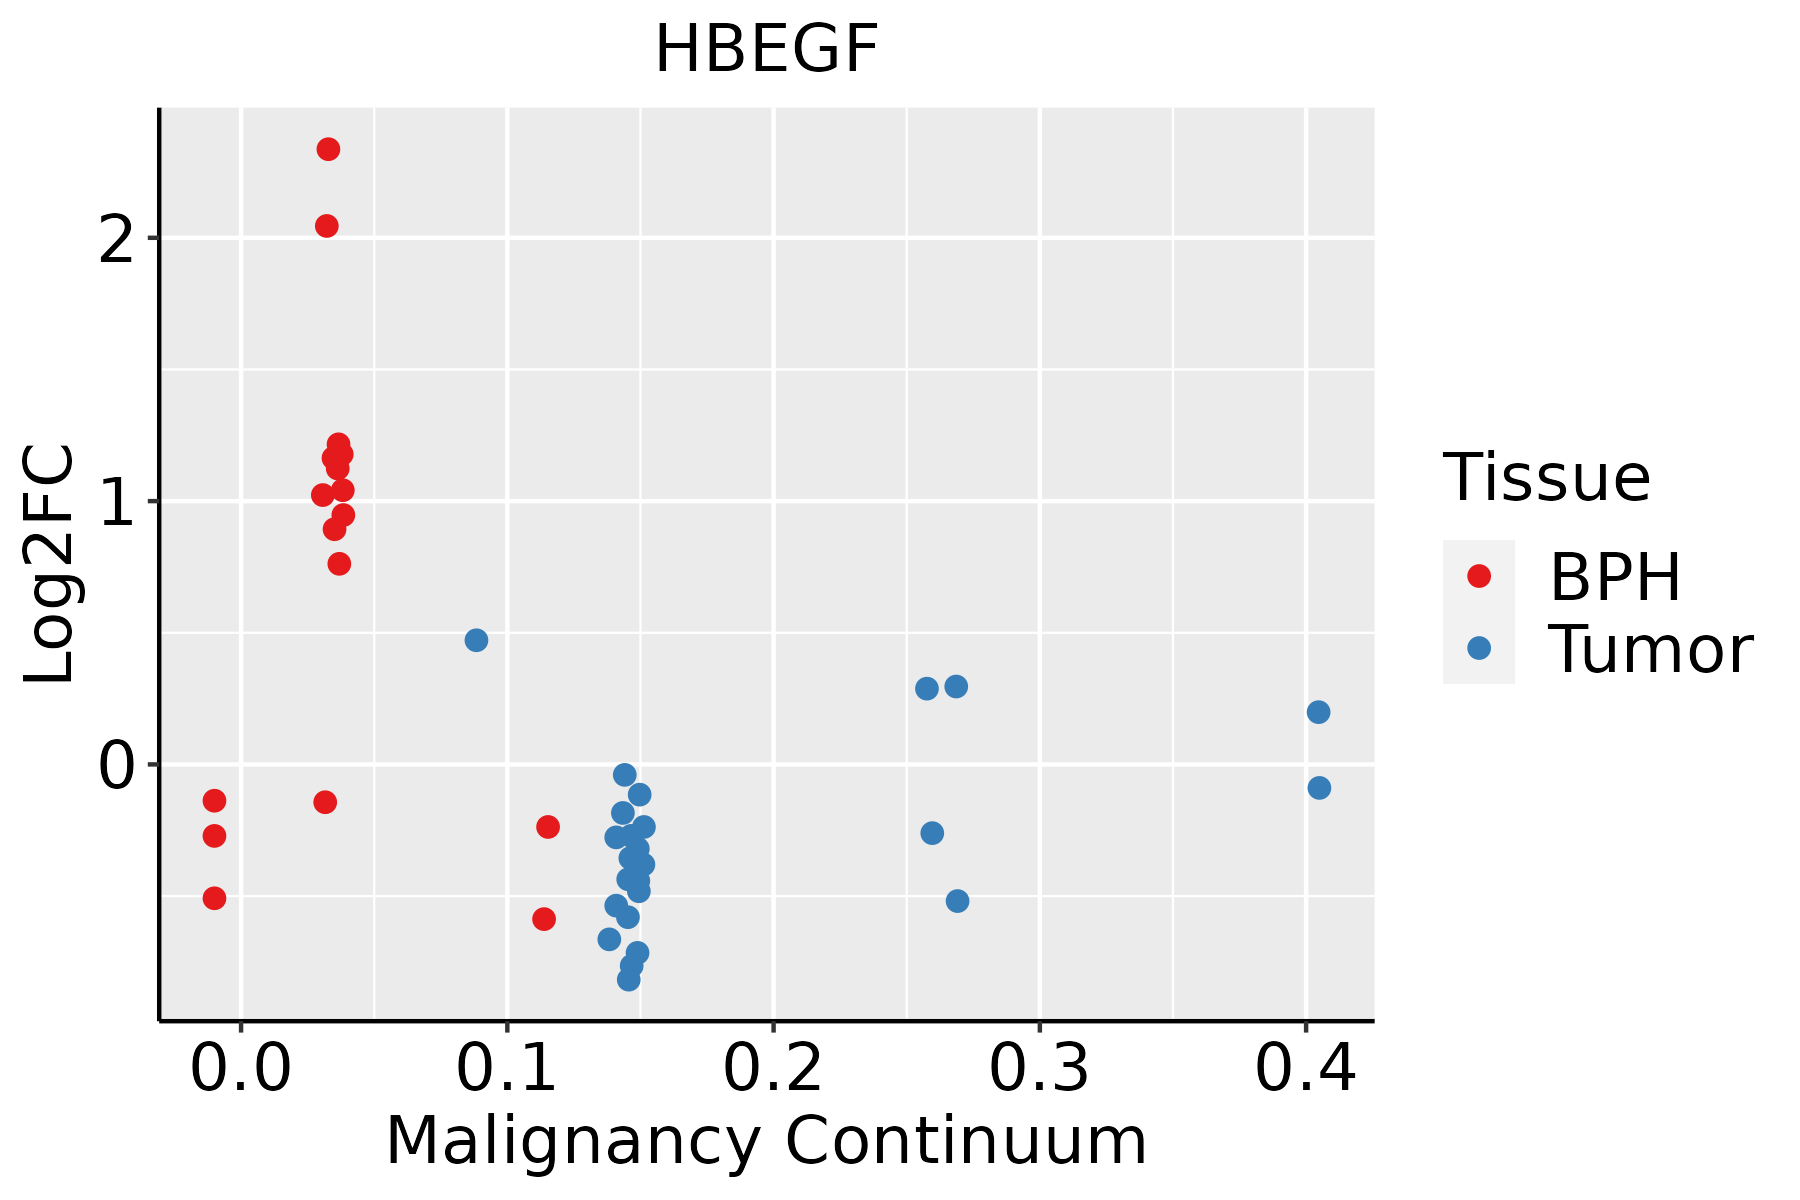 | BPH: Benign Prostatic Hyperplasia |
| Skin | 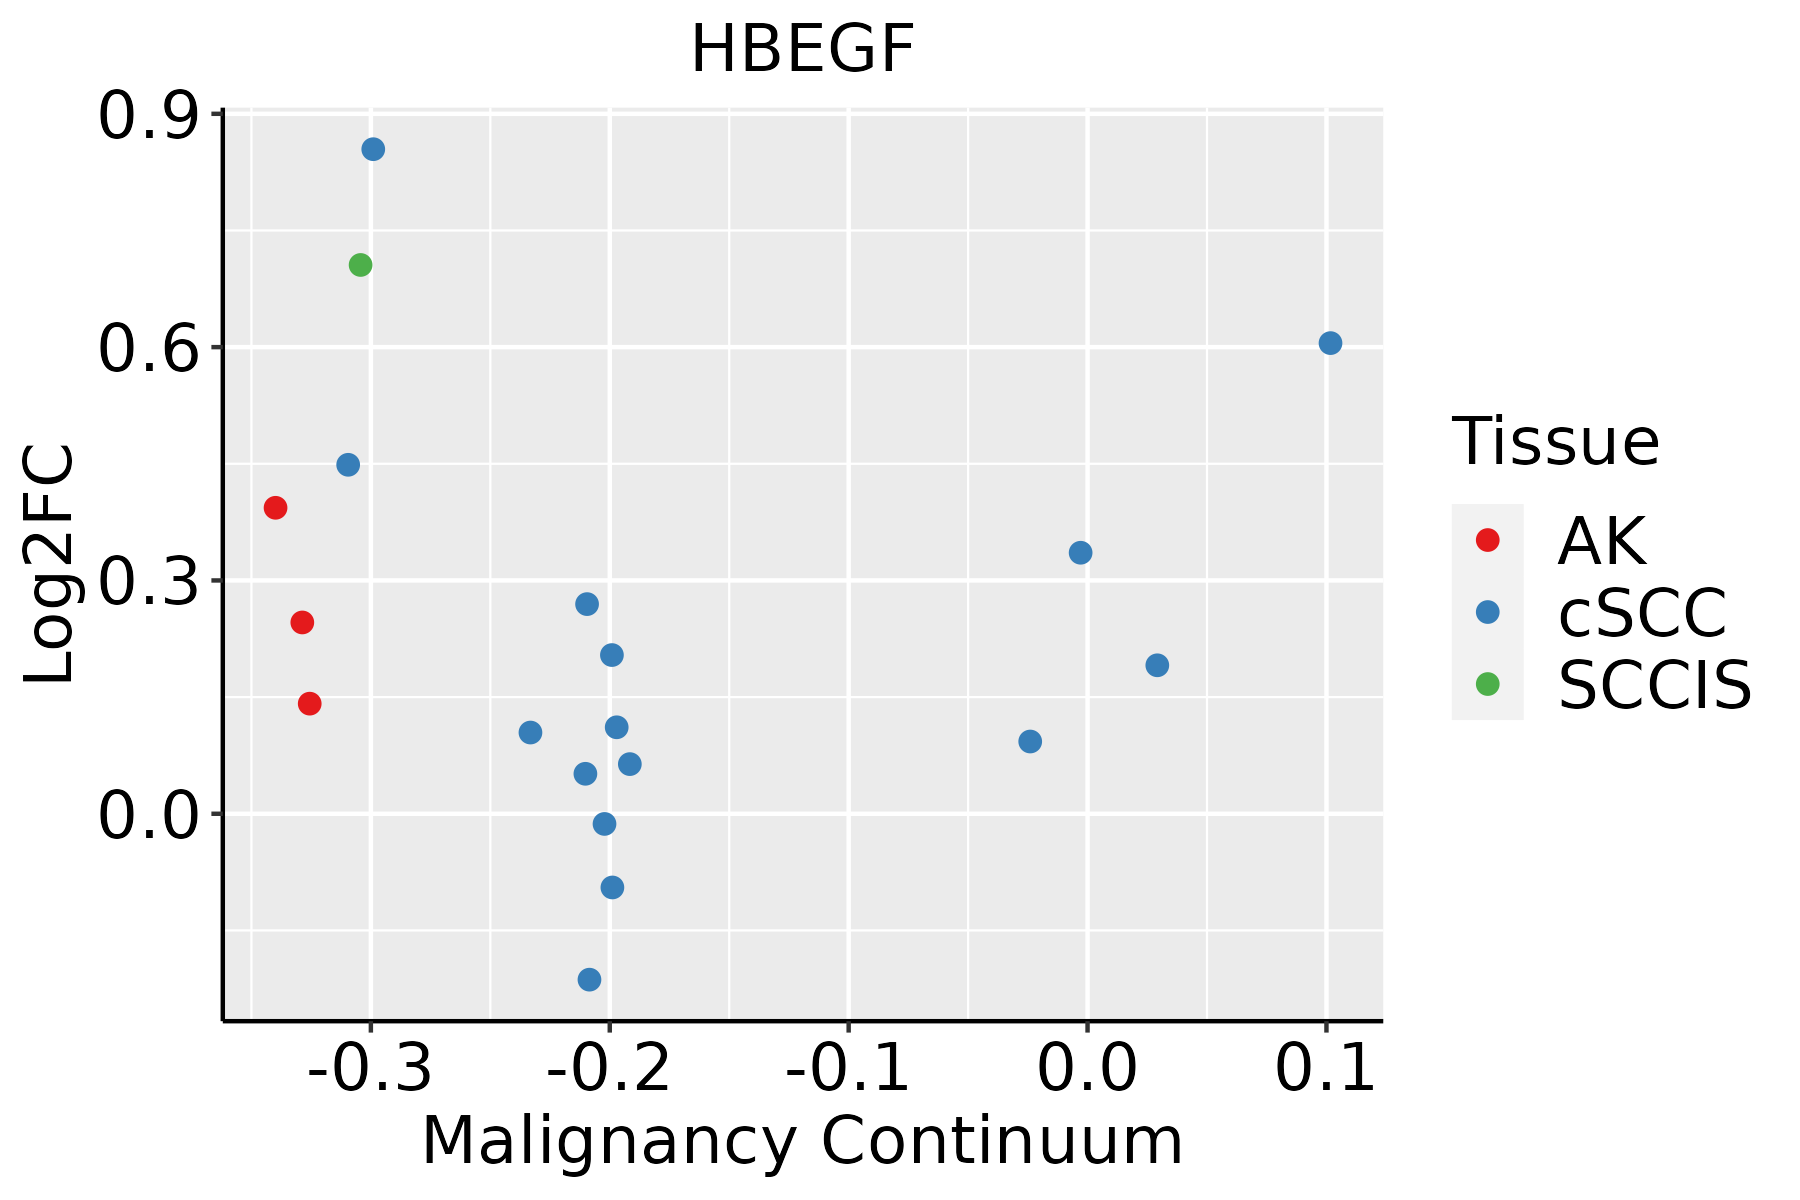 | AK: Actinic keratosis |
| cSCC: Cutaneous squamous cell carcinoma | ||
| SCCIS:squamous cell carcinoma in situ | ||
| Thyroid |  | ATC: Anaplastic thyroid cancer |
| HT: Hashimoto's thyroiditis | ||
| PTC: Papillary thyroid cancer |
| ∗log2FC in expression of this searched gene in stem-like cells from each diseased tissue sample relative to stem-like cells in normal samples in each tissue plotted against the malignancy continuum. Samples are colored based on if they are from different disease stage. |
Top |
Malignant transformation related pathway analysis |
| Find out the enriched GO biological processes and KEGG pathways involved in transition from healthy to precancer to cancer |
| Tissue | Disease Stage | Enriched GO biological Processes |
| Colorectum | AD |  |
| Colorectum | SER |  |
| Colorectum | MSS |  |
| Colorectum | MSI-H |  |
| Colorectum | FAP |  |
| ∗Top 15 enriched GO BP terms are showed in the bar plot of each disease state in each tissue. Each row represents a significant GO biological process which is colored according to the -log10(p.adjust). |
| Page: 1 2 3 4 5 6 7 8 9 |
| GO ID | Tissue | Disease Stage | Description | Gene Ratio | Bg Ratio | pvalue | p.adjust | Count |
| GO:004206010 | Cervix | CC | wound healing | 109/2311 | 422/18723 | 1.84e-14 | 1.57e-11 | 109 |
| GO:009013210 | Cervix | CC | epithelium migration | 90/2311 | 360/18723 | 2.45e-11 | 6.11e-09 | 90 |
| GO:00016679 | Cervix | CC | ameboidal-type cell migration | 110/2311 | 475/18723 | 2.66e-11 | 6.36e-09 | 110 |
| GO:001063110 | Cervix | CC | epithelial cell migration | 89/2311 | 357/18723 | 3.72e-11 | 8.54e-09 | 89 |
| GO:009013010 | Cervix | CC | tissue migration | 90/2311 | 365/18723 | 5.42e-11 | 1.05e-08 | 90 |
| GO:001063210 | Cervix | CC | regulation of epithelial cell migration | 72/2311 | 292/18723 | 4.52e-09 | 4.43e-07 | 72 |
| GO:003367410 | Cervix | CC | positive regulation of kinase activity | 101/2311 | 467/18723 | 8.66e-09 | 7.22e-07 | 101 |
| GO:00071738 | Cervix | CC | epidermal growth factor receptor signaling pathway | 36/2311 | 108/18723 | 1.04e-08 | 8.44e-07 | 36 |
| GO:00603267 | Cervix | CC | cell chemotaxis | 73/2311 | 310/18723 | 2.82e-08 | 1.96e-06 | 73 |
| GO:00458608 | Cervix | CC | positive regulation of protein kinase activity | 85/2311 | 386/18723 | 5.61e-08 | 3.29e-06 | 85 |
| GO:00381278 | Cervix | CC | ERBB signaling pathway | 37/2311 | 121/18723 | 8.57e-08 | 4.88e-06 | 37 |
| GO:00443193 | Cervix | CC | wound healing, spreading of cells | 17/2311 | 34/18723 | 9.86e-08 | 5.25e-06 | 17 |
| GO:00905053 | Cervix | CC | epiboly involved in wound healing | 17/2311 | 34/18723 | 9.86e-08 | 5.25e-06 | 17 |
| GO:00905043 | Cervix | CC | epiboly | 17/2311 | 35/18723 | 1.70e-07 | 7.93e-06 | 17 |
| GO:00106349 | Cervix | CC | positive regulation of epithelial cell migration | 47/2311 | 176/18723 | 1.73e-07 | 8.01e-06 | 47 |
| GO:19030349 | Cervix | CC | regulation of response to wounding | 44/2311 | 167/18723 | 6.33e-07 | 2.31e-05 | 44 |
| GO:00020111 | Cervix | CC | morphogenesis of an epithelial sheet | 21/2311 | 57/18723 | 1.91e-06 | 5.97e-05 | 21 |
| GO:00160498 | Cervix | CC | cell growth | 92/2311 | 482/18723 | 1.16e-05 | 2.49e-04 | 92 |
| GO:00610418 | Cervix | CC | regulation of wound healing | 34/2311 | 134/18723 | 2.70e-05 | 4.52e-04 | 34 |
| GO:19030368 | Cervix | CC | positive regulation of response to wounding | 21/2311 | 72/18723 | 1.10e-04 | 1.39e-03 | 21 |
| Page: 1 2 3 4 5 6 7 8 9 10 11 12 13 14 15 16 17 18 19 |
| Pathway ID | Tissue | Disease Stage | Description | Gene Ratio | Bg Ratio | pvalue | p.adjust | qvalue | Count |
| hsa0491520 | Cervix | CC | Estrogen signaling pathway | 44/1267 | 138/8465 | 3.55e-07 | 3.97e-06 | 2.35e-06 | 44 |
| hsa051207 | Cervix | CC | Epithelial cell signaling in Helicobacter pylori infection | 24/1267 | 70/8465 | 4.35e-05 | 3.09e-04 | 1.83e-04 | 24 |
| hsa04915110 | Cervix | CC | Estrogen signaling pathway | 44/1267 | 138/8465 | 3.55e-07 | 3.97e-06 | 2.35e-06 | 44 |
| hsa0512014 | Cervix | CC | Epithelial cell signaling in Helicobacter pylori infection | 24/1267 | 70/8465 | 4.35e-05 | 3.09e-04 | 1.83e-04 | 24 |
| hsa0517125 | Cervix | HSIL_HPV | Coronavirus disease - COVID-19 | 91/459 | 232/8465 | 2.14e-56 | 3.13e-54 | 2.53e-54 | 91 |
| hsa0491524 | Cervix | HSIL_HPV | Estrogen signaling pathway | 19/459 | 138/8465 | 1.54e-04 | 1.74e-03 | 1.40e-03 | 19 |
| hsa0517135 | Cervix | HSIL_HPV | Coronavirus disease - COVID-19 | 91/459 | 232/8465 | 2.14e-56 | 3.13e-54 | 2.53e-54 | 91 |
| hsa0491534 | Cervix | HSIL_HPV | Estrogen signaling pathway | 19/459 | 138/8465 | 1.54e-04 | 1.74e-03 | 1.40e-03 | 19 |
| hsa0517139 | Esophagus | HGIN | Coronavirus disease - COVID-19 | 105/1383 | 232/8465 | 7.84e-26 | 5.11e-24 | 4.06e-24 | 105 |
| hsa0520528 | Esophagus | HGIN | Proteoglycans in cancer | 47/1383 | 205/8465 | 8.23e-03 | 4.71e-02 | 3.74e-02 | 47 |
| hsa05171115 | Esophagus | HGIN | Coronavirus disease - COVID-19 | 105/1383 | 232/8465 | 7.84e-26 | 5.11e-24 | 4.06e-24 | 105 |
| hsa05205112 | Esophagus | HGIN | Proteoglycans in cancer | 47/1383 | 205/8465 | 8.23e-03 | 4.71e-02 | 3.74e-02 | 47 |
| hsa05171211 | Esophagus | ESCC | Coronavirus disease - COVID-19 | 156/4205 | 232/8465 | 3.18e-08 | 2.68e-07 | 1.37e-07 | 156 |
| hsa0520529 | Esophagus | ESCC | Proteoglycans in cancer | 138/4205 | 205/8465 | 1.79e-07 | 1.40e-06 | 7.15e-07 | 138 |
| hsa0521910 | Esophagus | ESCC | Bladder cancer | 35/4205 | 41/8465 | 1.91e-06 | 1.15e-05 | 5.87e-06 | 35 |
| hsa0512018 | Esophagus | ESCC | Epithelial cell signaling in Helicobacter pylori infection | 52/4205 | 70/8465 | 2.17e-05 | 1.07e-04 | 5.47e-05 | 52 |
| hsa0401218 | Esophagus | ESCC | ErbB signaling pathway | 56/4205 | 85/8465 | 1.78e-03 | 5.24e-03 | 2.68e-03 | 56 |
| hsa015227 | Esophagus | ESCC | Endocrine resistance | 63/4205 | 98/8465 | 2.38e-03 | 6.58e-03 | 3.37e-03 | 63 |
| hsa0492816 | Esophagus | ESCC | Parathyroid hormone synthesis, secretion and action | 66/4205 | 106/8465 | 5.86e-03 | 1.47e-02 | 7.51e-03 | 66 |
| hsa05171310 | Esophagus | ESCC | Coronavirus disease - COVID-19 | 156/4205 | 232/8465 | 3.18e-08 | 2.68e-07 | 1.37e-07 | 156 |
| Page: 1 2 3 4 |
Top |
Cell-cell communication analysis |
| Identification of potential cell-cell interactions between two cell types and their ligand-receptor pairs for different disease states |
| Ligand | Receptor | LRpair | Pathway | Tissue | Disease Stage |
| HBEGF | EGFR | HBEGF_EGFR | EGF | Breast | ADJ |
| HBEGF | EGFR | HBEGF_EGFR | EGF | Breast | DCIS |
| HBEGF | EGFR_ERBB2 | HBEGF_EGFR_ERBB2 | EGF | Breast | DCIS |
| HBEGF | EGFR | HBEGF_EGFR | EGF | Breast | Healthy |
| HBEGF | EGFR | HBEGF_EGFR | EGF | Breast | Precancer |
| HBEGF | EGFR | HBEGF_EGFR | EGF | Cervix | ADJ |
| HBEGF | EGFR | HBEGF_EGFR | EGF | Cervix | CC |
| HBEGF | EGFR_ERBB2 | HBEGF_EGFR_ERBB2 | EGF | Cervix | CC |
| HBEGF | ERBB4 | HBEGF_ERBB4 | EGF | Cervix | CC |
| HBEGF | ERBB2_ERBB4 | HBEGF_ERBB2_ERBB4 | EGF | Cervix | CC |
| HBEGF | EGFR | HBEGF_EGFR | EGF | Cervix | Healthy |
| HBEGF | EGFR | HBEGF_EGFR | EGF | Cervix | Precancer |
| HBEGF | EGFR | HBEGF_EGFR | EGF | CRC | MSS |
| HBEGF | EGFR_ERBB2 | HBEGF_EGFR_ERBB2 | EGF | CRC | MSS |
| HBEGF | EGFR | HBEGF_EGFR | EGF | Endometrium | ADJ |
| HBEGF | ERBB4 | HBEGF_ERBB4 | EGF | Endometrium | ADJ |
| HBEGF | EGFR | HBEGF_EGFR | EGF | Endometrium | AEH |
| HBEGF | ERBB4 | HBEGF_ERBB4 | EGF | Endometrium | AEH |
| HBEGF | EGFR | HBEGF_EGFR | EGF | Endometrium | EEC |
| HBEGF | ERBB4 | HBEGF_ERBB4 | EGF | Endometrium | EEC |
| Page: 1 2 3 4 |
Top |
Single-cell gene regulatory network inference analysis |
| Find out the significant the regulons (TFs) and the target genes of each regulon across cell types for different disease states |
| TF | Cell Type | Tissue | Disease Stage | Target Gene | RSS | Regulon Activity |
| ∗The dot plots of a searched regulon are shown for all cell subpopulations in each disease state of each tissue based on the regulon specific score inferred using pySCENIC and by calculating the average expression. |
| Page: 1 |
Top |
Somatic mutation of malignant transformation related genes |
| Annotation of somatic variants for genes involved in malignant transformation |
| Hugo Symbol | Variant Class | Variant Classification | dbSNP RS | HGVSc | HGVSp | HGVSp Short | SWISSPROT | BIOTYPE | SIFT | PolyPhen | Tumor Sample Barcode | Tissue | Histology | Sex | Age | Stage | Therapy Types | Drugs | Outcome |
| HBEGF | SNV | Missense_Mutation | novel | c.70N>A | p.Glu24Lys | p.E24K | Q99075 | protein_coding | tolerated(0.08) | benign(0.054) | TCGA-E9-A1R4-01 | Breast | breast invasive carcinoma | Female | >=65 | I/II | Chemotherapy | 5-fluorouracil | SD |
| HBEGF | SNV | Missense_Mutation | c.466N>G | p.Thr156Ala | p.T156A | Q99075 | protein_coding | tolerated(0.52) | benign(0.001) | TCGA-AA-A010-01 | Colorectum | colon adenocarcinoma | Female | <65 | I/II | Chemotherapy | folinic | CR | |
| HBEGF | SNV | Missense_Mutation | novel | c.458G>A | p.Arg153His | p.R153H | Q99075 | protein_coding | tolerated(0.16) | benign(0.003) | TCGA-AZ-6598-01 | Colorectum | colon adenocarcinoma | Female | >=65 | I/II | Unknown | Unknown | SD |
| HBEGF | SNV | Missense_Mutation | c.473N>G | p.Asp158Gly | p.D158G | Q99075 | protein_coding | deleterious(0.01) | possibly_damaging(0.696) | TCGA-CM-6171-01 | Colorectum | colon adenocarcinoma | Female | >=65 | I/II | Unknown | Unknown | SD | |
| HBEGF | SNV | Missense_Mutation | novel | c.298N>T | p.Gly100Trp | p.G100W | Q99075 | protein_coding | deleterious(0) | probably_damaging(0.993) | TCGA-A5-A0G1-01 | Endometrium | uterine corpus endometrioid carcinoma | Female | >=65 | I/II | Unknown | Unknown | SD |
| HBEGF | SNV | Missense_Mutation | novel | c.298N>T | p.Gly100Trp | p.G100W | Q99075 | protein_coding | deleterious(0) | probably_damaging(0.993) | TCGA-A5-A0GG-01 | Endometrium | uterine corpus endometrioid carcinoma | Female | >=65 | I/II | Unknown | Unknown | SD |
| HBEGF | SNV | Missense_Mutation | novel | c.5N>C | p.Lys2Thr | p.K2T | Q99075 | protein_coding | deleterious_low_confidence(0) | probably_damaging(0.981) | TCGA-AJ-A5DW-01 | Endometrium | uterine corpus endometrioid carcinoma | Female | <65 | I/II | Unknown | Unknown | SD |
| HBEGF | SNV | Missense_Mutation | c.160N>A | p.Gly54Arg | p.G54R | Q99075 | protein_coding | tolerated(0.37) | benign(0.134) | TCGA-AP-A059-01 | Endometrium | uterine corpus endometrioid carcinoma | Female | >=65 | I/II | Unknown | Unknown | SD | |
| HBEGF | SNV | Missense_Mutation | novel | c.41N>T | p.Ala14Val | p.A14V | Q99075 | protein_coding | tolerated(0.13) | benign(0.432) | TCGA-AP-A1DK-01 | Endometrium | uterine corpus endometrioid carcinoma | Female | <65 | I/II | Unknown | Unknown | SD |
| HBEGF | SNV | Missense_Mutation | c.382N>T | p.Arg128Trp | p.R128W | Q99075 | protein_coding | deleterious(0) | probably_damaging(0.983) | TCGA-D1-A15X-01 | Endometrium | uterine corpus endometrioid carcinoma | Female | <65 | I/II | Unknown | Unknown | SD |
| Page: 1 2 |
Top |
Related drugs of malignant transformation related genes |
| Identification of chemicals and drugs interact with genes involved in malignant transfromation |
| (DGIdb 4.0) |
| Entrez ID | Symbol | Category | Interaction Types | Drug Claim Name | Drug Name | PMIDs |
| 1839 | HBEGF | CELL SURFACE, GROWTH FACTOR, DRUGGABLE GENOME | cetuximab | CETUXIMAB | ||
| 1839 | HBEGF | CELL SURFACE, GROWTH FACTOR, DRUGGABLE GENOME | ANTISERUM | 7538797 | ||
| 1839 | HBEGF | CELL SURFACE, GROWTH FACTOR, DRUGGABLE GENOME | U3-1565 | |||
| 1839 | HBEGF | CELL SURFACE, GROWTH FACTOR, DRUGGABLE GENOME | panitumumab | PANITUMUMAB | ||
| 1839 | HBEGF | CELL SURFACE, GROWTH FACTOR, DRUGGABLE GENOME | KHK-2866 | KHK-2866 |
| Page: 1 |

Copyright 2023-Present -The University of Texas Health Science Center at Houston |