
|
|||||
|
 | |
| |
| |
| |
| |
| |
|
Gene: HBB |
Gene summary for HBB |
| Gene information | Species | Human | Gene symbol | HBB | Gene ID | 3043 |
| Gene name | hemoglobin subunit beta | |
| Gene Alias | CD113t-C | |
| Cytomap | 11p15.4 | |
| Gene Type | protein-coding | GO ID | GO:0000302 | UniProtAcc | D9YZU5 |
Top |
Malignant transformation analysis |
| Identification of the aberrant gene expression in precancerous and cancerous lesions by comparing the gene expression of stem-like cells in diseased tissues with normal stem cells |
| Entrez ID | Symbol | Replicates | Species | Organ | Tissue | Adj P-value | Log2FC | Malignancy |
| 3043 | HBB | HTA11_2487_2000001011 | Human | Colorectum | SER | 8.42e-05 | 2.66e-01 | -0.1808 |
| 3043 | HBB | HTA11_3361_2000001011 | Human | Colorectum | AD | 1.93e-12 | 2.45e+00 | -0.1207 |
| 3043 | HBB | HTA11_1391_2000001011 | Human | Colorectum | AD | 5.12e-18 | 2.08e+00 | -0.059 |
| 3043 | HBB | HTA11_99999965062_69753 | Human | Colorectum | MSI-H | 7.89e-03 | 3.22e-01 | 0.3487 |
| 3043 | HBB | AEH-subject1 | Human | Endometrium | AEH | 3.26e-10 | -7.89e-01 | -0.3059 |
| 3043 | HBB | AEH-subject2 | Human | Endometrium | AEH | 4.11e-10 | -7.93e-01 | -0.2525 |
| 3043 | HBB | AEH-subject3 | Human | Endometrium | AEH | 1.58e-12 | -7.93e-01 | -0.2576 |
| 3043 | HBB | AEH-subject4 | Human | Endometrium | AEH | 2.63e-07 | -7.93e-01 | -0.2657 |
| 3043 | HBB | AEH-subject5 | Human | Endometrium | AEH | 2.02e-10 | -7.80e-01 | -0.2953 |
| 3043 | HBB | EEC-subject1 | Human | Endometrium | EEC | 1.93e-12 | -7.88e-01 | -0.2682 |
| 3043 | HBB | EEC-subject2 | Human | Endometrium | EEC | 1.58e-12 | -7.93e-01 | -0.2607 |
| 3043 | HBB | EEC-subject4 | Human | Endometrium | EEC | 1.21e-08 | -7.59e-01 | -0.2571 |
| 3043 | HBB | EEC-subject5 | Human | Endometrium | EEC | 1.58e-12 | -7.93e-01 | -0.249 |
| 3043 | HBB | GSM5276934 | Human | Endometrium | EEC | 3.48e-12 | -7.93e-01 | -0.0913 |
| 3043 | HBB | GSM5276935 | Human | Endometrium | EEC | 8.84e-11 | -7.90e-01 | -0.123 |
| 3043 | HBB | GSM5276937 | Human | Endometrium | EEC | 1.44e-07 | -7.81e-01 | -0.0897 |
| 3043 | HBB | GSM6177620_NYU_UCEC1_lib1_lib1 | Human | Endometrium | EEC | 7.44e-08 | -7.93e-01 | -0.1869 |
| 3043 | HBB | GSM6177620_NYU_UCEC1_lib2_lib2 | Human | Endometrium | EEC | 9.59e-07 | -7.93e-01 | -0.1875 |
| 3043 | HBB | GSM6177620_NYU_UCEC1_lib3_lib3 | Human | Endometrium | EEC | 3.27e-08 | -7.93e-01 | -0.1883 |
| 3043 | HBB | GSM6177621_NYU_UCEC2_lib1_lib1 | Human | Endometrium | EEC | 9.29e-10 | -7.85e-01 | -0.1934 |
| Page: 1 2 3 4 |
| Tissue | Expression Dynamics | Abbreviation |
| Colorectum (GSE201348) |  | FAP: Familial adenomatous polyposis |
| CRC: Colorectal cancer | ||
| Colorectum (HTA11) |  | AD: Adenomas |
| SER: Sessile serrated lesions | ||
| MSI-H: Microsatellite-high colorectal cancer | ||
| MSS: Microsatellite stable colorectal cancer | ||
| Endometrium | 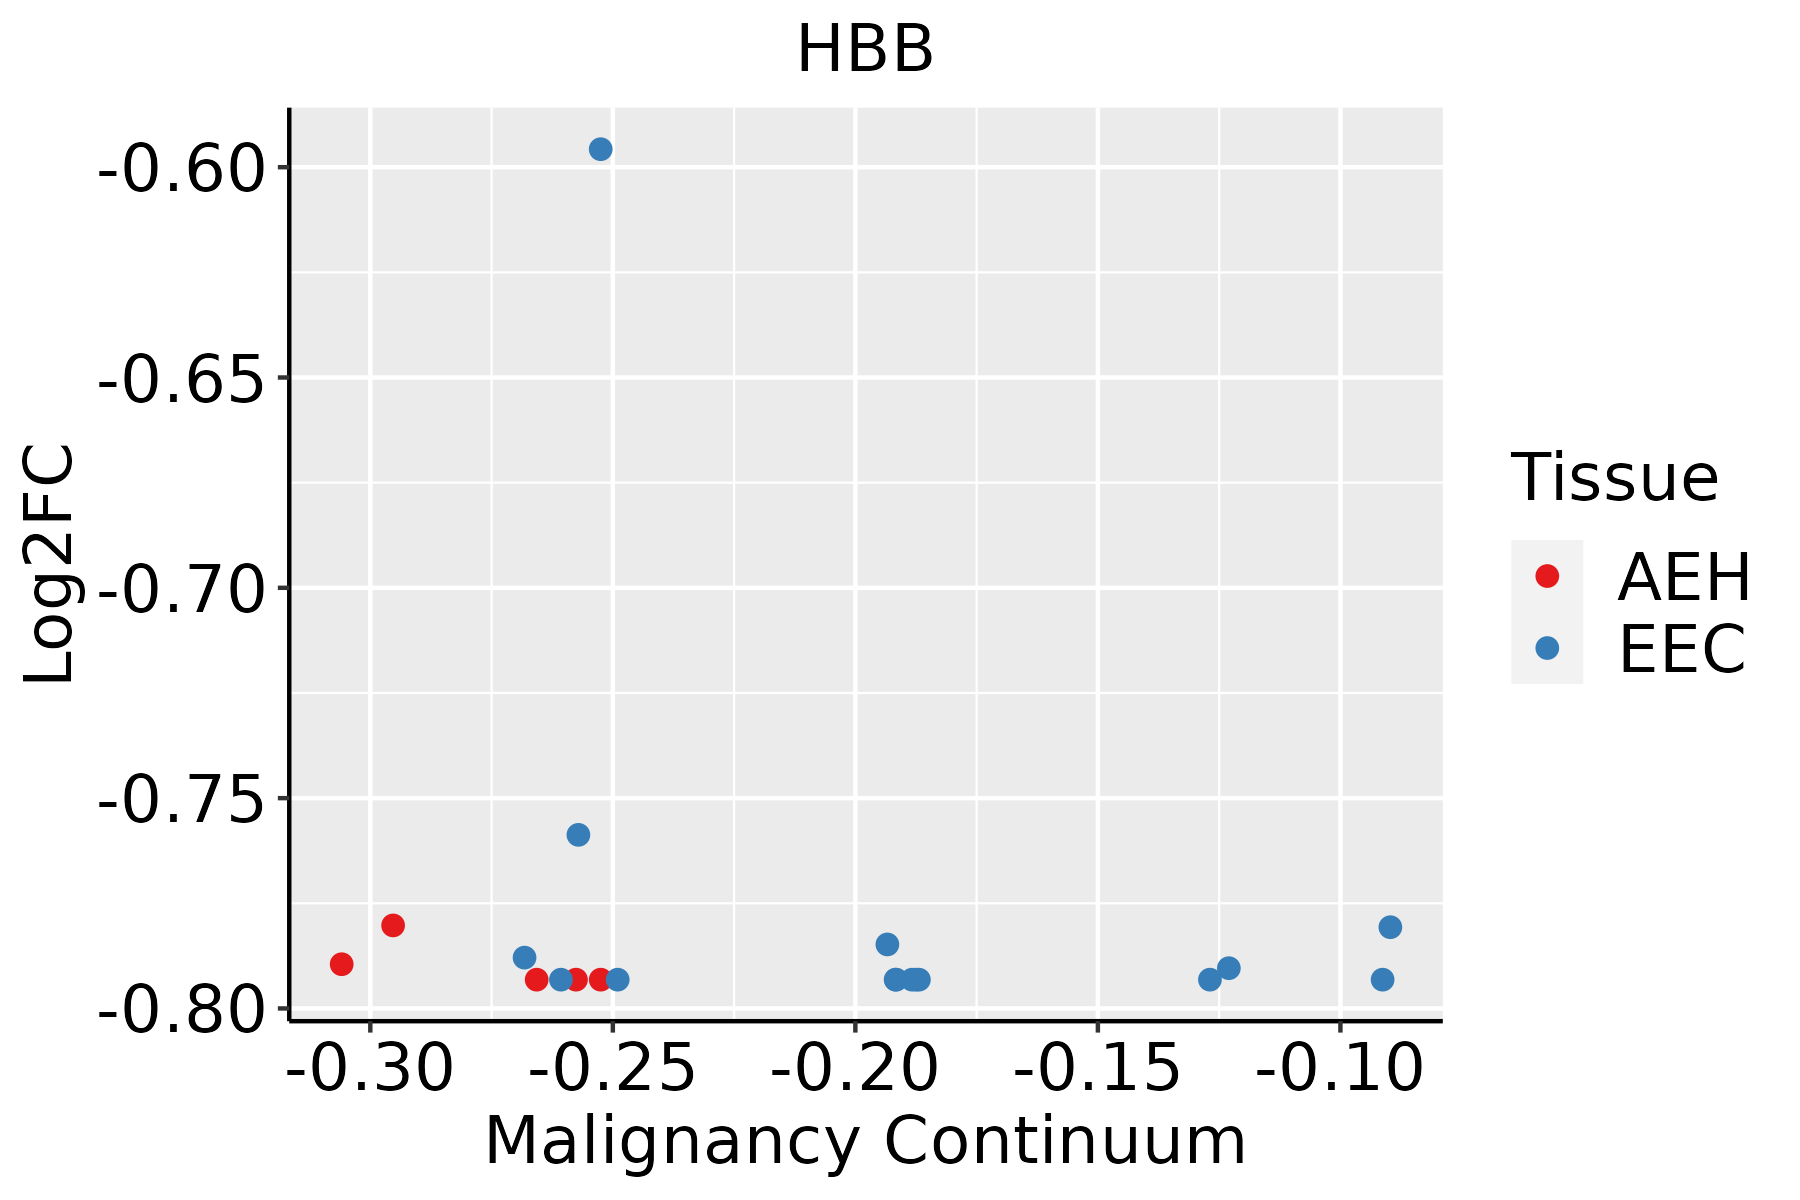 | AEH: Atypical endometrial hyperplasia |
| EEC: Endometrioid Cancer | ||
| GC | 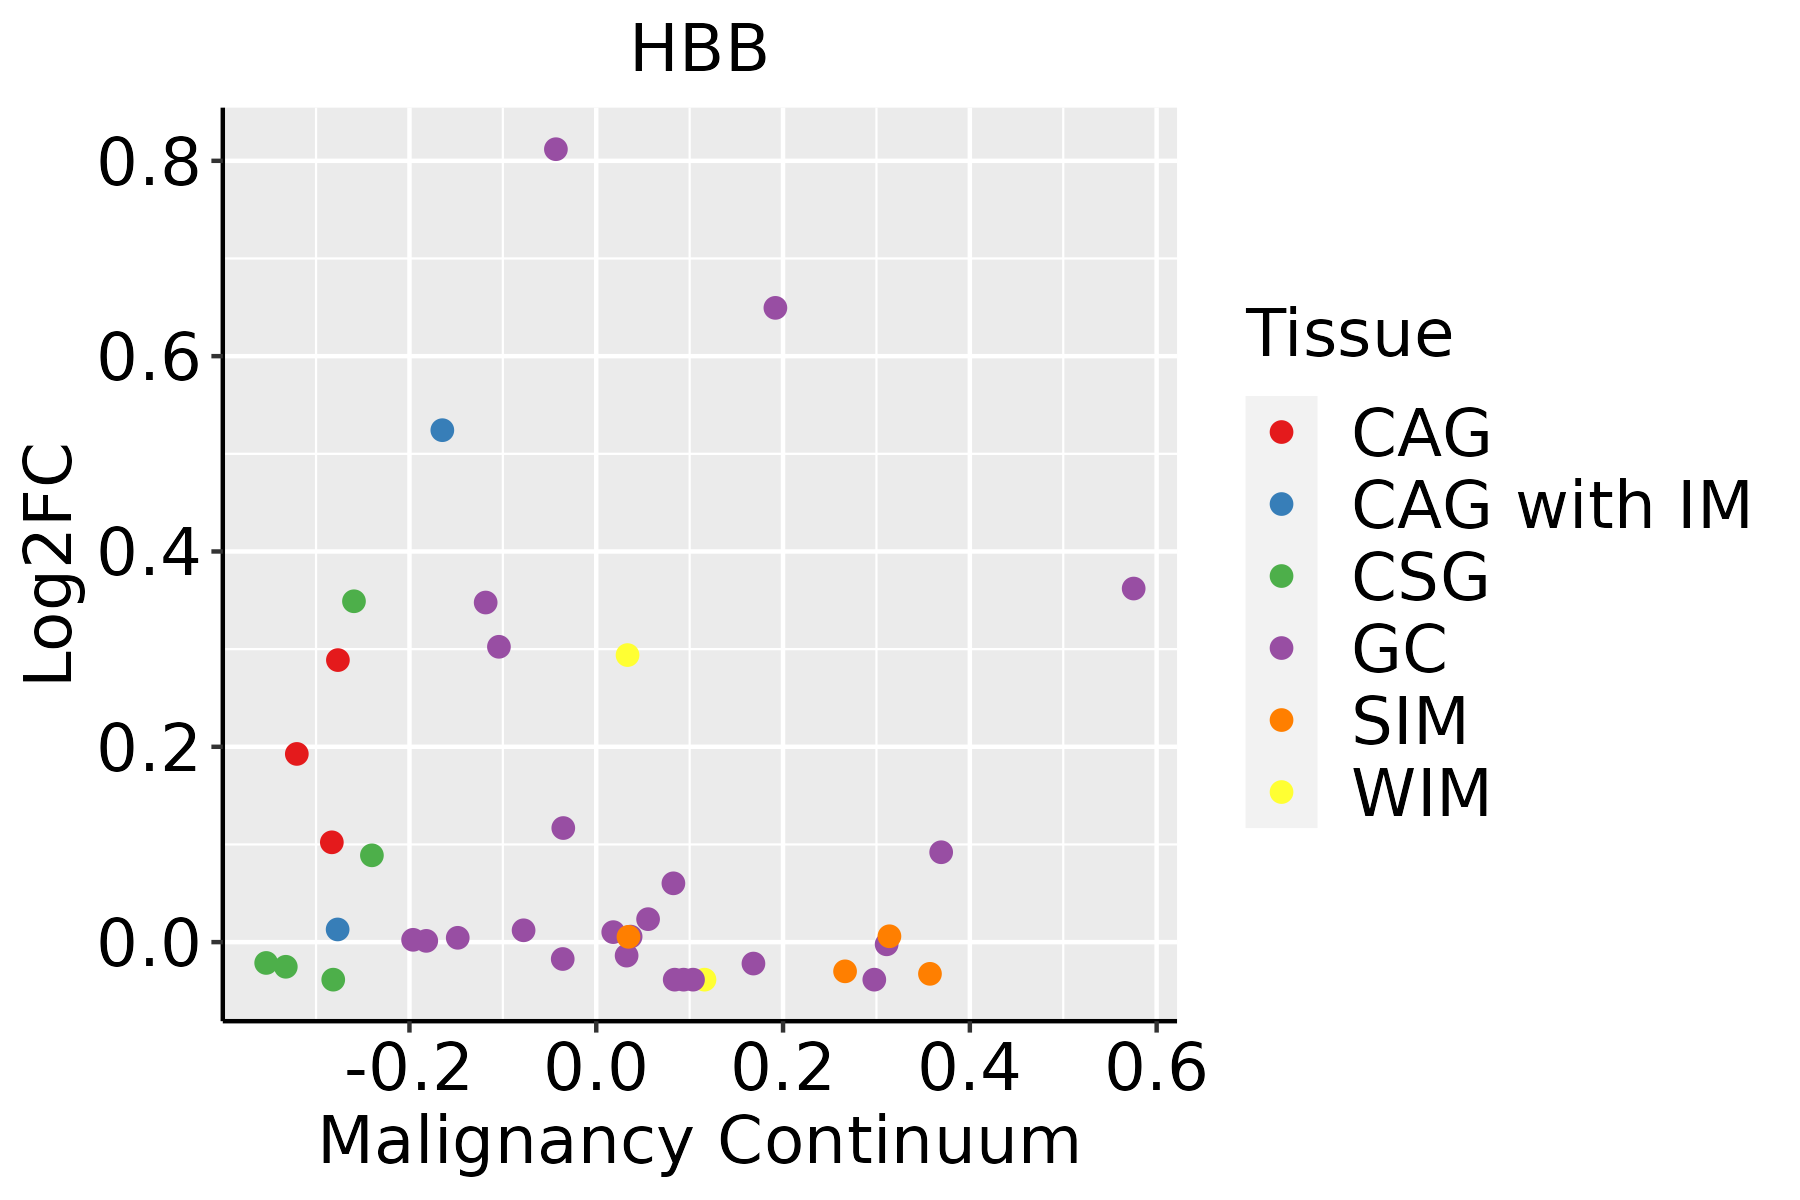 | CAG: Chronic atrophic gastritis |
| CAG with IM: Chronic atrophic gastritis with intestinal metaplasia | ||
| CSG: Chronic superficial gastritis | ||
| GC: Gastric cancer | ||
| SIM: Severe intestinal metaplasia | ||
| WIM: Wild intestinal metaplasia | ||
| Oral Cavity | 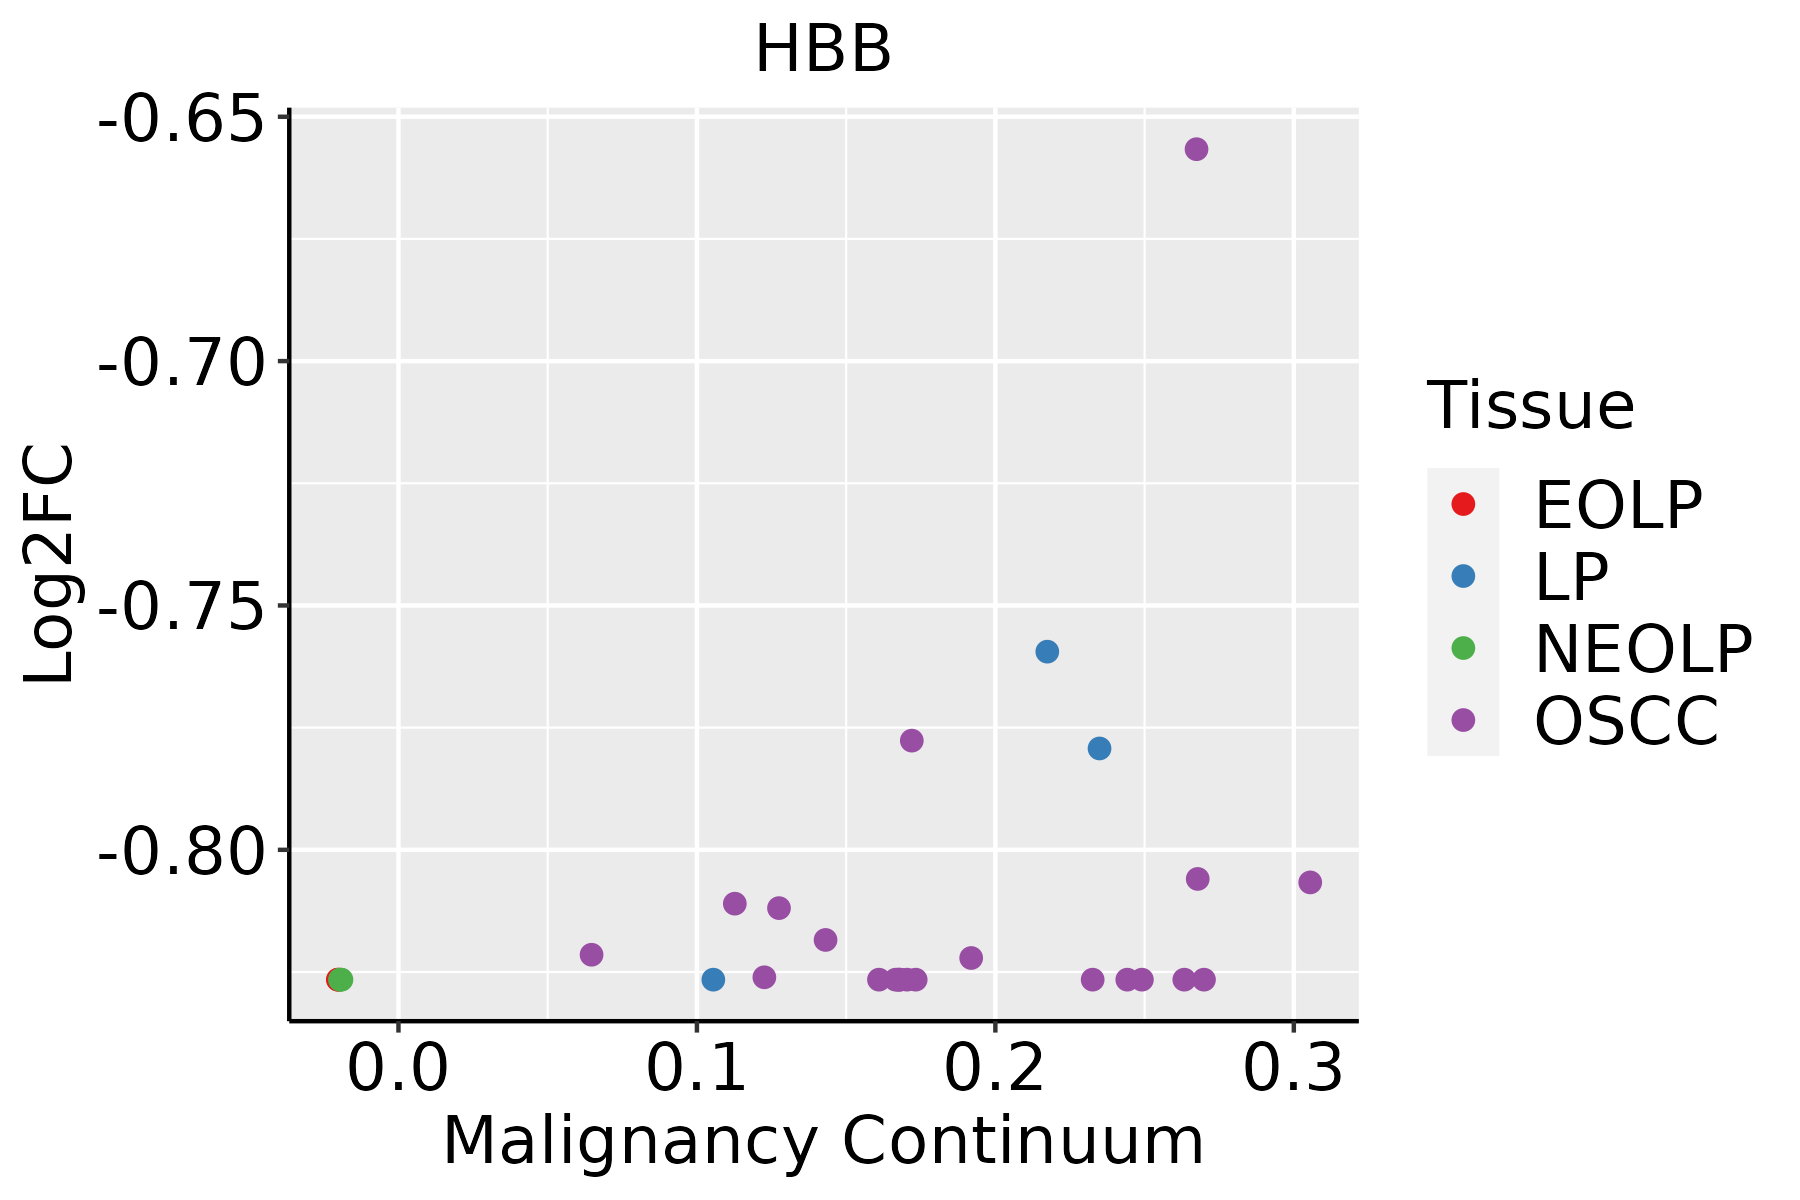 | EOLP: Erosive Oral lichen planus |
| LP: leukoplakia | ||
| NEOLP: Non-erosive oral lichen planus | ||
| OSCC: Oral squamous cell carcinoma | ||
| Thyroid |  | ATC: Anaplastic thyroid cancer |
| HT: Hashimoto's thyroiditis | ||
| PTC: Papillary thyroid cancer |
| ∗log2FC in expression of this searched gene in stem-like cells from each diseased tissue sample relative to stem-like cells in normal samples in each tissue plotted against the malignancy continuum. Samples are colored based on if they are from different disease stage. |
Top |
Malignant transformation related pathway analysis |
| Find out the enriched GO biological processes and KEGG pathways involved in transition from healthy to precancer to cancer |
| Tissue | Disease Stage | Enriched GO biological Processes |
| Colorectum | AD |  |
| Colorectum | SER |  |
| Colorectum | MSS |  |
| Colorectum | MSI-H |  |
| Colorectum | FAP |  |
| ∗Top 15 enriched GO BP terms are showed in the bar plot of each disease state in each tissue. Each row represents a significant GO biological process which is colored according to the -log10(p.adjust). |
| Page: 1 2 3 4 5 6 7 8 9 |
| GO ID | Tissue | Disease Stage | Description | Gene Ratio | Bg Ratio | pvalue | p.adjust | Count |
| GO:0006979 | Colorectum | AD | response to oxidative stress | 145/3918 | 446/18723 | 5.16e-09 | 3.23e-07 | 145 |
| GO:0034109 | Colorectum | AD | homotypic cell-cell adhesion | 40/3918 | 90/18723 | 4.37e-07 | 1.67e-05 | 40 |
| GO:0000302 | Colorectum | AD | response to reactive oxygen species | 78/3918 | 222/18723 | 6.17e-07 | 2.21e-05 | 78 |
| GO:0009636 | Colorectum | AD | response to toxic substance | 88/3918 | 262/18723 | 1.12e-06 | 3.72e-05 | 88 |
| GO:0042060 | Colorectum | AD | wound healing | 128/3918 | 422/18723 | 2.73e-06 | 7.89e-05 | 128 |
| GO:0042542 | Colorectum | AD | response to hydrogen peroxide | 52/3918 | 146/18723 | 2.83e-05 | 5.30e-04 | 52 |
| GO:0098754 | Colorectum | AD | detoxification | 53/3918 | 152/18723 | 4.63e-05 | 7.98e-04 | 53 |
| GO:0097237 | Colorectum | AD | cellular response to toxic substance | 44/3918 | 124/18723 | 1.24e-04 | 1.80e-03 | 44 |
| GO:0006809 | Colorectum | AD | nitric oxide biosynthetic process | 30/3918 | 76/18723 | 1.72e-04 | 2.33e-03 | 30 |
| GO:1990748 | Colorectum | AD | cellular detoxification | 41/3918 | 116/18723 | 2.29e-04 | 2.97e-03 | 41 |
| GO:0050878 | Colorectum | AD | regulation of body fluid levels | 108/3918 | 379/18723 | 2.54e-04 | 3.20e-03 | 108 |
| GO:0046209 | Colorectum | AD | nitric oxide metabolic process | 31/3918 | 81/18723 | 2.61e-04 | 3.25e-03 | 31 |
| GO:0072593 | Colorectum | AD | reactive oxygen species metabolic process | 73/3918 | 239/18723 | 2.79e-04 | 3.42e-03 | 73 |
| GO:2001057 | Colorectum | AD | reactive nitrogen species metabolic process | 31/3918 | 82/18723 | 3.37e-04 | 3.94e-03 | 31 |
| GO:0070527 | Colorectum | AD | platelet aggregation | 26/3918 | 67/18723 | 6.20e-04 | 6.48e-03 | 26 |
| GO:0045429 | Colorectum | AD | positive regulation of nitric oxide biosynthetic process | 17/3918 | 40/18723 | 1.66e-03 | 1.38e-02 | 17 |
| GO:1904407 | Colorectum | AD | positive regulation of nitric oxide metabolic process | 17/3918 | 41/18723 | 2.29e-03 | 1.79e-02 | 17 |
| GO:0098869 | Colorectum | AD | cellular oxidant detoxification | 33/3918 | 101/18723 | 3.88e-03 | 2.72e-02 | 33 |
| GO:0080164 | Colorectum | AD | regulation of nitric oxide metabolic process | 23/3918 | 64/18723 | 3.99e-03 | 2.80e-02 | 23 |
| GO:0003014 | Colorectum | AD | renal system process | 35/3918 | 110/18723 | 4.85e-03 | 3.27e-02 | 35 |
| Page: 1 2 3 4 5 6 7 8 9 10 11 12 13 14 15 16 17 18 19 20 21 22 |
| Pathway ID | Tissue | Disease Stage | Description | Gene Ratio | Bg Ratio | pvalue | p.adjust | qvalue | Count |
| Page: 1 |
Top |
Cell-cell communication analysis |
| Identification of potential cell-cell interactions between two cell types and their ligand-receptor pairs for different disease states |
| Ligand | Receptor | LRpair | Pathway | Tissue | Disease Stage |
| Page: 1 |
Top |
Single-cell gene regulatory network inference analysis |
| Find out the significant the regulons (TFs) and the target genes of each regulon across cell types for different disease states |
| TF | Cell Type | Tissue | Disease Stage | Target Gene | RSS | Regulon Activity |
| ∗The dot plots of a searched regulon are shown for all cell subpopulations in each disease state of each tissue based on the regulon specific score inferred using pySCENIC and by calculating the average expression. |
| Page: 1 |
Top |
Somatic mutation of malignant transformation related genes |
| Annotation of somatic variants for genes involved in malignant transformation |
| Hugo Symbol | Variant Class | Variant Classification | dbSNP RS | HGVSc | HGVSp | HGVSp Short | SWISSPROT | BIOTYPE | SIFT | PolyPhen | Tumor Sample Barcode | Tissue | Histology | Sex | Age | Stage | Therapy Types | Drugs | Outcome |
| HBB | SNV | Missense_Mutation | rs766266418 | c.40N>T | p.Ala14Ser | p.A14S | P68871 | protein_coding | tolerated(1) | benign(0.005) | TCGA-BH-A1EX-01 | Breast | breast invasive carcinoma | Female | >=65 | I/II | Unknown | Unknown | PD |
| HBB | SNV | Missense_Mutation | c.126N>A | p.Phe42Leu | p.F42L | P68871 | protein_coding | deleterious(0.04) | benign(0.303) | TCGA-AA-A010-01 | Colorectum | colon adenocarcinoma | Female | <65 | I/II | Chemotherapy | folinic | CR | |
| HBB | SNV | Missense_Mutation | c.126N>A | p.Phe42Leu | p.F42L | P68871 | protein_coding | deleterious(0.04) | benign(0.303) | TCGA-AG-3892-01 | Colorectum | rectum adenocarcinoma | Female | <65 | I/II | Unknown | Unknown | SD | |
| HBB | SNV | Missense_Mutation | rs33959855 | c.67N>A | p.Glu23Lys | p.E23K | P68871 | protein_coding | tolerated(0.14) | benign(0.092) | TCGA-A5-A0G2-01 | Endometrium | uterine corpus endometrioid carcinoma | Female | <65 | III/IV | Unknown | Unknown | SD |
| HBB | SNV | Missense_Mutation | novel | c.311T>C | p.Phe104Ser | p.F104S | P68871 | protein_coding | deleterious(0) | probably_damaging(1) | TCGA-AJ-A3EL-01 | Endometrium | uterine corpus endometrioid carcinoma | Female | <65 | I/II | Unknown | Unknown | SD |
| HBB | SNV | Missense_Mutation | rs33947457 | c.32C>T | p.Ala11Val | p.A11V | P68871 | protein_coding | tolerated(0.21) | benign(0.25) | TCGA-AJ-A3EL-01 | Endometrium | uterine corpus endometrioid carcinoma | Female | <65 | I/II | Unknown | Unknown | SD |
| HBB | SNV | Missense_Mutation | c.211N>A | p.Ala71Thr | p.A71T | P68871 | protein_coding | deleterious(0.01) | benign(0.226) | TCGA-AP-A1DK-01 | Endometrium | uterine corpus endometrioid carcinoma | Female | <65 | I/II | Unknown | Unknown | SD | |
| HBB | SNV | Missense_Mutation | rs33990858 | c.238N>T | p.Asp80Tyr | p.D80Y | P68871 | protein_coding | deleterious(0) | probably_damaging(0.998) | TCGA-AX-A2HD-01 | Endometrium | uterine corpus endometrioid carcinoma | Female | >=65 | III/IV | Unknown | Unknown | SD |
| HBB | SNV | Missense_Mutation | rs34703513 | c.116N>T | p.Thr39Ile | p.T39I | P68871 | protein_coding | deleterious(0) | probably_damaging(1) | TCGA-B5-A3FA-01 | Endometrium | uterine corpus endometrioid carcinoma | Female | >=65 | I/II | Unknown | Unknown | SD |
| HBB | SNV | Missense_Mutation | rs1141387 | c.103G>C | p.Val35Leu | p.V35L | P68871 | protein_coding | deleterious(0) | probably_damaging(0.973) | TCGA-BS-A0V8-01 | Endometrium | uterine corpus endometrioid carcinoma | Female | >=65 | I/II | Unknown | Unknown | SD |
| Page: 1 2 3 |
Top |
Related drugs of malignant transformation related genes |
| Identification of chemicals and drugs interact with genes involved in malignant transfromation |
| (DGIdb 4.0) |
| Entrez ID | Symbol | Category | Interaction Types | Drug Claim Name | Drug Name | PMIDs |
| 3043 | HBB | DRUGGABLE GENOME, ENZYME | AZACITIDINE | AZACITIDINE | ||
| 3043 | HBB | DRUGGABLE GENOME, ENZYME | voxelotor | VOXELOTOR | ||
| 3043 | HBB | DRUGGABLE GENOME, ENZYME | OXY-111A | |||
| 3043 | HBB | DRUGGABLE GENOME, ENZYME | negative modulator | CHEMBL18901 | EFAPROXIRAL | |
| 3043 | HBB | DRUGGABLE GENOME, ENZYME | Luspaterceptâaamt | |||
| 3043 | HBB | DRUGGABLE GENOME, ENZYME | AZATHIOPRINE | AZATHIOPRINE | ||
| 3043 | HBB | DRUGGABLE GENOME, ENZYME | MERCAPTOPURINE | MERCAPTOPURINE | ||
| 3043 | HBB | DRUGGABLE GENOME, ENZYME | NSC-348401 | CHEMBL515505 | ||
| 3043 | HBB | DRUGGABLE GENOME, ENZYME | FLUOROURACIL | FLUOROURACIL | ||
| 3043 | HBB | DRUGGABLE GENOME, ENZYME | 5-FLUOROURIDINE | CHEMBL54918 |
| Page: 1 2 3 4 5 |

Copyright 2023-Present -The University of Texas Health Science Center at Houston |