
|
|||||
|
 | |
| |
| |
| |
| |
| |
|
Gene: HAUS2 |
Gene summary for HAUS2 |
| Gene information | Species | Human | Gene symbol | HAUS2 | Gene ID | 55142 |
| Gene name | HAUS augmin like complex subunit 2 | |
| Gene Alias | C15orf25 | |
| Cytomap | 15q15.2 | |
| Gene Type | protein-coding | GO ID | GO:0000226 | UniProtAcc | Q9NVX0 |
Top |
Malignant transformation analysis |
| Identification of the aberrant gene expression in precancerous and cancerous lesions by comparing the gene expression of stem-like cells in diseased tissues with normal stem cells |
| Entrez ID | Symbol | Replicates | Species | Organ | Tissue | Adj P-value | Log2FC | Malignancy |
| 55142 | HAUS2 | LZE2T | Human | Esophagus | ESCC | 2.32e-04 | 4.40e-01 | 0.082 |
| 55142 | HAUS2 | LZE4T | Human | Esophagus | ESCC | 3.75e-12 | 2.97e-01 | 0.0811 |
| 55142 | HAUS2 | LZE7T | Human | Esophagus | ESCC | 6.75e-04 | 3.09e-01 | 0.0667 |
| 55142 | HAUS2 | LZE22T | Human | Esophagus | ESCC | 1.48e-05 | 3.41e-01 | 0.068 |
| 55142 | HAUS2 | LZE24T | Human | Esophagus | ESCC | 4.08e-06 | 1.78e-01 | 0.0596 |
| 55142 | HAUS2 | LZE21T | Human | Esophagus | ESCC | 3.58e-08 | 3.13e-01 | 0.0655 |
| 55142 | HAUS2 | LZE6T | Human | Esophagus | ESCC | 1.34e-05 | 2.66e-01 | 0.0845 |
| 55142 | HAUS2 | P1T-E | Human | Esophagus | ESCC | 1.41e-04 | 2.39e-01 | 0.0875 |
| 55142 | HAUS2 | P2T-E | Human | Esophagus | ESCC | 3.98e-12 | 1.83e-01 | 0.1177 |
| 55142 | HAUS2 | P4T-E | Human | Esophagus | ESCC | 1.12e-24 | 6.21e-01 | 0.1323 |
| 55142 | HAUS2 | P5T-E | Human | Esophagus | ESCC | 8.27e-31 | 5.72e-01 | 0.1327 |
| 55142 | HAUS2 | P8T-E | Human | Esophagus | ESCC | 8.18e-15 | 2.27e-01 | 0.0889 |
| 55142 | HAUS2 | P9T-E | Human | Esophagus | ESCC | 1.82e-14 | 3.77e-01 | 0.1131 |
| 55142 | HAUS2 | P10T-E | Human | Esophagus | ESCC | 2.35e-23 | 3.11e-01 | 0.116 |
| 55142 | HAUS2 | P11T-E | Human | Esophagus | ESCC | 8.55e-06 | 2.75e-01 | 0.1426 |
| 55142 | HAUS2 | P12T-E | Human | Esophagus | ESCC | 1.57e-23 | 4.47e-01 | 0.1122 |
| 55142 | HAUS2 | P15T-E | Human | Esophagus | ESCC | 3.04e-24 | 5.08e-01 | 0.1149 |
| 55142 | HAUS2 | P16T-E | Human | Esophagus | ESCC | 1.47e-17 | 2.77e-01 | 0.1153 |
| 55142 | HAUS2 | P19T-E | Human | Esophagus | ESCC | 1.74e-04 | 5.99e-01 | 0.1662 |
| 55142 | HAUS2 | P20T-E | Human | Esophagus | ESCC | 6.24e-11 | 2.50e-01 | 0.1124 |
| Page: 1 2 3 4 5 |
| Tissue | Expression Dynamics | Abbreviation |
| Esophagus | 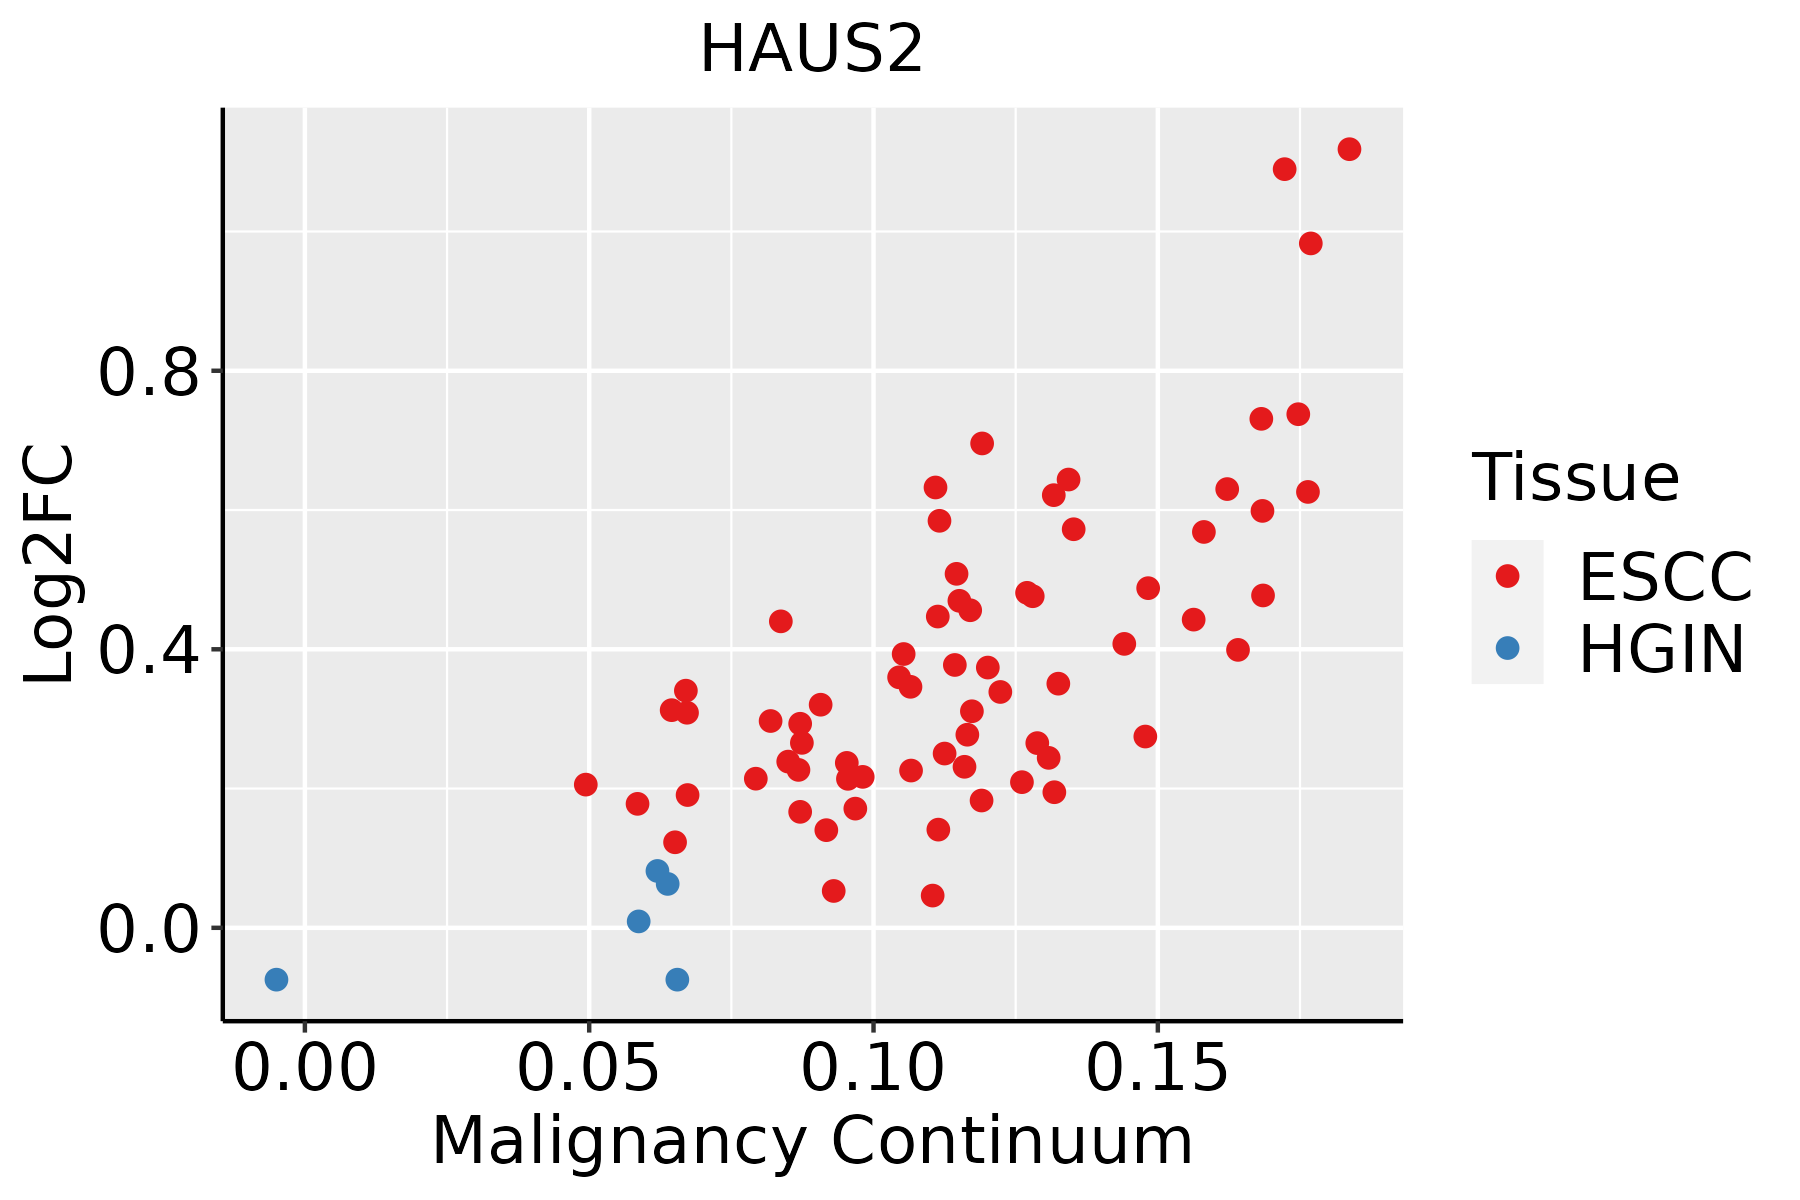 | ESCC: Esophageal squamous cell carcinoma |
| HGIN: High-grade intraepithelial neoplasias | ||
| LGIN: Low-grade intraepithelial neoplasias | ||
| Liver |  | HCC: Hepatocellular carcinoma |
| NAFLD: Non-alcoholic fatty liver disease | ||
| Oral Cavity | 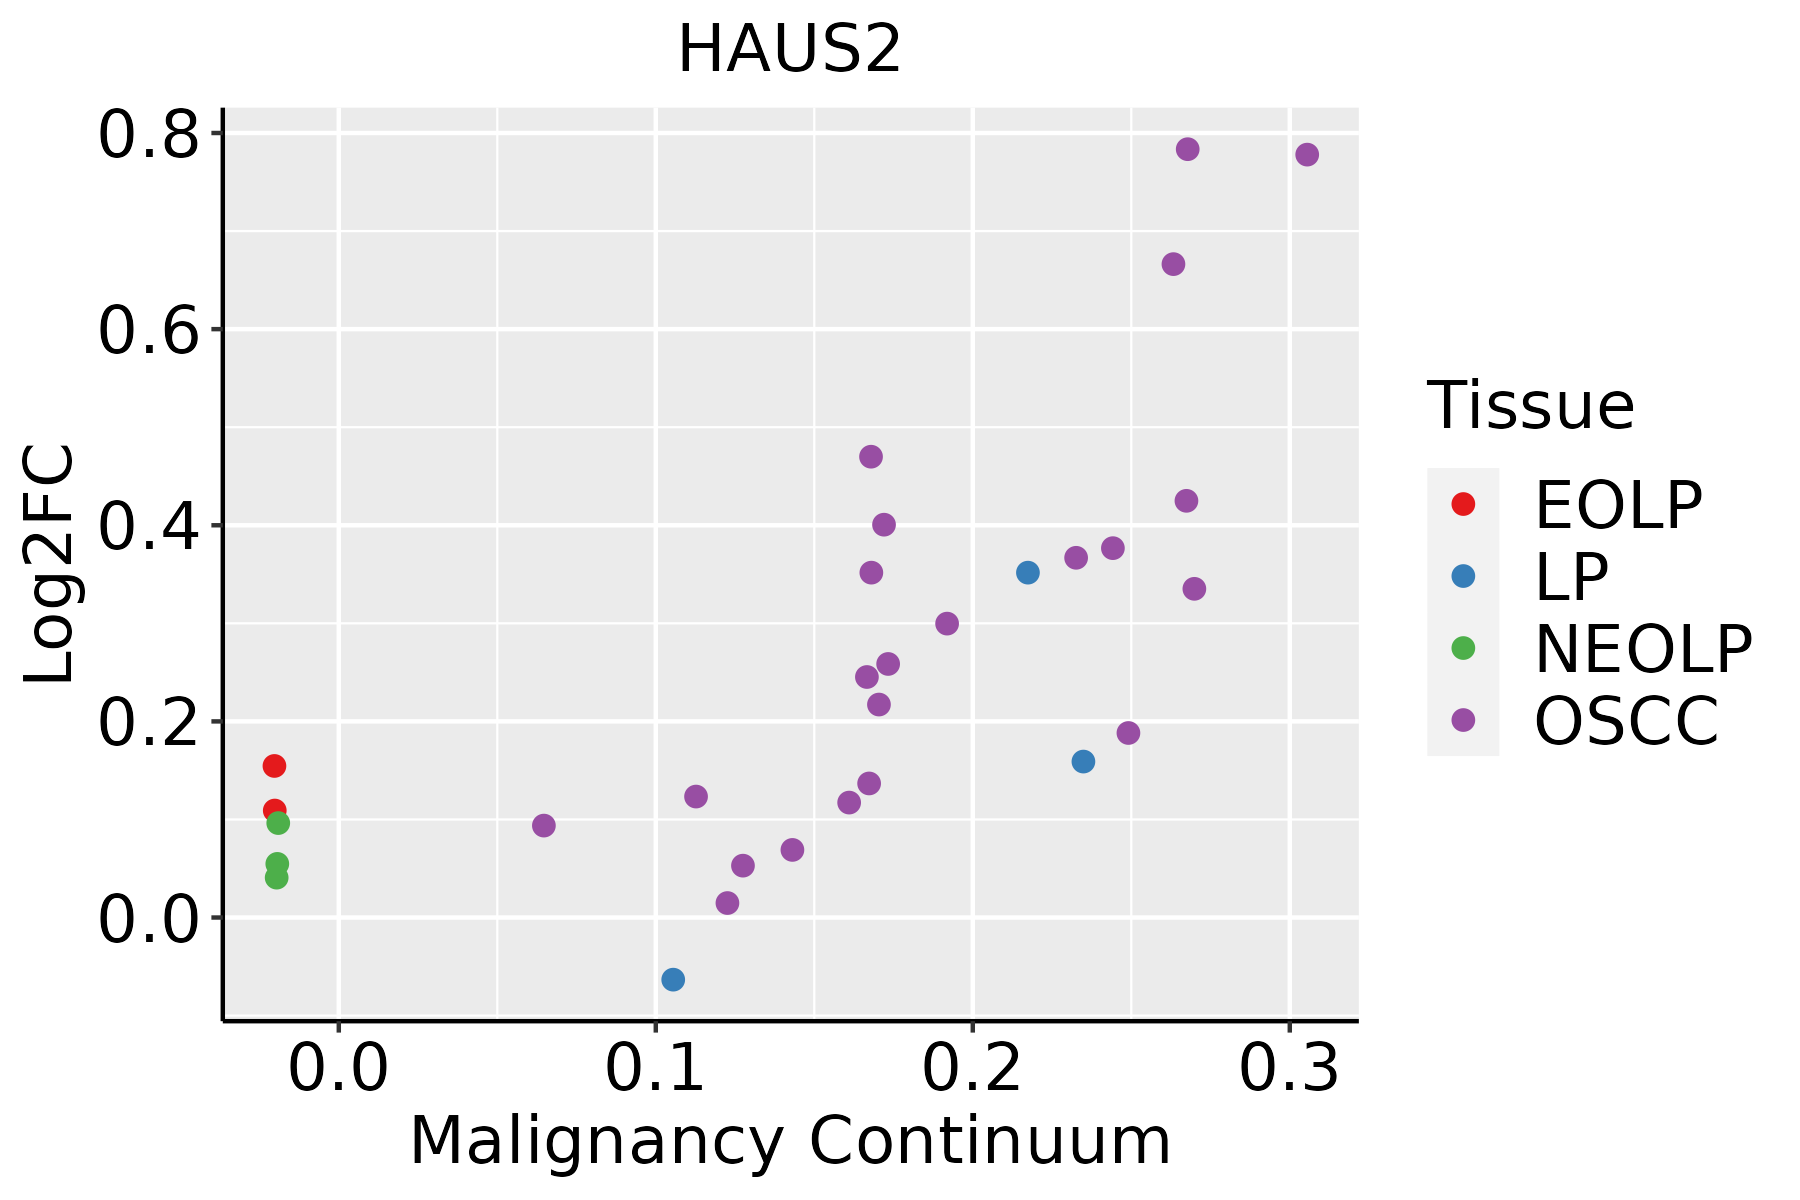 | EOLP: Erosive Oral lichen planus |
| LP: leukoplakia | ||
| NEOLP: Non-erosive oral lichen planus | ||
| OSCC: Oral squamous cell carcinoma | ||
| Skin | 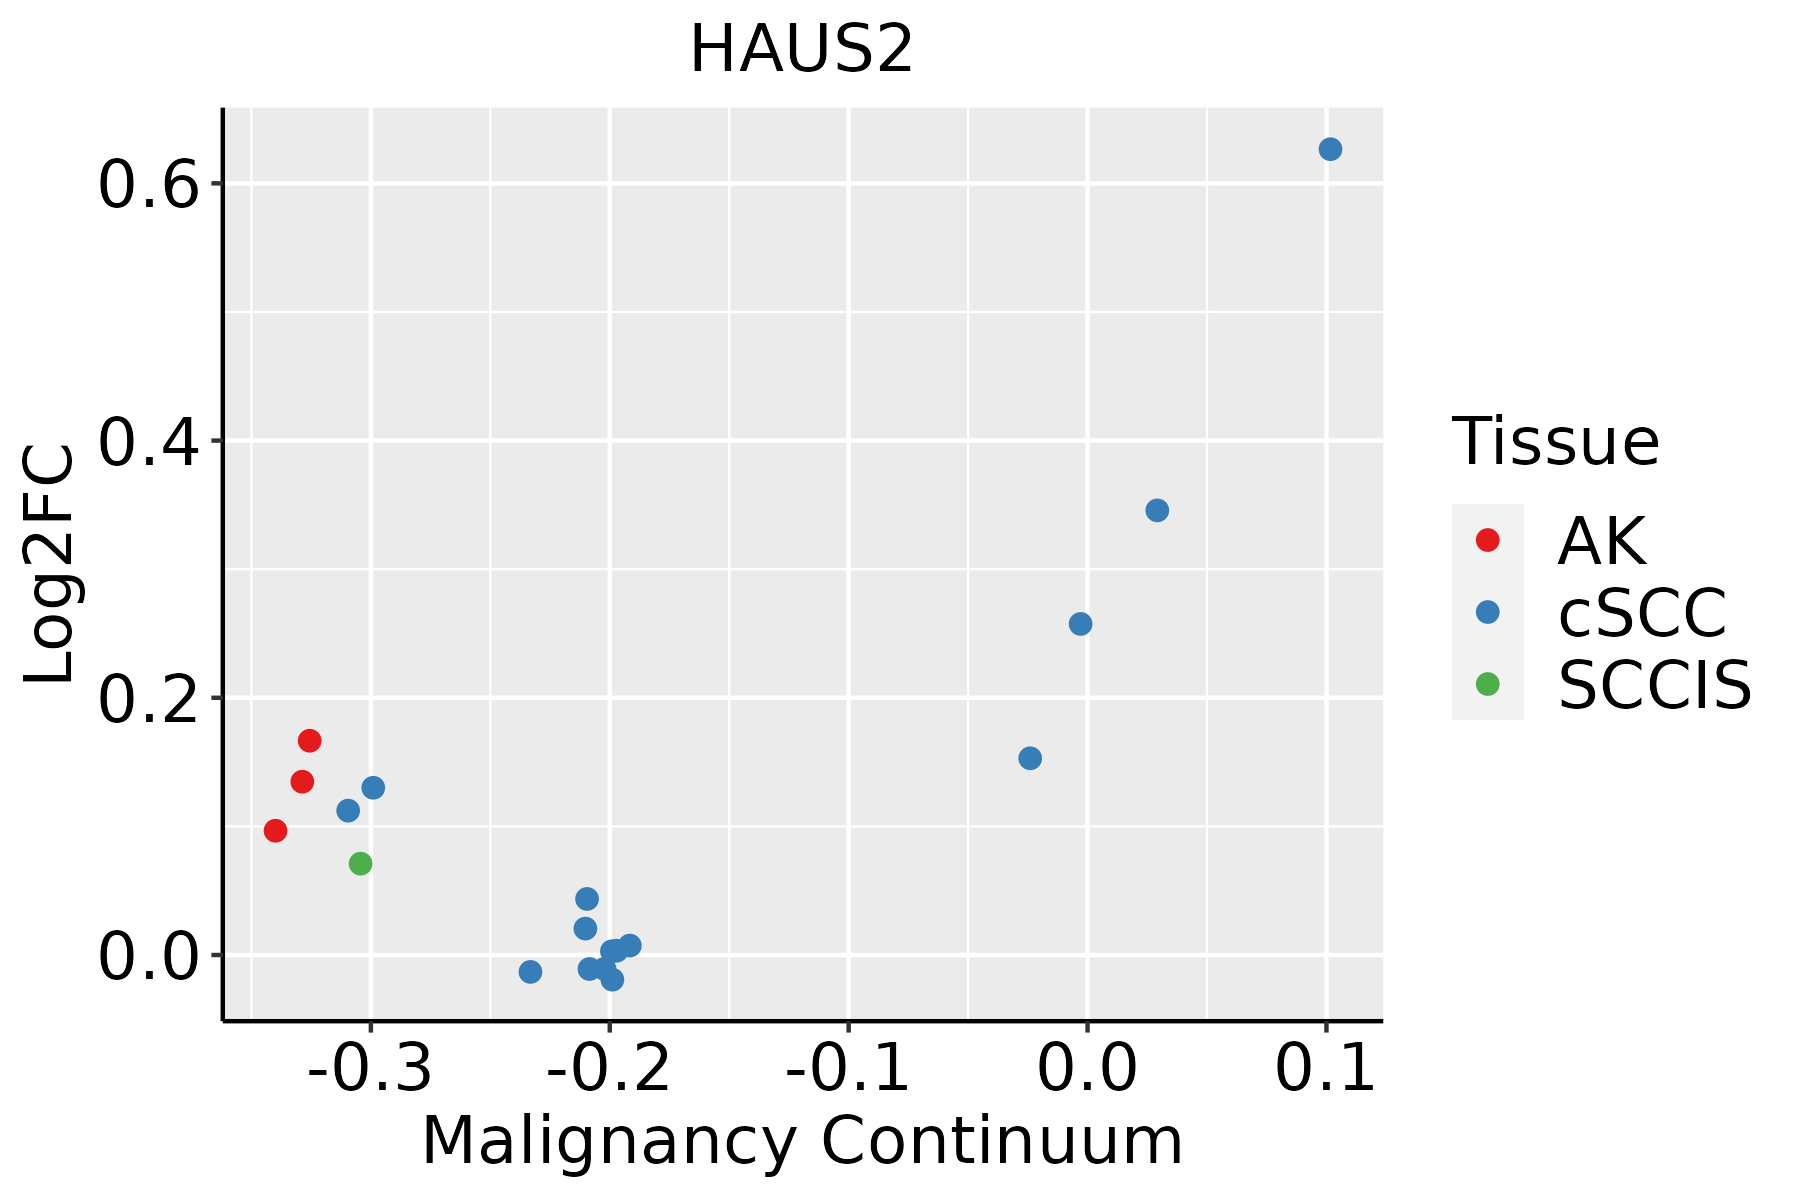 | AK: Actinic keratosis |
| cSCC: Cutaneous squamous cell carcinoma | ||
| SCCIS:squamous cell carcinoma in situ |
| ∗log2FC in expression of this searched gene in stem-like cells from each diseased tissue sample relative to stem-like cells in normal samples in each tissue plotted against the malignancy continuum. Samples are colored based on if they are from different disease stage. |
Top |
Malignant transformation related pathway analysis |
| Find out the enriched GO biological processes and KEGG pathways involved in transition from healthy to precancer to cancer |
| Tissue | Disease Stage | Enriched GO biological Processes |
| Colorectum | AD |  |
| Colorectum | SER |  |
| Colorectum | MSS |  |
| Colorectum | MSI-H |  |
| Colorectum | FAP |  |
| ∗Top 15 enriched GO BP terms are showed in the bar plot of each disease state in each tissue. Each row represents a significant GO biological process which is colored according to the -log10(p.adjust). |
| Page: 1 2 3 4 5 6 7 8 9 |
| GO ID | Tissue | Disease Stage | Description | Gene Ratio | Bg Ratio | pvalue | p.adjust | Count |
| GO:000705114 | Esophagus | ESCC | spindle organization | 134/8552 | 184/18723 | 5.70e-14 | 2.87e-12 | 134 |
| GO:00512256 | Esophagus | ESCC | spindle assembly | 85/8552 | 117/18723 | 2.72e-09 | 5.98e-08 | 85 |
| GO:0051258111 | Esophagus | ESCC | protein polymerization | 183/8552 | 297/18723 | 1.94e-08 | 3.75e-07 | 183 |
| GO:00070982 | Esophagus | ESCC | centrosome cycle | 85/8552 | 130/18723 | 4.41e-06 | 4.69e-05 | 85 |
| GO:00310233 | Esophagus | ESCC | microtubule organizing center organization | 92/8552 | 143/18723 | 5.04e-06 | 5.31e-05 | 92 |
| GO:00311094 | Esophagus | ESCC | microtubule polymerization or depolymerization | 77/8552 | 122/18723 | 7.60e-05 | 5.68e-04 | 77 |
| GO:00467856 | Esophagus | ESCC | microtubule polymerization | 55/8552 | 83/18723 | 1.21e-04 | 8.31e-04 | 55 |
| GO:00070205 | Esophagus | ESCC | microtubule nucleation | 27/8552 | 35/18723 | 1.48e-04 | 9.88e-04 | 27 |
| GO:005125822 | Liver | HCC | protein polymerization | 182/7958 | 297/18723 | 4.17e-11 | 1.58e-09 | 182 |
| GO:000705111 | Liver | HCC | spindle organization | 116/7958 | 184/18723 | 1.40e-08 | 3.40e-07 | 116 |
| GO:005122511 | Liver | HCC | spindle assembly | 75/7958 | 117/18723 | 1.92e-06 | 2.67e-05 | 75 |
| GO:0031023 | Liver | HCC | microtubule organizing center organization | 82/7958 | 143/18723 | 2.38e-04 | 1.79e-03 | 82 |
| GO:0007098 | Liver | HCC | centrosome cycle | 75/7958 | 130/18723 | 3.33e-04 | 2.34e-03 | 75 |
| GO:0046785 | Liver | HCC | microtubule polymerization | 51/7958 | 83/18723 | 3.82e-04 | 2.61e-03 | 51 |
| GO:0007020 | Liver | HCC | microtubule nucleation | 25/7958 | 35/18723 | 5.05e-04 | 3.29e-03 | 25 |
| GO:0031109 | Liver | HCC | microtubule polymerization or depolymerization | 68/7958 | 122/18723 | 2.14e-03 | 1.08e-02 | 68 |
| GO:00070517 | Oral cavity | OSCC | spindle organization | 117/7305 | 184/18723 | 1.16e-11 | 4.17e-10 | 117 |
| GO:005125820 | Oral cavity | OSCC | protein polymerization | 169/7305 | 297/18723 | 2.57e-10 | 7.17e-09 | 169 |
| GO:00512255 | Oral cavity | OSCC | spindle assembly | 73/7305 | 117/18723 | 2.51e-07 | 3.96e-06 | 73 |
| GO:00070204 | Oral cavity | OSCC | microtubule nucleation | 28/7305 | 35/18723 | 8.71e-07 | 1.19e-05 | 28 |
| Page: 1 2 |
| Pathway ID | Tissue | Disease Stage | Description | Gene Ratio | Bg Ratio | pvalue | p.adjust | qvalue | Count |
| Page: 1 |
Top |
Cell-cell communication analysis |
| Identification of potential cell-cell interactions between two cell types and their ligand-receptor pairs for different disease states |
| Ligand | Receptor | LRpair | Pathway | Tissue | Disease Stage |
| Page: 1 |
Top |
Single-cell gene regulatory network inference analysis |
| Find out the significant the regulons (TFs) and the target genes of each regulon across cell types for different disease states |
| TF | Cell Type | Tissue | Disease Stage | Target Gene | RSS | Regulon Activity |
| ∗The dot plots of a searched regulon are shown for all cell subpopulations in each disease state of each tissue based on the regulon specific score inferred using pySCENIC and by calculating the average expression. |
| Page: 1 |
Top |
Somatic mutation of malignant transformation related genes |
| Annotation of somatic variants for genes involved in malignant transformation |
| Hugo Symbol | Variant Class | Variant Classification | dbSNP RS | HGVSc | HGVSp | HGVSp Short | SWISSPROT | BIOTYPE | SIFT | PolyPhen | Tumor Sample Barcode | Tissue | Histology | Sex | Age | Stage | Therapy Types | Drugs | Outcome |
| HAUS2 | SNV | Missense_Mutation | c.539C>T | p.Thr180Ile | p.T180I | Q9NVX0 | protein_coding | tolerated(0.56) | benign(0.391) | TCGA-BH-A0HF-01 | Breast | breast invasive carcinoma | Female | >=65 | I/II | Hormone Therapy | arimidex | SD | |
| HAUS2 | SNV | Missense_Mutation | c.315N>C | p.Glu105Asp | p.E105D | Q9NVX0 | protein_coding | deleterious(0.03) | benign(0.021) | TCGA-EK-A2PG-01 | Cervix | cervical & endocervical cancer | Female | >=65 | I/II | Unknown | Unknown | SD | |
| HAUS2 | SNV | Missense_Mutation | c.373N>A | p.Glu125Lys | p.E125K | Q9NVX0 | protein_coding | tolerated(0.05) | possibly_damaging(0.88) | TCGA-EK-A3GM-01 | Cervix | cervical & endocervical cancer | Female | >=65 | I/II | Unknown | Unknown | SD | |
| HAUS2 | SNV | Missense_Mutation | c.535N>C | p.Glu179Gln | p.E179Q | Q9NVX0 | protein_coding | deleterious(0) | benign(0.439) | TCGA-Q1-A5R2-01 | Cervix | cervical & endocervical cancer | Female | <65 | I/II | Chemotherapy | cisplatin | PR | |
| HAUS2 | SNV | Missense_Mutation | novel | c.125N>A | p.Ser42Tyr | p.S42Y | Q9NVX0 | protein_coding | deleterious(0) | benign(0.246) | TCGA-CA-6717-01 | Colorectum | colon adenocarcinoma | Male | <65 | I/II | Chemotherapy | oxaliplatin | CR |
| HAUS2 | SNV | Missense_Mutation | novel | c.617N>T | p.Ala206Val | p.A206V | Q9NVX0 | protein_coding | tolerated_low_confidence(0.05) | benign(0.178) | TCGA-A5-A0G1-01 | Endometrium | uterine corpus endometrioid carcinoma | Female | >=65 | I/II | Unknown | Unknown | SD |
| HAUS2 | SNV | Missense_Mutation | rs777814162 | c.572G>A | p.Arg191His | p.R191H | Q9NVX0 | protein_coding | deleterious(0) | possibly_damaging(0.783) | TCGA-A5-A0VP-01 | Endometrium | uterine corpus endometrioid carcinoma | Female | >=65 | I/II | Unknown | Unknown | SD |
| HAUS2 | SNV | Missense_Mutation | novel | c.648N>G | p.Ile216Met | p.I216M | Q9NVX0 | protein_coding | tolerated_low_confidence(0.05) | possibly_damaging(0.487) | TCGA-AJ-A3EL-01 | Endometrium | uterine corpus endometrioid carcinoma | Female | <65 | I/II | Unknown | Unknown | SD |
| HAUS2 | SNV | Missense_Mutation | novel | c.643G>T | p.Asp215Tyr | p.D215Y | Q9NVX0 | protein_coding | deleterious_low_confidence(0) | benign(0.006) | TCGA-AP-A1E0-01 | Endometrium | uterine corpus endometrioid carcinoma | Female | <65 | III/IV | Chemotherapy | paclitaxel | SD |
| HAUS2 | SNV | Missense_Mutation | c.236N>C | p.Val79Ala | p.V79A | Q9NVX0 | protein_coding | deleterious(0) | benign(0.115) | TCGA-AX-A0J1-01 | Endometrium | uterine corpus endometrioid carcinoma | Female | >=65 | I/II | Unknown | Unknown | SD |
| Page: 1 2 3 |
Top |
Related drugs of malignant transformation related genes |
| Identification of chemicals and drugs interact with genes involved in malignant transfromation |
| (DGIdb 4.0) |
| Entrez ID | Symbol | Category | Interaction Types | Drug Claim Name | Drug Name | PMIDs |
| Page: 1 |

Copyright 2023-Present -The University of Texas Health Science Center at Houston |