
|
|||||
|
 | |
| |
| |
| |
| |
| |
|
Gene: HAUS1 |
Gene summary for HAUS1 |
| Gene information | Species | Human | Gene symbol | HAUS1 | Gene ID | 115106 |
| Gene name | HAUS augmin like complex subunit 1 | |
| Gene Alias | CCDC5 | |
| Cytomap | 18q21.1 | |
| Gene Type | protein-coding | GO ID | GO:0000226 | UniProtAcc | Q96CS2 |
Top |
Malignant transformation analysis |
| Identification of the aberrant gene expression in precancerous and cancerous lesions by comparing the gene expression of stem-like cells in diseased tissues with normal stem cells |
| Entrez ID | Symbol | Replicates | Species | Organ | Tissue | Adj P-value | Log2FC | Malignancy |
| 115106 | HAUS1 | LZE7T | Human | Esophagus | ESCC | 4.12e-10 | 7.42e-01 | 0.0667 |
| 115106 | HAUS1 | LZE24T | Human | Esophagus | ESCC | 3.66e-04 | 1.35e-01 | 0.0596 |
| 115106 | HAUS1 | P1T-E | Human | Esophagus | ESCC | 8.44e-09 | 3.75e-01 | 0.0875 |
| 115106 | HAUS1 | P2T-E | Human | Esophagus | ESCC | 4.82e-25 | 4.70e-01 | 0.1177 |
| 115106 | HAUS1 | P4T-E | Human | Esophagus | ESCC | 1.13e-36 | 8.98e-01 | 0.1323 |
| 115106 | HAUS1 | P5T-E | Human | Esophagus | ESCC | 4.24e-11 | 2.20e-01 | 0.1327 |
| 115106 | HAUS1 | P8T-E | Human | Esophagus | ESCC | 7.32e-17 | 2.74e-01 | 0.0889 |
| 115106 | HAUS1 | P9T-E | Human | Esophagus | ESCC | 5.20e-21 | 4.96e-01 | 0.1131 |
| 115106 | HAUS1 | P10T-E | Human | Esophagus | ESCC | 9.70e-21 | 3.75e-01 | 0.116 |
| 115106 | HAUS1 | P11T-E | Human | Esophagus | ESCC | 1.55e-09 | 3.84e-01 | 0.1426 |
| 115106 | HAUS1 | P12T-E | Human | Esophagus | ESCC | 2.12e-10 | 2.75e-01 | 0.1122 |
| 115106 | HAUS1 | P15T-E | Human | Esophagus | ESCC | 5.22e-09 | 2.01e-01 | 0.1149 |
| 115106 | HAUS1 | P16T-E | Human | Esophagus | ESCC | 2.03e-08 | 1.81e-01 | 0.1153 |
| 115106 | HAUS1 | P20T-E | Human | Esophagus | ESCC | 2.91e-07 | 2.05e-01 | 0.1124 |
| 115106 | HAUS1 | P21T-E | Human | Esophagus | ESCC | 1.27e-26 | 4.66e-01 | 0.1617 |
| 115106 | HAUS1 | P22T-E | Human | Esophagus | ESCC | 9.96e-21 | 3.92e-01 | 0.1236 |
| 115106 | HAUS1 | P23T-E | Human | Esophagus | ESCC | 1.51e-26 | 6.11e-01 | 0.108 |
| 115106 | HAUS1 | P24T-E | Human | Esophagus | ESCC | 4.39e-14 | 3.27e-01 | 0.1287 |
| 115106 | HAUS1 | P26T-E | Human | Esophagus | ESCC | 3.27e-32 | 6.41e-01 | 0.1276 |
| 115106 | HAUS1 | P27T-E | Human | Esophagus | ESCC | 1.53e-15 | 2.95e-01 | 0.1055 |
| Page: 1 2 3 4 5 |
| Tissue | Expression Dynamics | Abbreviation |
| Esophagus | 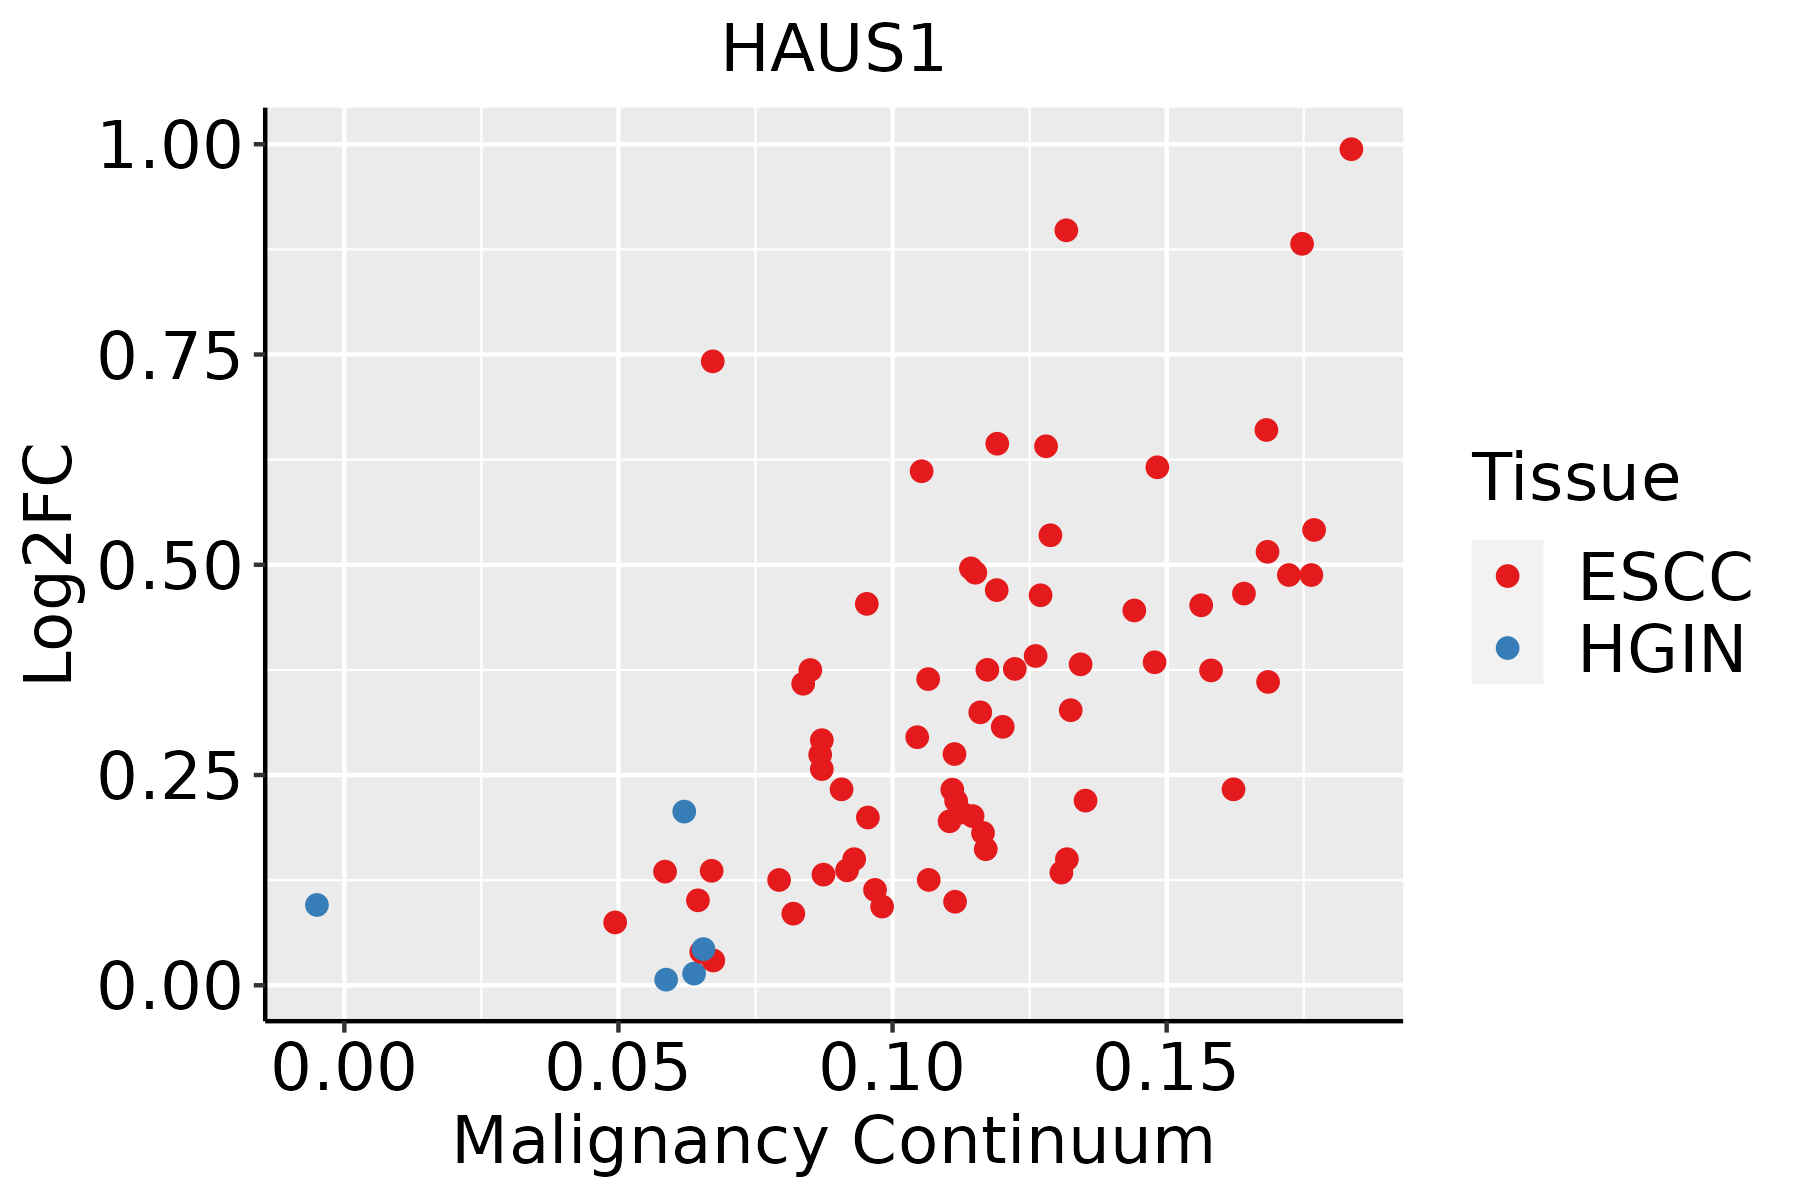 | ESCC: Esophageal squamous cell carcinoma |
| HGIN: High-grade intraepithelial neoplasias | ||
| LGIN: Low-grade intraepithelial neoplasias | ||
| Oral Cavity |  | EOLP: Erosive Oral lichen planus |
| LP: leukoplakia | ||
| NEOLP: Non-erosive oral lichen planus | ||
| OSCC: Oral squamous cell carcinoma | ||
| Skin |  | AK: Actinic keratosis |
| cSCC: Cutaneous squamous cell carcinoma | ||
| SCCIS:squamous cell carcinoma in situ | ||
| Thyroid | 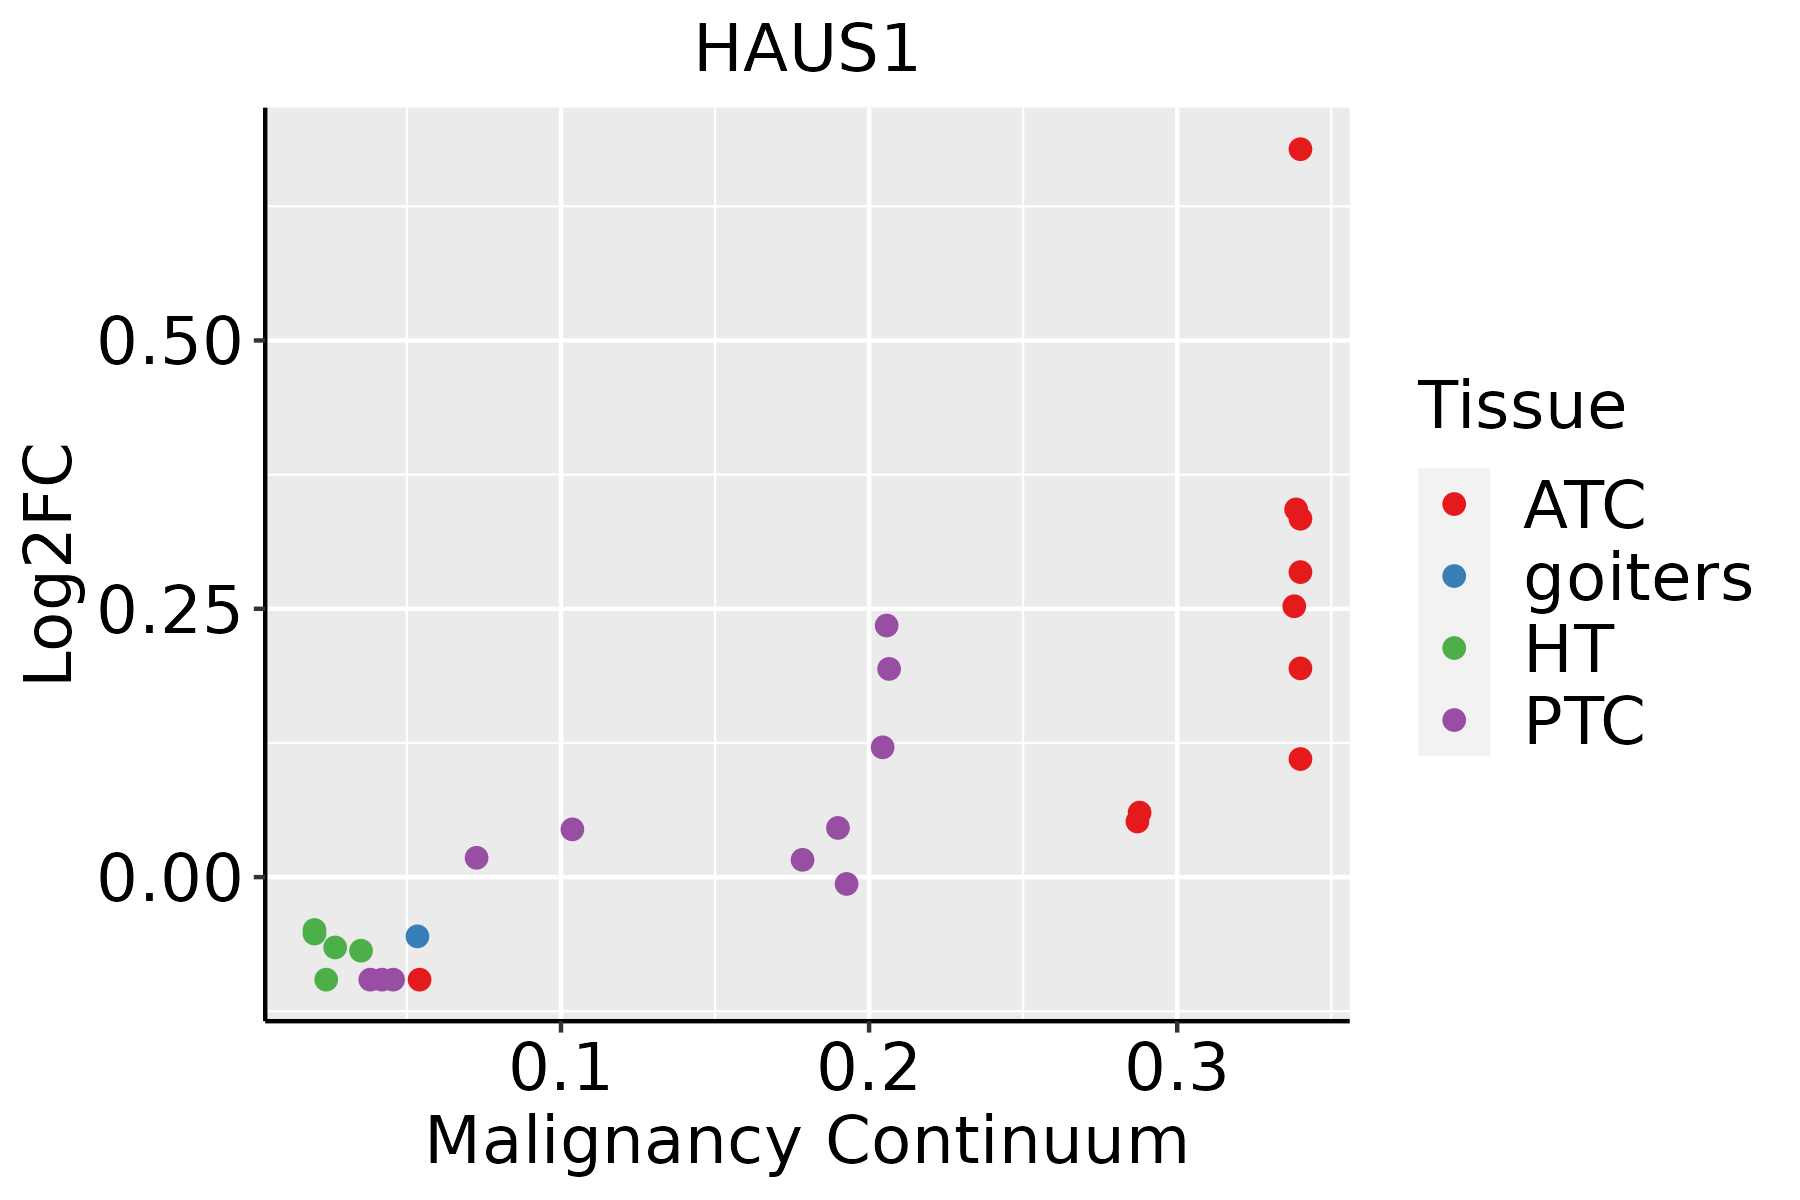 | ATC: Anaplastic thyroid cancer |
| HT: Hashimoto's thyroiditis | ||
| PTC: Papillary thyroid cancer |
| ∗log2FC in expression of this searched gene in stem-like cells from each diseased tissue sample relative to stem-like cells in normal samples in each tissue plotted against the malignancy continuum. Samples are colored based on if they are from different disease stage. |
Top |
Malignant transformation related pathway analysis |
| Find out the enriched GO biological processes and KEGG pathways involved in transition from healthy to precancer to cancer |
| Tissue | Disease Stage | Enriched GO biological Processes |
| Colorectum | AD |  |
| Colorectum | SER |  |
| Colorectum | MSS |  |
| Colorectum | MSI-H |  |
| Colorectum | FAP |  |
| ∗Top 15 enriched GO BP terms are showed in the bar plot of each disease state in each tissue. Each row represents a significant GO biological process which is colored according to the -log10(p.adjust). |
| Page: 1 2 3 4 5 6 7 8 9 |
| GO ID | Tissue | Disease Stage | Description | Gene Ratio | Bg Ratio | pvalue | p.adjust | Count |
| GO:000705114 | Esophagus | ESCC | spindle organization | 134/8552 | 184/18723 | 5.70e-14 | 2.87e-12 | 134 |
| GO:00512256 | Esophagus | ESCC | spindle assembly | 85/8552 | 117/18723 | 2.72e-09 | 5.98e-08 | 85 |
| GO:00070982 | Esophagus | ESCC | centrosome cycle | 85/8552 | 130/18723 | 4.41e-06 | 4.69e-05 | 85 |
| GO:00310233 | Esophagus | ESCC | microtubule organizing center organization | 92/8552 | 143/18723 | 5.04e-06 | 5.31e-05 | 92 |
| GO:00070517 | Oral cavity | OSCC | spindle organization | 117/7305 | 184/18723 | 1.16e-11 | 4.17e-10 | 117 |
| GO:00512255 | Oral cavity | OSCC | spindle assembly | 73/7305 | 117/18723 | 2.51e-07 | 3.96e-06 | 73 |
| GO:00070981 | Oral cavity | OSCC | centrosome cycle | 66/7305 | 130/18723 | 4.17e-03 | 1.70e-02 | 66 |
| GO:00310232 | Oral cavity | OSCC | microtubule organizing center organization | 70/7305 | 143/18723 | 9.71e-03 | 3.44e-02 | 70 |
| GO:000705113 | Oral cavity | LP | spindle organization | 72/4623 | 184/18723 | 9.67e-06 | 1.78e-04 | 72 |
| GO:005122512 | Oral cavity | LP | spindle assembly | 42/4623 | 117/18723 | 4.39e-03 | 2.80e-02 | 42 |
| GO:000705115 | Skin | cSCC | spindle organization | 96/4864 | 184/18723 | 2.59e-14 | 1.77e-12 | 96 |
| GO:005122513 | Skin | cSCC | spindle assembly | 60/4864 | 117/18723 | 4.15e-09 | 1.41e-07 | 60 |
| GO:00310234 | Skin | cSCC | microtubule organizing center organization | 58/4864 | 143/18723 | 9.47e-05 | 8.83e-04 | 58 |
| GO:00070983 | Skin | cSCC | centrosome cycle | 53/4864 | 130/18723 | 1.59e-04 | 1.39e-03 | 53 |
| GO:000705116 | Thyroid | PTC | spindle organization | 92/5968 | 184/18723 | 2.21e-07 | 3.92e-06 | 92 |
| GO:005122514 | Thyroid | PTC | spindle assembly | 56/5968 | 117/18723 | 2.17e-04 | 1.60e-03 | 56 |
| GO:00310235 | Thyroid | PTC | microtubule organizing center organization | 65/5968 | 143/18723 | 4.48e-04 | 2.96e-03 | 65 |
| GO:00070984 | Thyroid | PTC | centrosome cycle | 59/5968 | 130/18723 | 8.39e-04 | 5.16e-03 | 59 |
| GO:000705122 | Thyroid | ATC | spindle organization | 109/6293 | 184/18723 | 7.99e-13 | 3.46e-11 | 109 |
| GO:005122521 | Thyroid | ATC | spindle assembly | 66/6293 | 117/18723 | 3.28e-07 | 4.88e-06 | 66 |
| Page: 1 2 |
| Pathway ID | Tissue | Disease Stage | Description | Gene Ratio | Bg Ratio | pvalue | p.adjust | qvalue | Count |
| Page: 1 |
Top |
Cell-cell communication analysis |
| Identification of potential cell-cell interactions between two cell types and their ligand-receptor pairs for different disease states |
| Ligand | Receptor | LRpair | Pathway | Tissue | Disease Stage |
| Page: 1 |
Top |
Single-cell gene regulatory network inference analysis |
| Find out the significant the regulons (TFs) and the target genes of each regulon across cell types for different disease states |
| TF | Cell Type | Tissue | Disease Stage | Target Gene | RSS | Regulon Activity |
| ∗The dot plots of a searched regulon are shown for all cell subpopulations in each disease state of each tissue based on the regulon specific score inferred using pySCENIC and by calculating the average expression. |
| Page: 1 |
Top |
Somatic mutation of malignant transformation related genes |
| Annotation of somatic variants for genes involved in malignant transformation |
| Hugo Symbol | Variant Class | Variant Classification | dbSNP RS | HGVSc | HGVSp | HGVSp Short | SWISSPROT | BIOTYPE | SIFT | PolyPhen | Tumor Sample Barcode | Tissue | Histology | Sex | Age | Stage | Therapy Types | Drugs | Outcome |
| HAUS1 | SNV | Missense_Mutation | c.148G>T | p.Asp50Tyr | p.D50Y | Q96CS2 | protein_coding | deleterious(0) | probably_damaging(0.995) | TCGA-A8-A079-01 | Breast | breast invasive carcinoma | Female | >=65 | III/IV | Chemotherapy | 5-fluorouracil | SD | |
| HAUS1 | SNV | Missense_Mutation | novel | c.454N>C | p.Val152Leu | p.V152L | Q96CS2 | protein_coding | tolerated(0.08) | benign(0.015) | TCGA-AR-A256-01 | Breast | breast invasive carcinoma | Female | <65 | I/II | Chemotherapy | doxorubicin | PD |
| HAUS1 | SNV | Missense_Mutation | c.705G>T | p.Lys235Asn | p.K235N | Q96CS2 | protein_coding | deleterious(0.02) | probably_damaging(0.956) | TCGA-FU-A3HZ-01 | Cervix | cervical & endocervical cancer | Female | <65 | I/II | Chemotherapy | cisplatin | CR | |
| HAUS1 | SNV | Missense_Mutation | c.732N>T | p.Leu244Phe | p.L244F | Q96CS2 | protein_coding | deleterious(0) | probably_damaging(0.999) | TCGA-AA-3715-01 | Colorectum | colon adenocarcinoma | Male | >=65 | I/II | Unknown | Unknown | PD | |
| HAUS1 | SNV | Missense_Mutation | c.61N>A | p.Asp21Asn | p.D21N | Q96CS2 | protein_coding | tolerated(0.37) | benign(0.027) | TCGA-AA-3811-01 | Colorectum | colon adenocarcinoma | Female | >=65 | III/IV | Unknown | Unknown | PD | |
| HAUS1 | SNV | Missense_Mutation | rs766441279 | c.95N>A | p.Arg32Gln | p.R32Q | Q96CS2 | protein_coding | tolerated(0.07) | benign(0.308) | TCGA-AZ-6601-01 | Colorectum | colon adenocarcinoma | Male | >=65 | I/II | Unknown | Unknown | PD |
| HAUS1 | SNV | Missense_Mutation | c.146N>T | p.Arg49Met | p.R49M | Q96CS2 | protein_coding | deleterious(0) | probably_damaging(0.947) | TCGA-CK-6746-01 | Colorectum | colon adenocarcinoma | Female | >=65 | I/II | Unknown | Unknown | SD | |
| HAUS1 | SNV | Missense_Mutation | rs769854055 | c.743C>T | p.Pro248Leu | p.P248L | Q96CS2 | protein_coding | tolerated(0.13) | benign(0.073) | TCGA-D5-6928-01 | Colorectum | colon adenocarcinoma | Male | >=65 | I/II | Unknown | Unknown | SD |
| HAUS1 | SNV | Missense_Mutation | rs570163326 | c.533N>A | p.Arg178His | p.R178H | Q96CS2 | protein_coding | tolerated(0.13) | benign(0.031) | TCGA-A5-A0G1-01 | Endometrium | uterine corpus endometrioid carcinoma | Female | >=65 | I/II | Unknown | Unknown | SD |
| HAUS1 | SNV | Missense_Mutation | c.521N>C | p.Lys174Thr | p.K174T | Q96CS2 | protein_coding | tolerated(0.09) | benign(0.109) | TCGA-AP-A056-01 | Endometrium | uterine corpus endometrioid carcinoma | Female | <65 | I/II | Unknown | Unknown | SD |
| Page: 1 2 3 4 |
Top |
Related drugs of malignant transformation related genes |
| Identification of chemicals and drugs interact with genes involved in malignant transfromation |
| (DGIdb 4.0) |
| Entrez ID | Symbol | Category | Interaction Types | Drug Claim Name | Drug Name | PMIDs |
| Page: 1 |

Copyright 2023-Present -The University of Texas Health Science Center at Houston |