
|
|||||
|
 | |
| |
| |
| |
| |
| |
|
Gene: HAT1 |
Gene summary for HAT1 |
| Gene information | Species | Human | Gene symbol | HAT1 | Gene ID | 8520 |
| Gene name | histone acetyltransferase 1 | |
| Gene Alias | KAT1 | |
| Cytomap | 2q31.1 | |
| Gene Type | protein-coding | GO ID | GO:0006323 | UniProtAcc | O14929 |
Top |
Malignant transformation analysis |
| Identification of the aberrant gene expression in precancerous and cancerous lesions by comparing the gene expression of stem-like cells in diseased tissues with normal stem cells |
| Entrez ID | Symbol | Replicates | Species | Organ | Tissue | Adj P-value | Log2FC | Malignancy |
| 8520 | HAT1 | LZE2T | Human | Esophagus | ESCC | 1.11e-04 | 8.03e-01 | 0.082 |
| 8520 | HAT1 | LZE3D | Human | Esophagus | HGIN | 2.82e-02 | 6.51e-01 | 0.0668 |
| 8520 | HAT1 | LZE4T | Human | Esophagus | ESCC | 1.85e-18 | 6.90e-01 | 0.0811 |
| 8520 | HAT1 | LZE7T | Human | Esophagus | ESCC | 6.28e-05 | 6.37e-01 | 0.0667 |
| 8520 | HAT1 | LZE8T | Human | Esophagus | ESCC | 7.23e-06 | 3.37e-01 | 0.067 |
| 8520 | HAT1 | LZE24T | Human | Esophagus | ESCC | 8.49e-15 | 5.45e-01 | 0.0596 |
| 8520 | HAT1 | LZE21T | Human | Esophagus | ESCC | 5.44e-04 | 3.32e-01 | 0.0655 |
| 8520 | HAT1 | LZE6T | Human | Esophagus | ESCC | 1.96e-04 | 4.88e-01 | 0.0845 |
| 8520 | HAT1 | P1T-E | Human | Esophagus | ESCC | 2.03e-07 | 1.68e-01 | 0.0875 |
| 8520 | HAT1 | P2T-E | Human | Esophagus | ESCC | 8.86e-28 | 5.39e-01 | 0.1177 |
| 8520 | HAT1 | P4T-E | Human | Esophagus | ESCC | 1.69e-20 | 8.18e-01 | 0.1323 |
| 8520 | HAT1 | P5T-E | Human | Esophagus | ESCC | 1.17e-20 | 5.08e-01 | 0.1327 |
| 8520 | HAT1 | P8T-E | Human | Esophagus | ESCC | 6.10e-14 | 3.69e-01 | 0.0889 |
| 8520 | HAT1 | P9T-E | Human | Esophagus | ESCC | 1.98e-39 | 1.18e+00 | 0.1131 |
| 8520 | HAT1 | P10T-E | Human | Esophagus | ESCC | 3.35e-19 | 4.15e-01 | 0.116 |
| 8520 | HAT1 | P11T-E | Human | Esophagus | ESCC | 4.96e-11 | 4.98e-01 | 0.1426 |
| 8520 | HAT1 | P12T-E | Human | Esophagus | ESCC | 6.85e-30 | 6.35e-01 | 0.1122 |
| 8520 | HAT1 | P15T-E | Human | Esophagus | ESCC | 1.19e-13 | 5.93e-01 | 0.1149 |
| 8520 | HAT1 | P16T-E | Human | Esophagus | ESCC | 1.80e-20 | 4.86e-01 | 0.1153 |
| 8520 | HAT1 | P17T-E | Human | Esophagus | ESCC | 2.83e-06 | 4.13e-01 | 0.1278 |
| Page: 1 2 3 4 5 6 |
| Tissue | Expression Dynamics | Abbreviation |
| Esophagus | 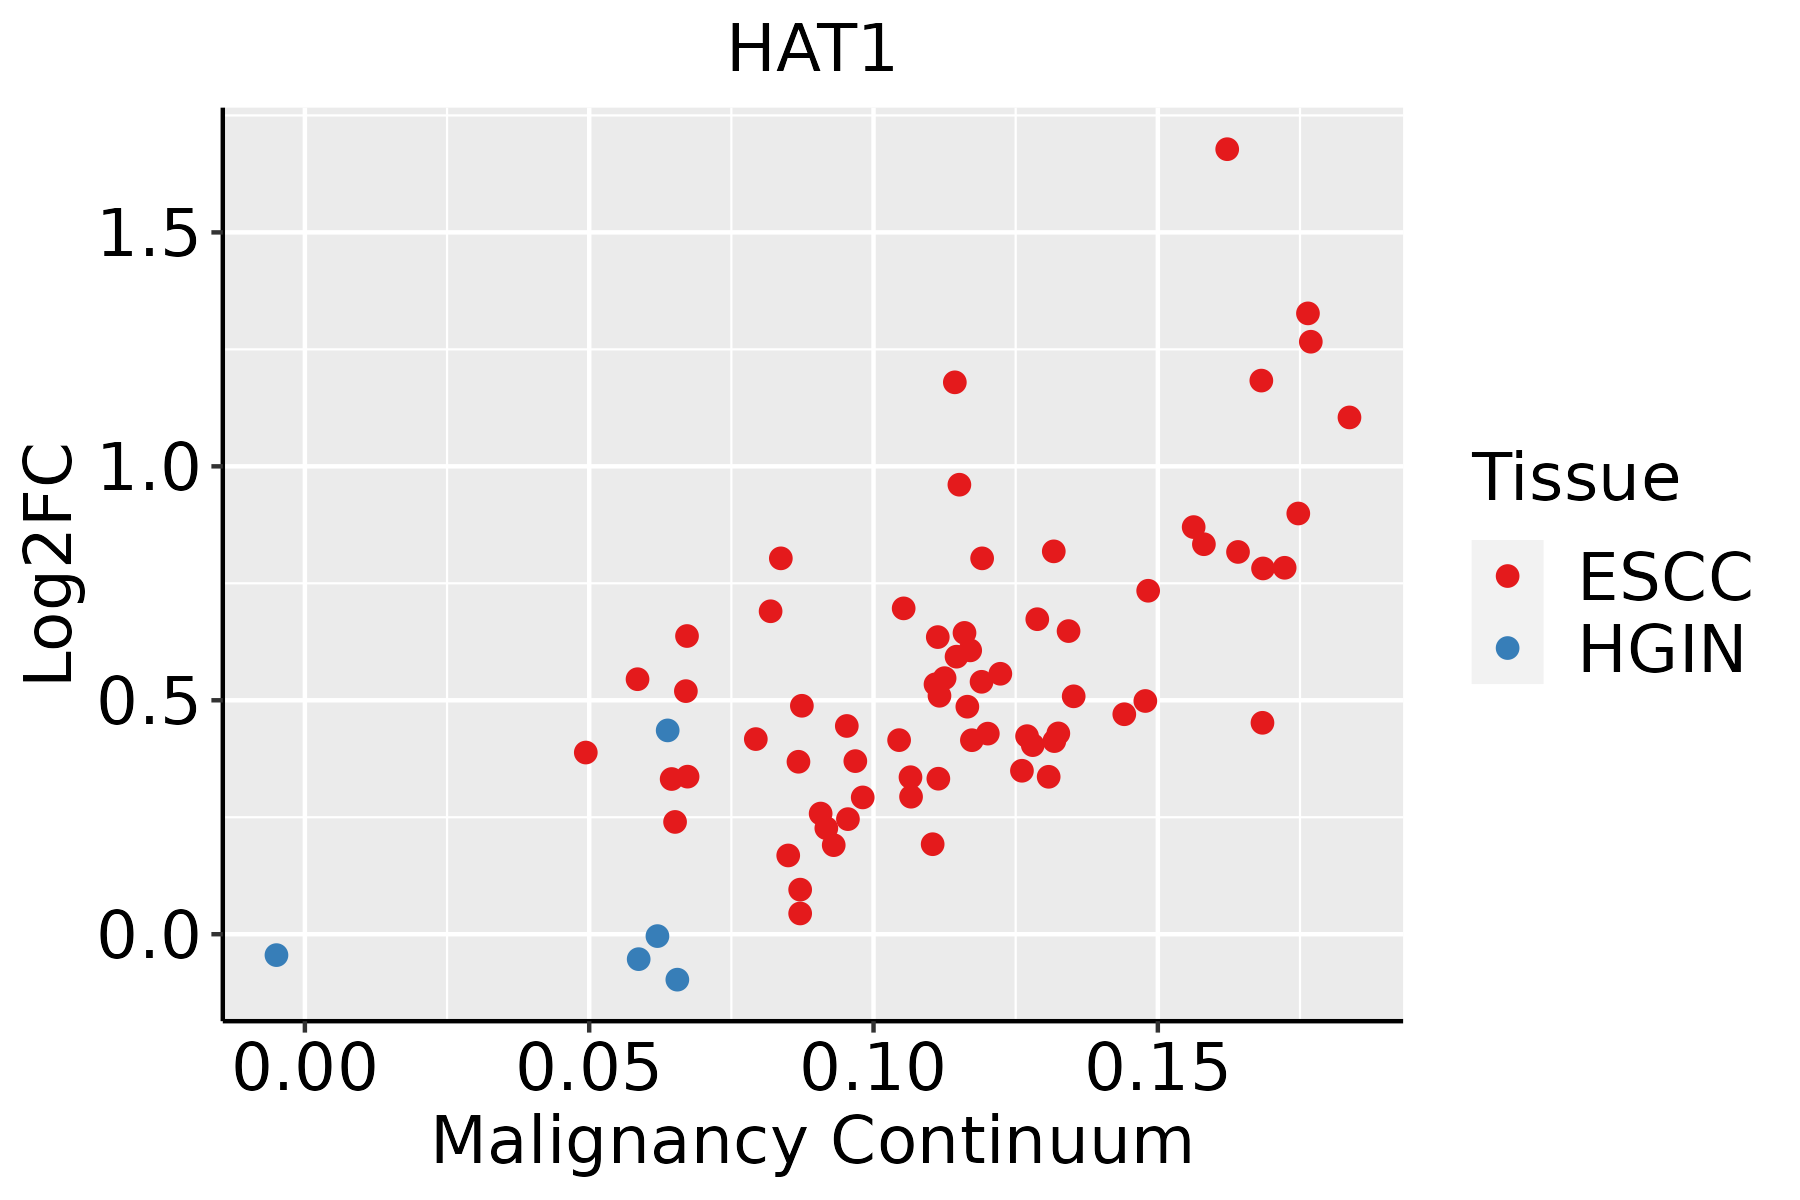 | ESCC: Esophageal squamous cell carcinoma |
| HGIN: High-grade intraepithelial neoplasias | ||
| LGIN: Low-grade intraepithelial neoplasias | ||
| Liver | 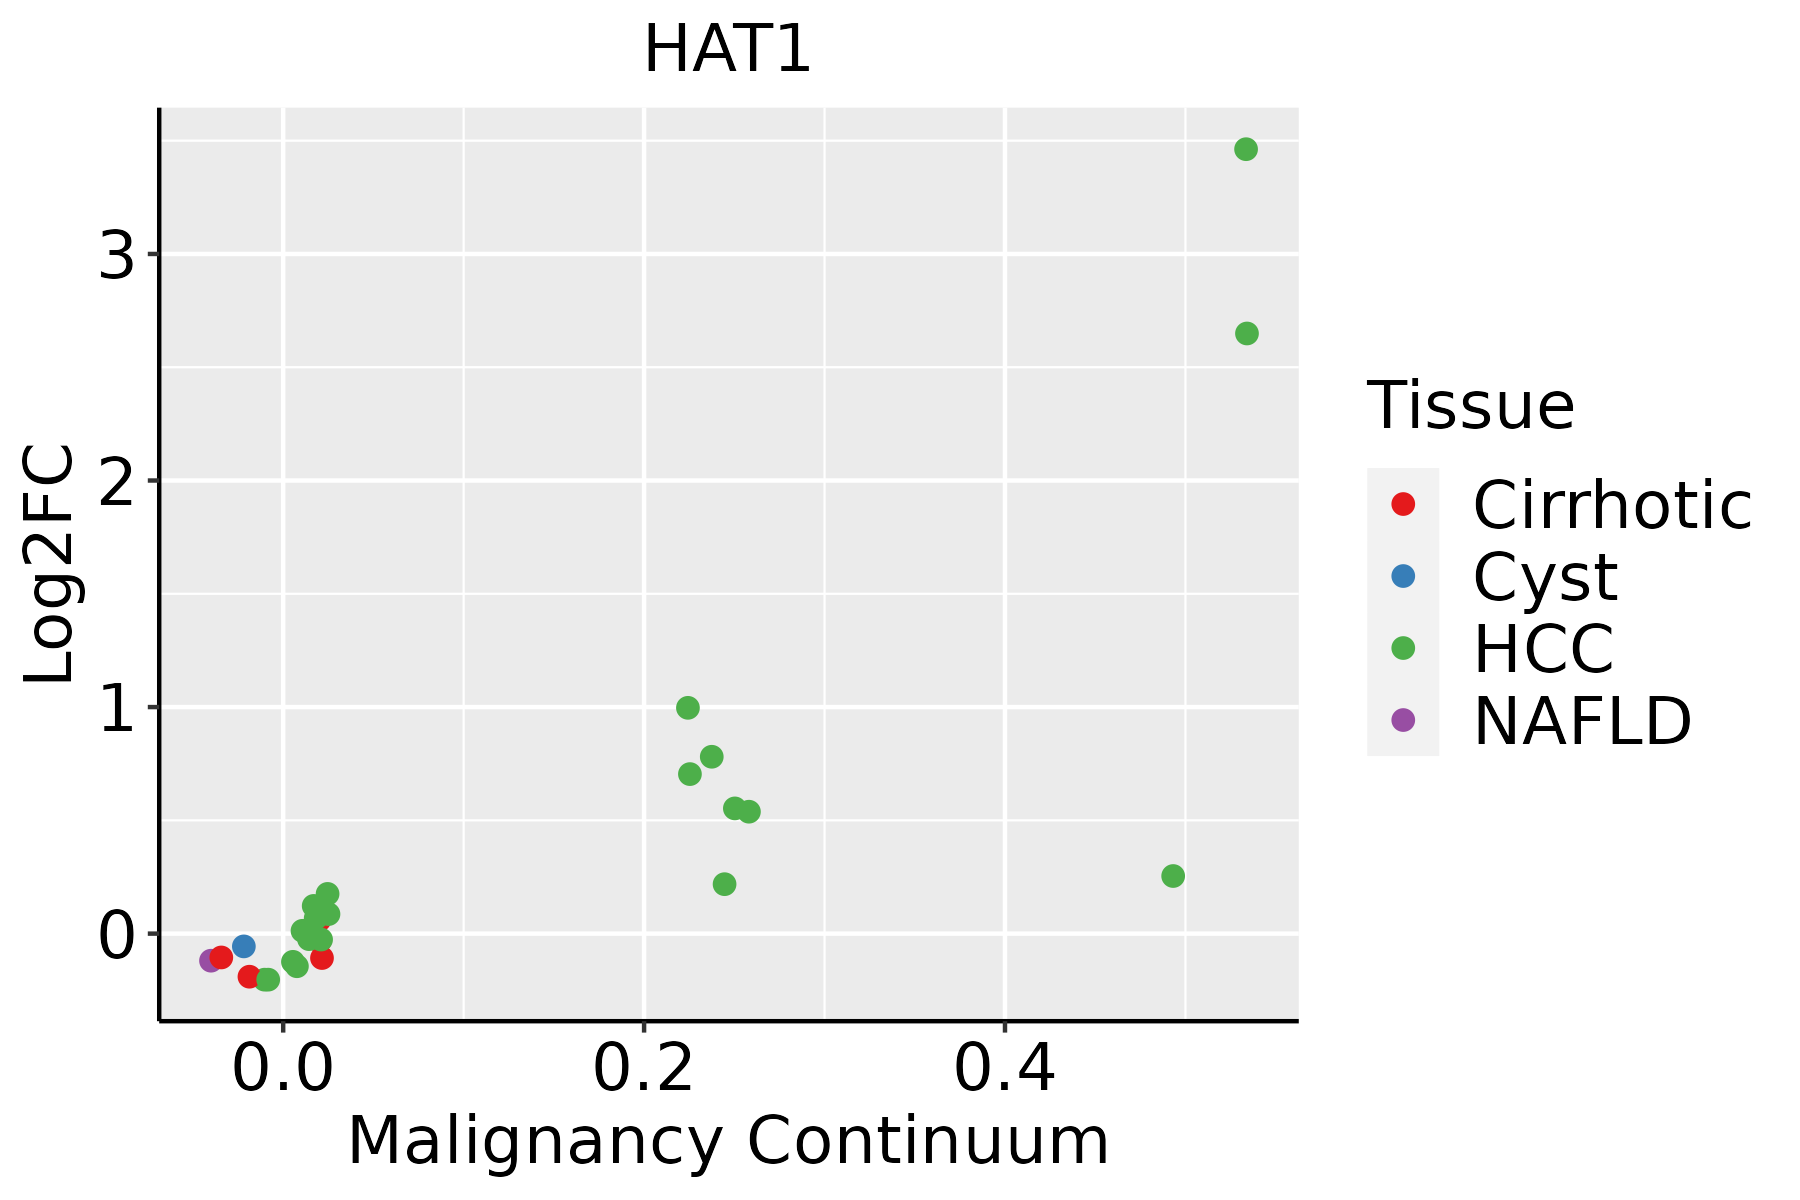 | HCC: Hepatocellular carcinoma |
| NAFLD: Non-alcoholic fatty liver disease | ||
| Oral Cavity | 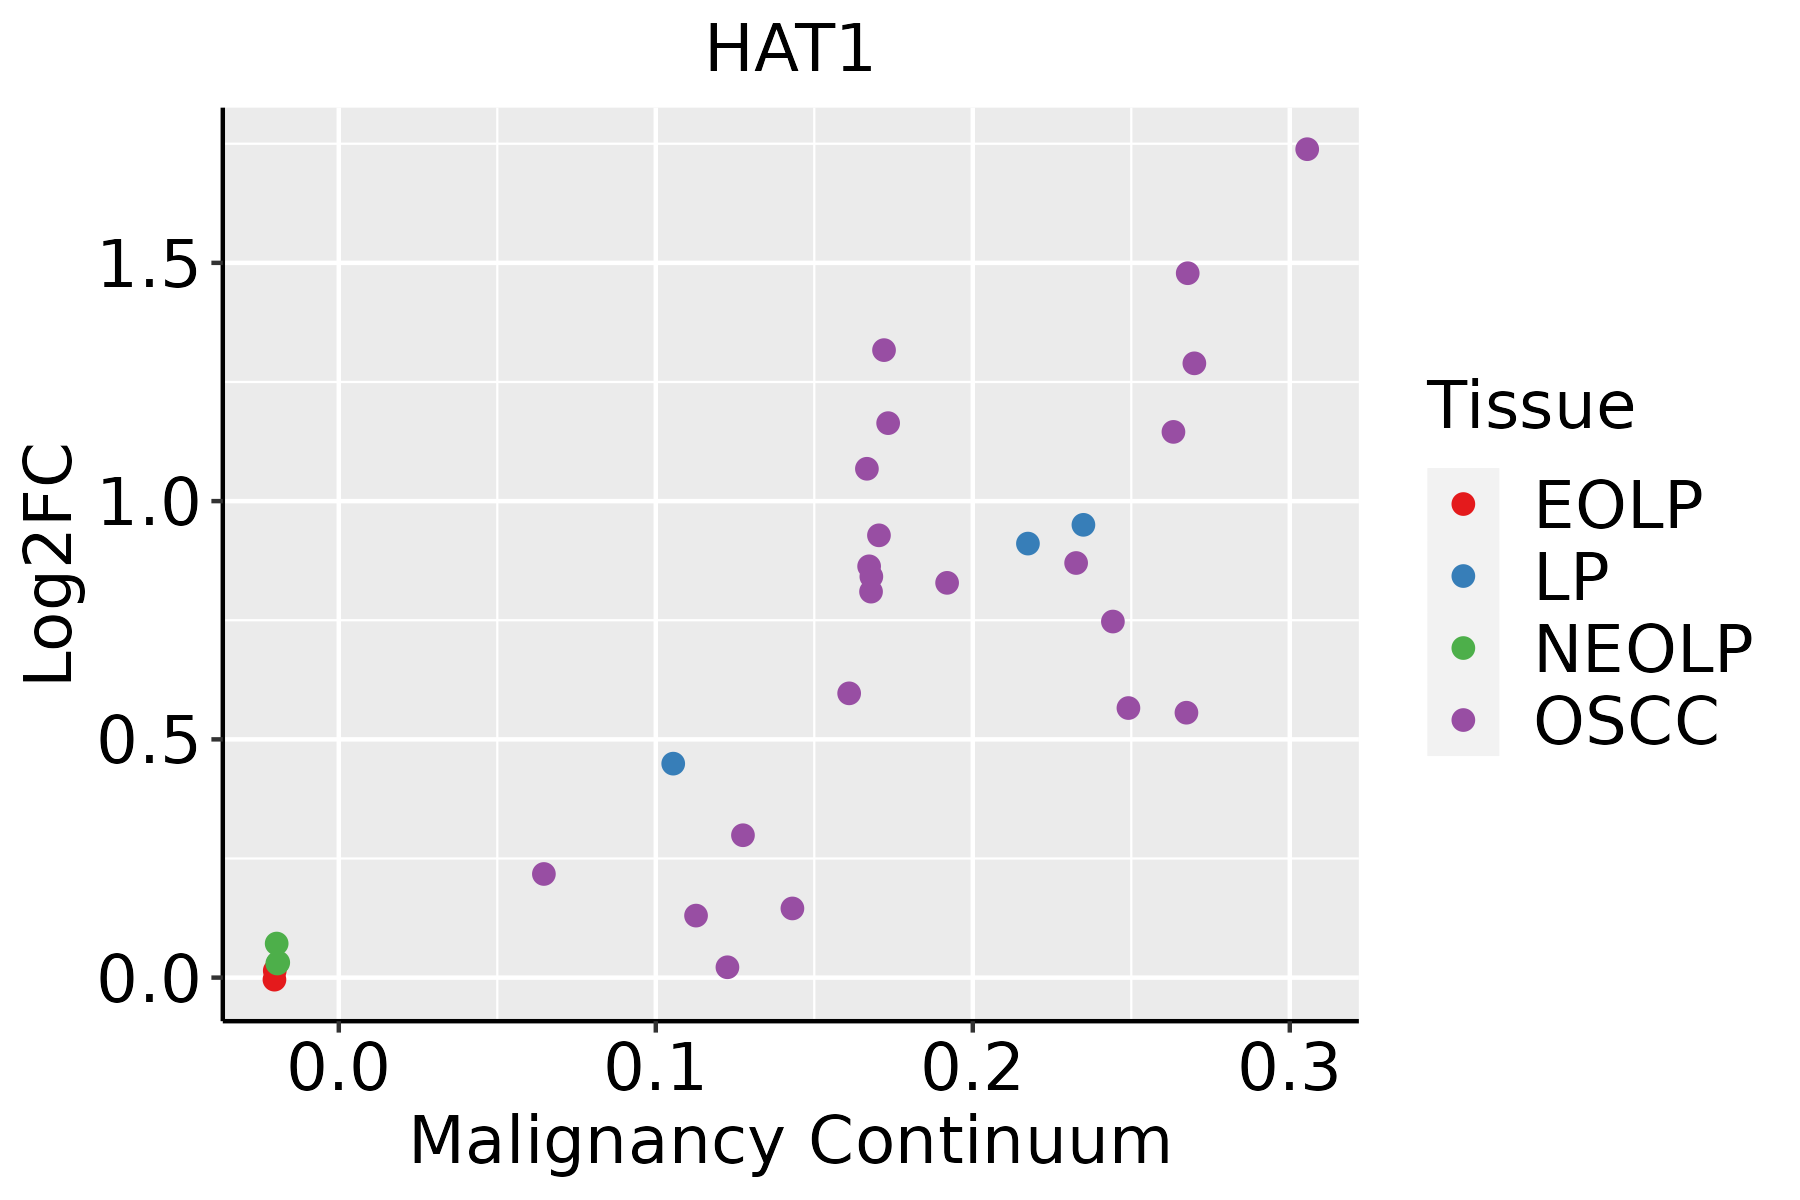 | EOLP: Erosive Oral lichen planus |
| LP: leukoplakia | ||
| NEOLP: Non-erosive oral lichen planus | ||
| OSCC: Oral squamous cell carcinoma | ||
| Skin | 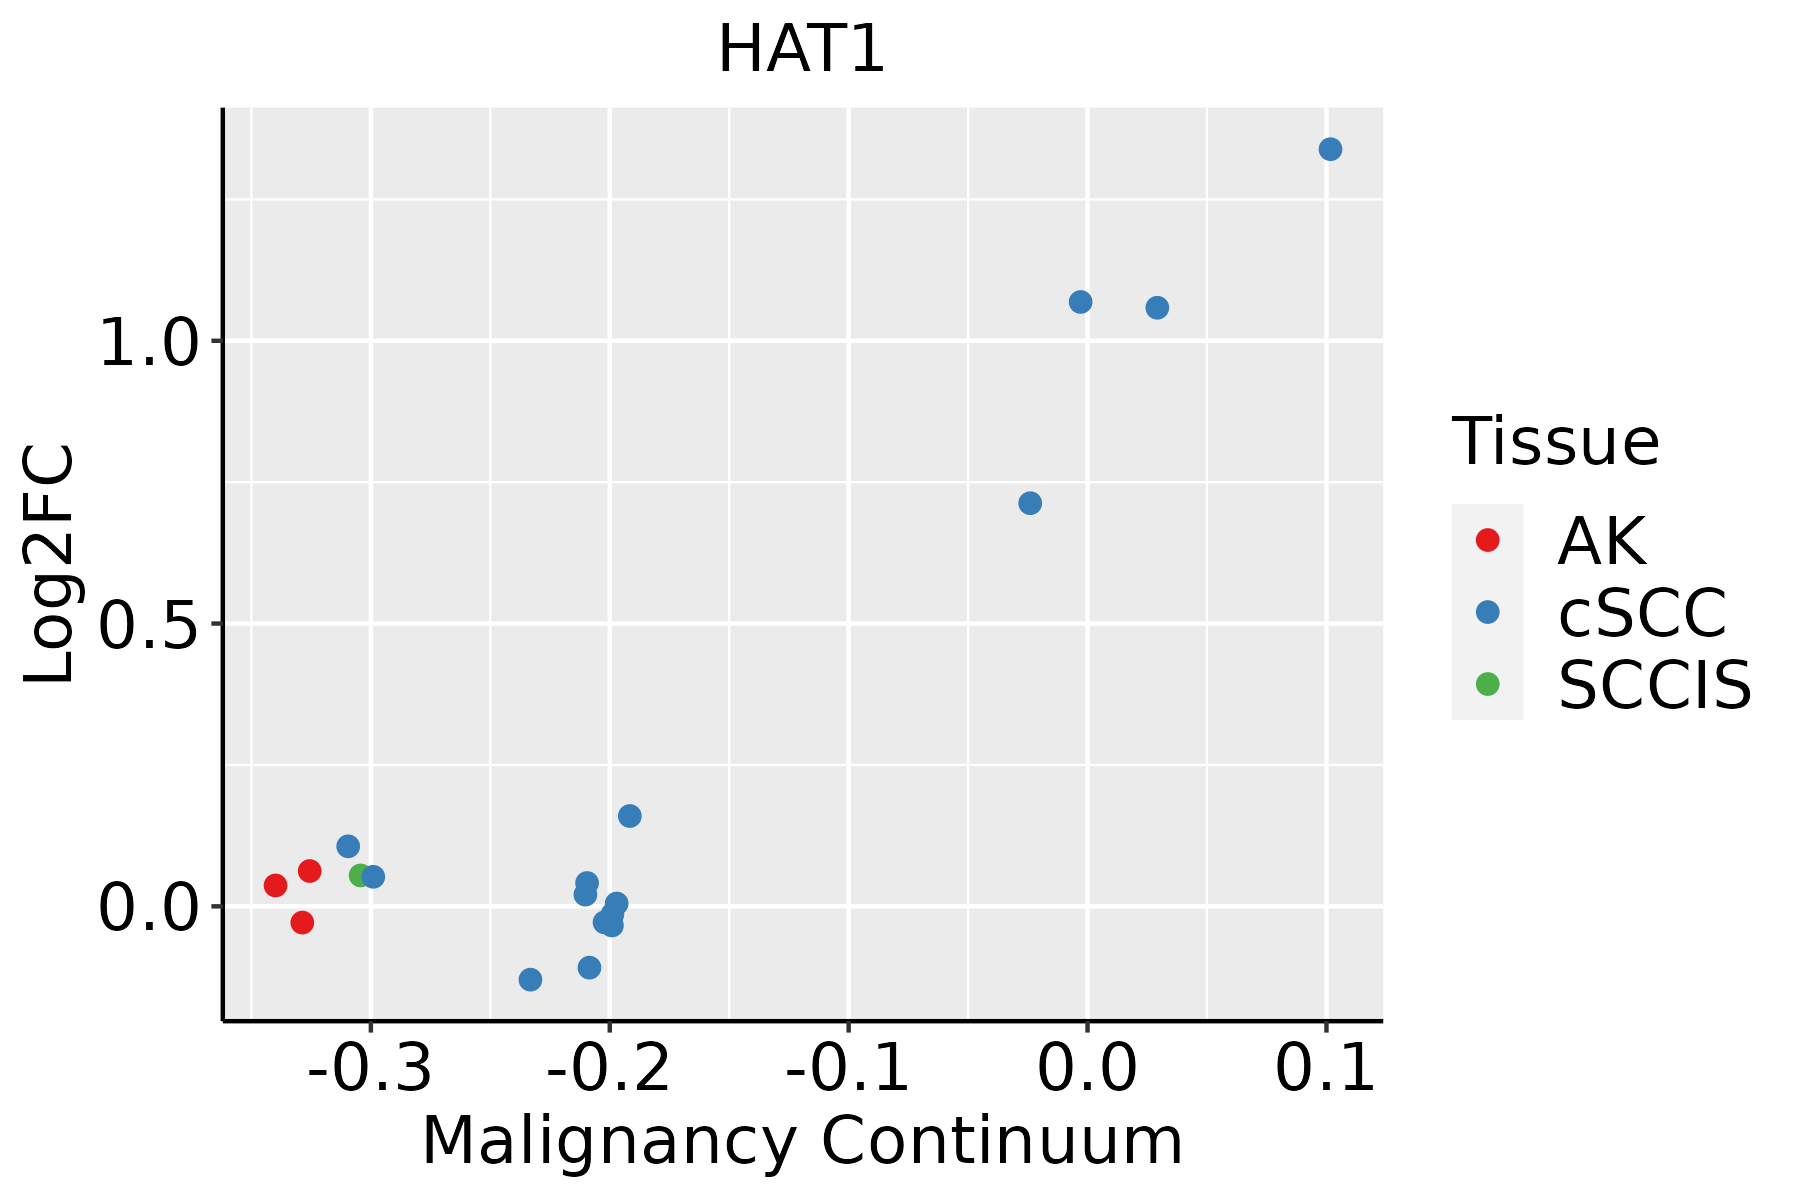 | AK: Actinic keratosis |
| cSCC: Cutaneous squamous cell carcinoma | ||
| SCCIS:squamous cell carcinoma in situ | ||
| Thyroid | 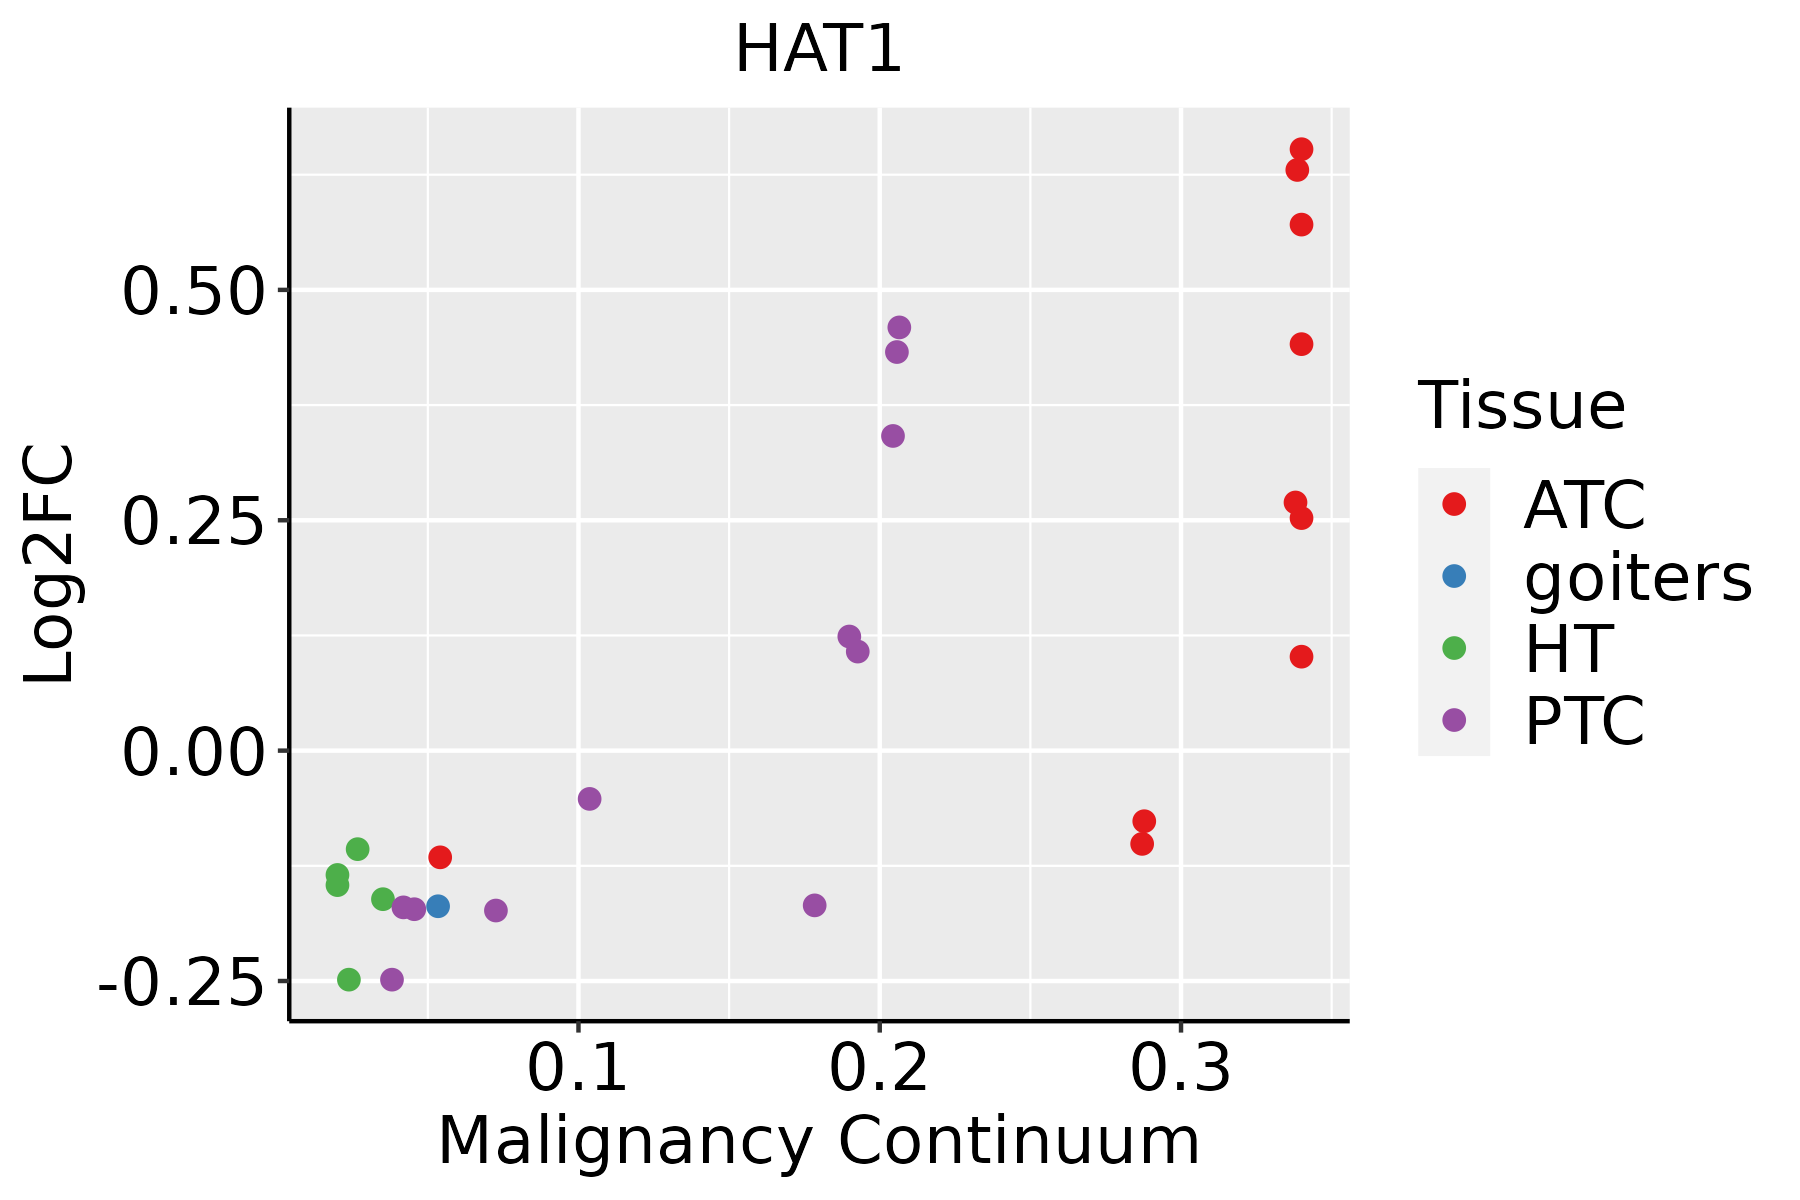 | ATC: Anaplastic thyroid cancer |
| HT: Hashimoto's thyroiditis | ||
| PTC: Papillary thyroid cancer |
| ∗log2FC in expression of this searched gene in stem-like cells from each diseased tissue sample relative to stem-like cells in normal samples in each tissue plotted against the malignancy continuum. Samples are colored based on if they are from different disease stage. |
Top |
Malignant transformation related pathway analysis |
| Find out the enriched GO biological processes and KEGG pathways involved in transition from healthy to precancer to cancer |
| Tissue | Disease Stage | Enriched GO biological Processes |
| Colorectum | AD |  |
| Colorectum | SER |  |
| Colorectum | MSS |  |
| Colorectum | MSI-H |  |
| Colorectum | FAP |  |
| ∗Top 15 enriched GO BP terms are showed in the bar plot of each disease state in each tissue. Each row represents a significant GO biological process which is colored according to the -log10(p.adjust). |
| Page: 1 2 3 4 5 6 7 8 9 |
| GO ID | Tissue | Disease Stage | Description | Gene Ratio | Bg Ratio | pvalue | p.adjust | Count |
| GO:001657015 | Esophagus | ESCC | histone modification | 323/8552 | 463/18723 | 2.61e-26 | 7.88e-24 | 323 |
| GO:001820514 | Esophagus | ESCC | peptidyl-lysine modification | 259/8552 | 376/18723 | 3.90e-20 | 5.26e-18 | 259 |
| GO:001839413 | Esophagus | ESCC | peptidyl-lysine acetylation | 123/8552 | 169/18723 | 6.58e-13 | 2.94e-11 | 123 |
| GO:004354313 | Esophagus | ESCC | protein acylation | 165/8552 | 243/18723 | 1.69e-12 | 7.14e-11 | 165 |
| GO:000647313 | Esophagus | ESCC | protein acetylation | 140/8552 | 201/18723 | 4.37e-12 | 1.69e-10 | 140 |
| GO:0031667111 | Esophagus | ESCC | response to nutrient levels | 289/8552 | 474/18723 | 9.25e-12 | 3.47e-10 | 289 |
| GO:001839313 | Esophagus | ESCC | internal peptidyl-lysine acetylation | 114/8552 | 158/18723 | 1.16e-11 | 4.24e-10 | 114 |
| GO:000647513 | Esophagus | ESCC | internal protein amino acid acetylation | 115/8552 | 160/18723 | 1.43e-11 | 5.08e-10 | 115 |
| GO:00165735 | Esophagus | ESCC | histone acetylation | 110/8552 | 152/18723 | 1.95e-11 | 6.81e-10 | 110 |
| GO:004396712 | Esophagus | ESCC | histone H4 acetylation | 53/8552 | 67/18723 | 2.11e-08 | 4.03e-07 | 53 |
| GO:000632517 | Esophagus | ESCC | chromatin organization | 240/8552 | 409/18723 | 6.52e-08 | 1.14e-06 | 240 |
| GO:000758410 | Esophagus | ESCC | response to nutrient | 114/8552 | 174/18723 | 9.43e-08 | 1.56e-06 | 114 |
| GO:003166712 | Liver | Cirrhotic | response to nutrient levels | 174/4634 | 474/18723 | 3.08e-09 | 1.27e-07 | 174 |
| GO:00064731 | Liver | Cirrhotic | protein acetylation | 84/4634 | 201/18723 | 7.50e-08 | 2.25e-06 | 84 |
| GO:00183941 | Liver | Cirrhotic | peptidyl-lysine acetylation | 73/4634 | 169/18723 | 1.08e-07 | 3.07e-06 | 73 |
| GO:00435431 | Liver | Cirrhotic | protein acylation | 95/4634 | 243/18723 | 4.73e-07 | 1.07e-05 | 95 |
| GO:00182051 | Liver | Cirrhotic | peptidyl-lysine modification | 134/4634 | 376/18723 | 1.29e-06 | 2.59e-05 | 134 |
| GO:00064751 | Liver | Cirrhotic | internal protein amino acid acetylation | 65/4634 | 160/18723 | 6.66e-06 | 1.04e-04 | 65 |
| GO:00183931 | Liver | Cirrhotic | internal peptidyl-lysine acetylation | 64/4634 | 158/18723 | 8.75e-06 | 1.29e-04 | 64 |
| GO:001657011 | Liver | Cirrhotic | histone modification | 154/4634 | 463/18723 | 1.92e-05 | 2.57e-04 | 154 |
| Page: 1 2 3 4 5 |
| Pathway ID | Tissue | Disease Stage | Description | Gene Ratio | Bg Ratio | pvalue | p.adjust | qvalue | Count |
| Page: 1 |
Top |
Cell-cell communication analysis |
| Identification of potential cell-cell interactions between two cell types and their ligand-receptor pairs for different disease states |
| Ligand | Receptor | LRpair | Pathway | Tissue | Disease Stage |
| Page: 1 |
Top |
Single-cell gene regulatory network inference analysis |
| Find out the significant the regulons (TFs) and the target genes of each regulon across cell types for different disease states |
| TF | Cell Type | Tissue | Disease Stage | Target Gene | RSS | Regulon Activity |
| ∗The dot plots of a searched regulon are shown for all cell subpopulations in each disease state of each tissue based on the regulon specific score inferred using pySCENIC and by calculating the average expression. |
| Page: 1 |
Top |
Somatic mutation of malignant transformation related genes |
| Annotation of somatic variants for genes involved in malignant transformation |
| Hugo Symbol | Variant Class | Variant Classification | dbSNP RS | HGVSc | HGVSp | HGVSp Short | SWISSPROT | BIOTYPE | SIFT | PolyPhen | Tumor Sample Barcode | Tissue | Histology | Sex | Age | Stage | Therapy Types | Drugs | Outcome |
| HAT1 | SNV | Missense_Mutation | c.1105G>C | p.Asp369His | p.D369H | O14929 | protein_coding | tolerated(0.08) | benign(0.136) | TCGA-BH-A18P-01 | Breast | breast invasive carcinoma | Female | <65 | I/II | Unknown | Unknown | PD | |
| HAT1 | SNV | Missense_Mutation | c.1026N>A | p.Met342Ile | p.M342I | O14929 | protein_coding | tolerated(0.71) | benign(0.031) | TCGA-EK-A2PM-01 | Cervix | cervical & endocervical cancer | Female | >=65 | I/II | Unknown | Unknown | SD | |
| HAT1 | SNV | Missense_Mutation | c.1119N>A | p.Met373Ile | p.M373I | O14929 | protein_coding | tolerated(0.16) | benign(0.005) | TCGA-JW-A5VL-01 | Cervix | cervical & endocervical cancer | Female | <65 | I/II | Unknown | Unknown | SD | |
| HAT1 | SNV | Missense_Mutation | c.106A>C | p.Lys36Gln | p.K36Q | O14929 | protein_coding | deleterious(0) | possibly_damaging(0.901) | TCGA-AA-3510-01 | Colorectum | colon adenocarcinoma | Male | >=65 | I/II | Unknown | Unknown | SD | |
| HAT1 | SNV | Missense_Mutation | novel | c.407T>C | p.Phe136Ser | p.F136S | O14929 | protein_coding | deleterious(0) | probably_damaging(0.998) | TCGA-AA-3510-01 | Colorectum | colon adenocarcinoma | Male | >=65 | I/II | Unknown | Unknown | SD |
| HAT1 | SNV | Missense_Mutation | c.1172N>C | p.Ile391Thr | p.I391T | O14929 | protein_coding | tolerated(0.58) | benign(0.003) | TCGA-AA-3672-01 | Colorectum | colon adenocarcinoma | Female | >=65 | III/IV | Unknown | Unknown | SD | |
| HAT1 | SNV | Missense_Mutation | c.569N>C | p.Ser190Thr | p.S190T | O14929 | protein_coding | deleterious(0.04) | possibly_damaging(0.569) | TCGA-AY-6386-01 | Colorectum | colon adenocarcinoma | Female | >=65 | III/IV | Chemotherapy | 5-fu | SD | |
| HAT1 | SNV | Missense_Mutation | c.758G>A | p.Gly253Asp | p.G253D | O14929 | protein_coding | deleterious(0.01) | probably_damaging(0.998) | TCGA-F4-6703-01 | Colorectum | colon adenocarcinoma | Male | <65 | I/II | Unknown | Unknown | SD | |
| HAT1 | SNV | Missense_Mutation | novel | c.24N>T | p.Glu8Asp | p.E8D | O14929 | protein_coding | tolerated_low_confidence(0.27) | benign(0.056) | TCGA-AG-A002-01 | Colorectum | rectum adenocarcinoma | Male | <65 | I/II | Unknown | Unknown | SD |
| HAT1 | insertion | Frame_Shift_Ins | novel | c.143_144insATTCC | p.Arg49PhefsTer26 | p.R49Ffs*26 | O14929 | protein_coding | TCGA-AM-5820-01 | Colorectum | colon adenocarcinoma | Female | <65 | I/II | Unknown | Unknown | SD |
| Page: 1 2 3 4 5 |
Top |
Related drugs of malignant transformation related genes |
| Identification of chemicals and drugs interact with genes involved in malignant transfromation |
| (DGIdb 4.0) |
| Entrez ID | Symbol | Category | Interaction Types | Drug Claim Name | Drug Name | PMIDs |
| Page: 1 |

Copyright 2023-Present -The University of Texas Health Science Center at Houston |