
|
|||||
|
 | |
| |
| |
| |
| |
| |
|
Gene: HARS2 |
Gene summary for HARS2 |
| Gene information | Species | Human | Gene symbol | HARS2 | Gene ID | 23438 |
| Gene name | histidyl-tRNA synthetase 2, mitochondrial | |
| Gene Alias | HARSL | |
| Cytomap | 5q31.3 | |
| Gene Type | protein-coding | GO ID | GO:0006082 | UniProtAcc | P49590 |
Top |
Malignant transformation analysis |
| Identification of the aberrant gene expression in precancerous and cancerous lesions by comparing the gene expression of stem-like cells in diseased tissues with normal stem cells |
| Entrez ID | Symbol | Replicates | Species | Organ | Tissue | Adj P-value | Log2FC | Malignancy |
| 23438 | HARS2 | LZE4T | Human | Esophagus | ESCC | 1.71e-03 | 1.41e-01 | 0.0811 |
| 23438 | HARS2 | LZE8T | Human | Esophagus | ESCC | 3.40e-02 | 1.03e-01 | 0.067 |
| 23438 | HARS2 | LZE24T | Human | Esophagus | ESCC | 5.07e-08 | 2.57e-01 | 0.0596 |
| 23438 | HARS2 | P1T-E | Human | Esophagus | ESCC | 3.71e-04 | 2.89e-01 | 0.0875 |
| 23438 | HARS2 | P2T-E | Human | Esophagus | ESCC | 1.62e-08 | 2.42e-01 | 0.1177 |
| 23438 | HARS2 | P4T-E | Human | Esophagus | ESCC | 4.20e-09 | 2.44e-01 | 0.1323 |
| 23438 | HARS2 | P5T-E | Human | Esophagus | ESCC | 9.30e-11 | 2.08e-01 | 0.1327 |
| 23438 | HARS2 | P8T-E | Human | Esophagus | ESCC | 8.75e-09 | 1.51e-01 | 0.0889 |
| 23438 | HARS2 | P9T-E | Human | Esophagus | ESCC | 1.96e-04 | 2.06e-01 | 0.1131 |
| 23438 | HARS2 | P10T-E | Human | Esophagus | ESCC | 5.10e-07 | 1.13e-01 | 0.116 |
| 23438 | HARS2 | P11T-E | Human | Esophagus | ESCC | 3.11e-15 | 5.78e-01 | 0.1426 |
| 23438 | HARS2 | P12T-E | Human | Esophagus | ESCC | 4.57e-22 | 3.93e-01 | 0.1122 |
| 23438 | HARS2 | P15T-E | Human | Esophagus | ESCC | 1.03e-09 | 1.95e-01 | 0.1149 |
| 23438 | HARS2 | P16T-E | Human | Esophagus | ESCC | 3.44e-14 | 1.93e-01 | 0.1153 |
| 23438 | HARS2 | P17T-E | Human | Esophagus | ESCC | 2.19e-02 | 1.33e-01 | 0.1278 |
| 23438 | HARS2 | P20T-E | Human | Esophagus | ESCC | 7.32e-19 | 4.92e-01 | 0.1124 |
| 23438 | HARS2 | P21T-E | Human | Esophagus | ESCC | 3.44e-11 | 2.49e-01 | 0.1617 |
| 23438 | HARS2 | P22T-E | Human | Esophagus | ESCC | 1.71e-18 | 3.52e-01 | 0.1236 |
| 23438 | HARS2 | P23T-E | Human | Esophagus | ESCC | 1.00e-07 | 2.42e-01 | 0.108 |
| 23438 | HARS2 | P24T-E | Human | Esophagus | ESCC | 1.42e-08 | 1.92e-01 | 0.1287 |
| Page: 1 2 3 4 |
| Tissue | Expression Dynamics | Abbreviation |
| Esophagus | 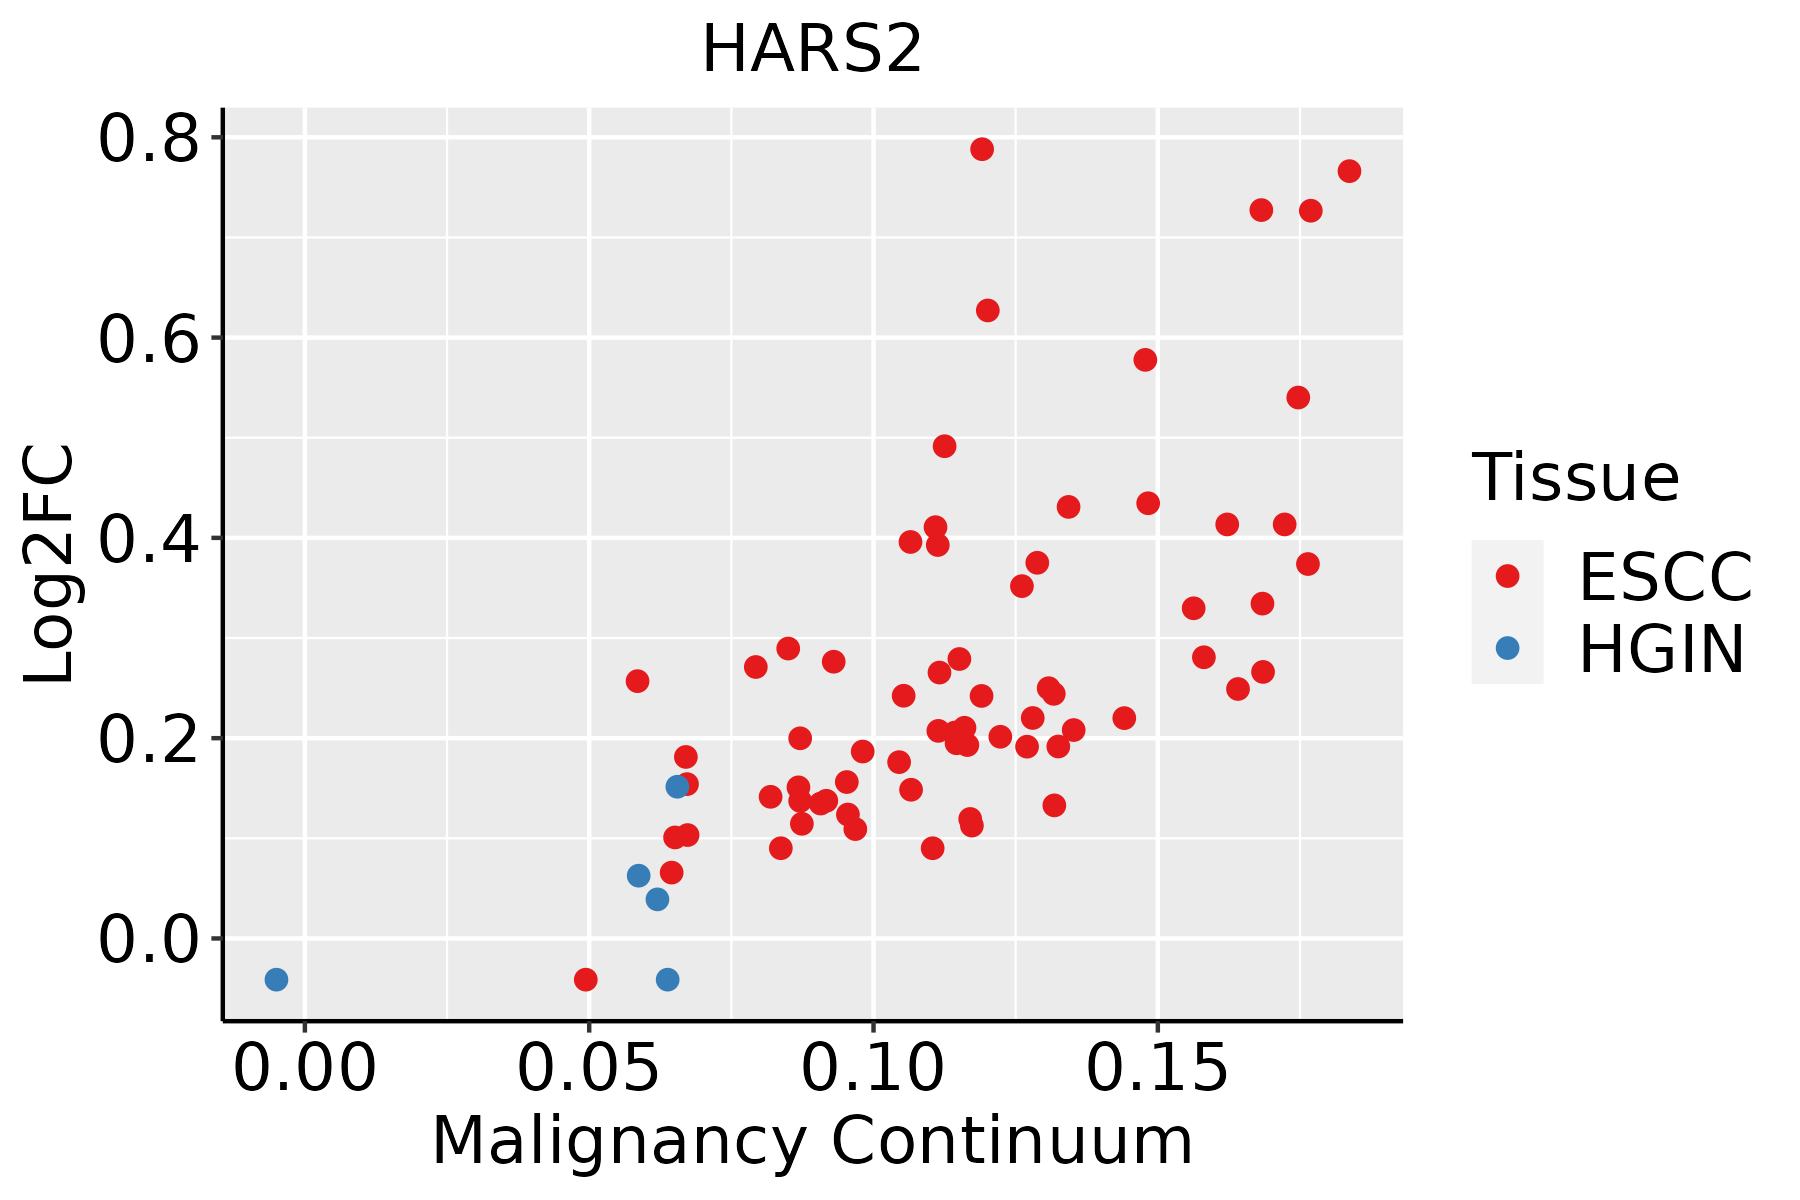 | ESCC: Esophageal squamous cell carcinoma |
| HGIN: High-grade intraepithelial neoplasias | ||
| LGIN: Low-grade intraepithelial neoplasias | ||
| Oral Cavity | 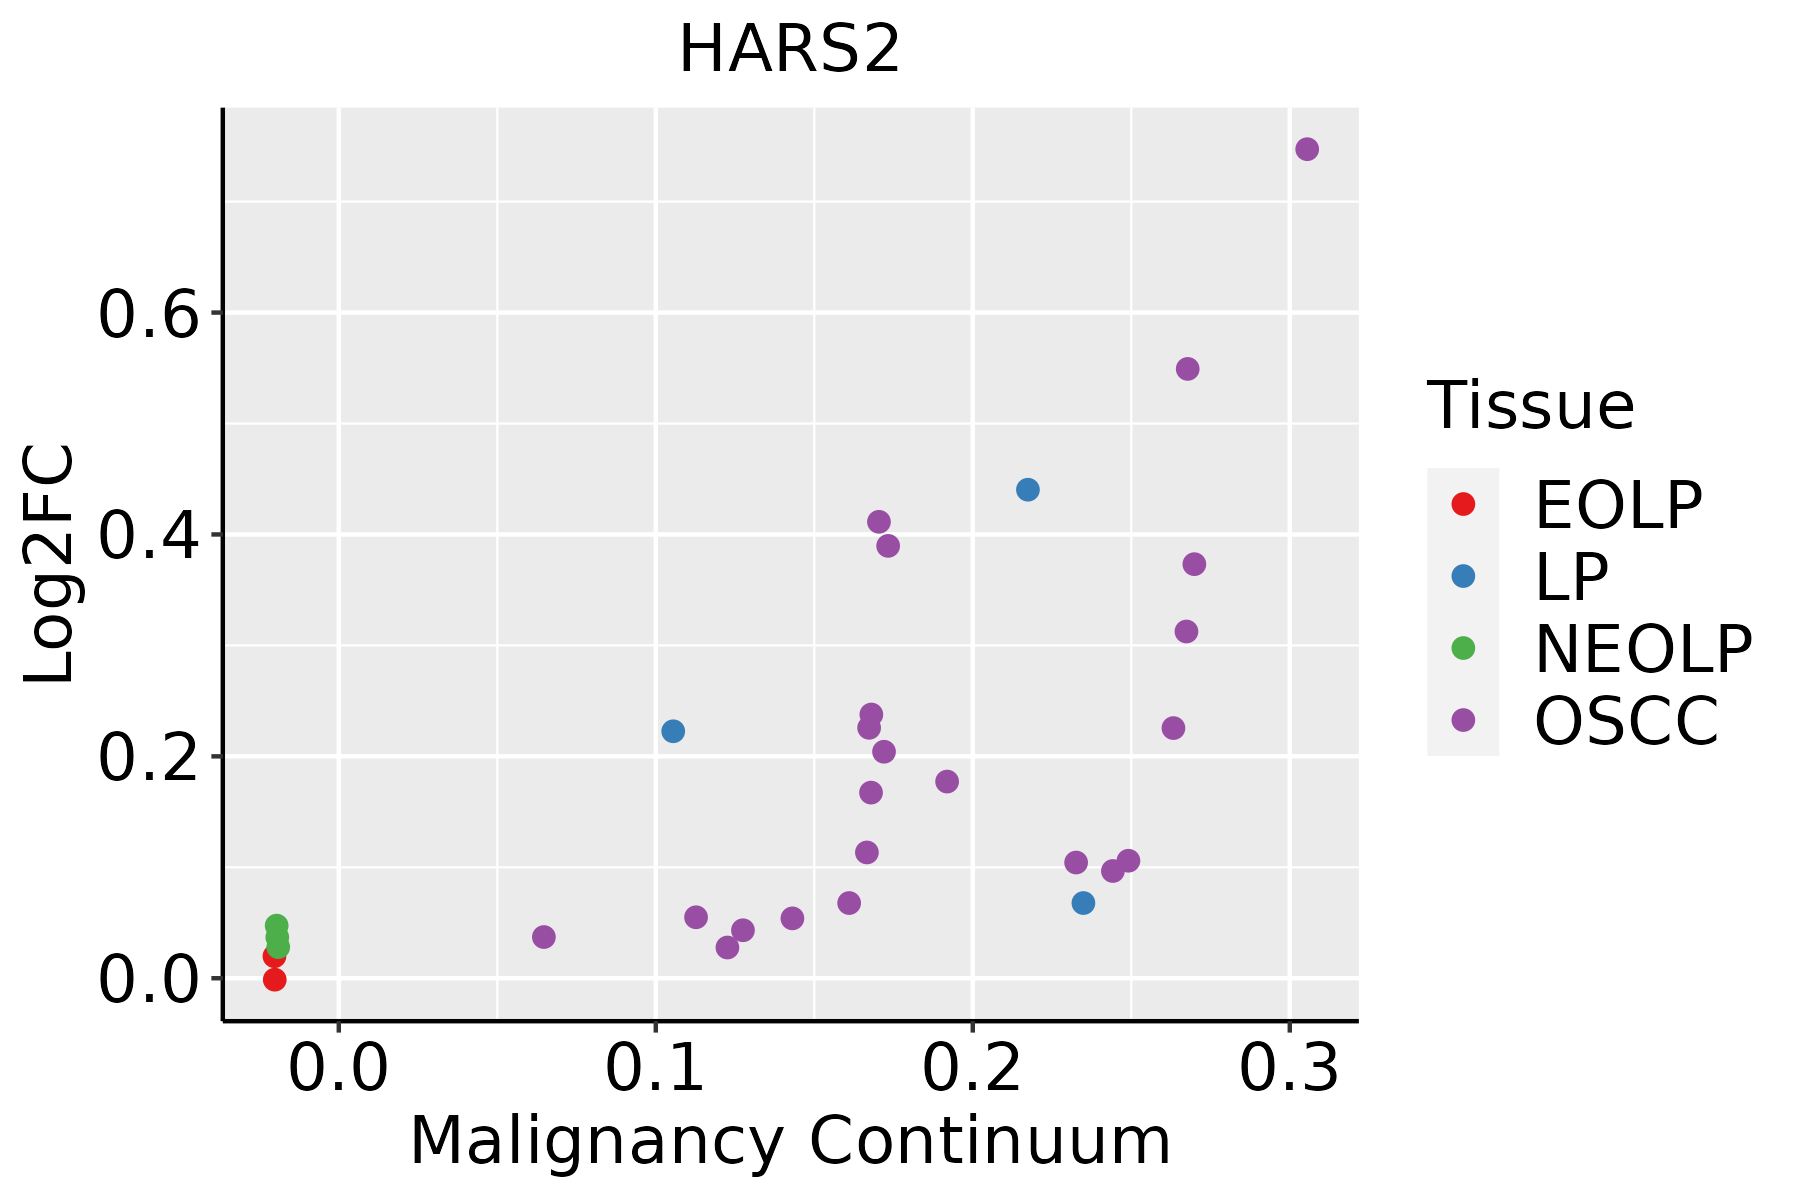 | EOLP: Erosive Oral lichen planus |
| LP: leukoplakia | ||
| NEOLP: Non-erosive oral lichen planus | ||
| OSCC: Oral squamous cell carcinoma | ||
| Thyroid | 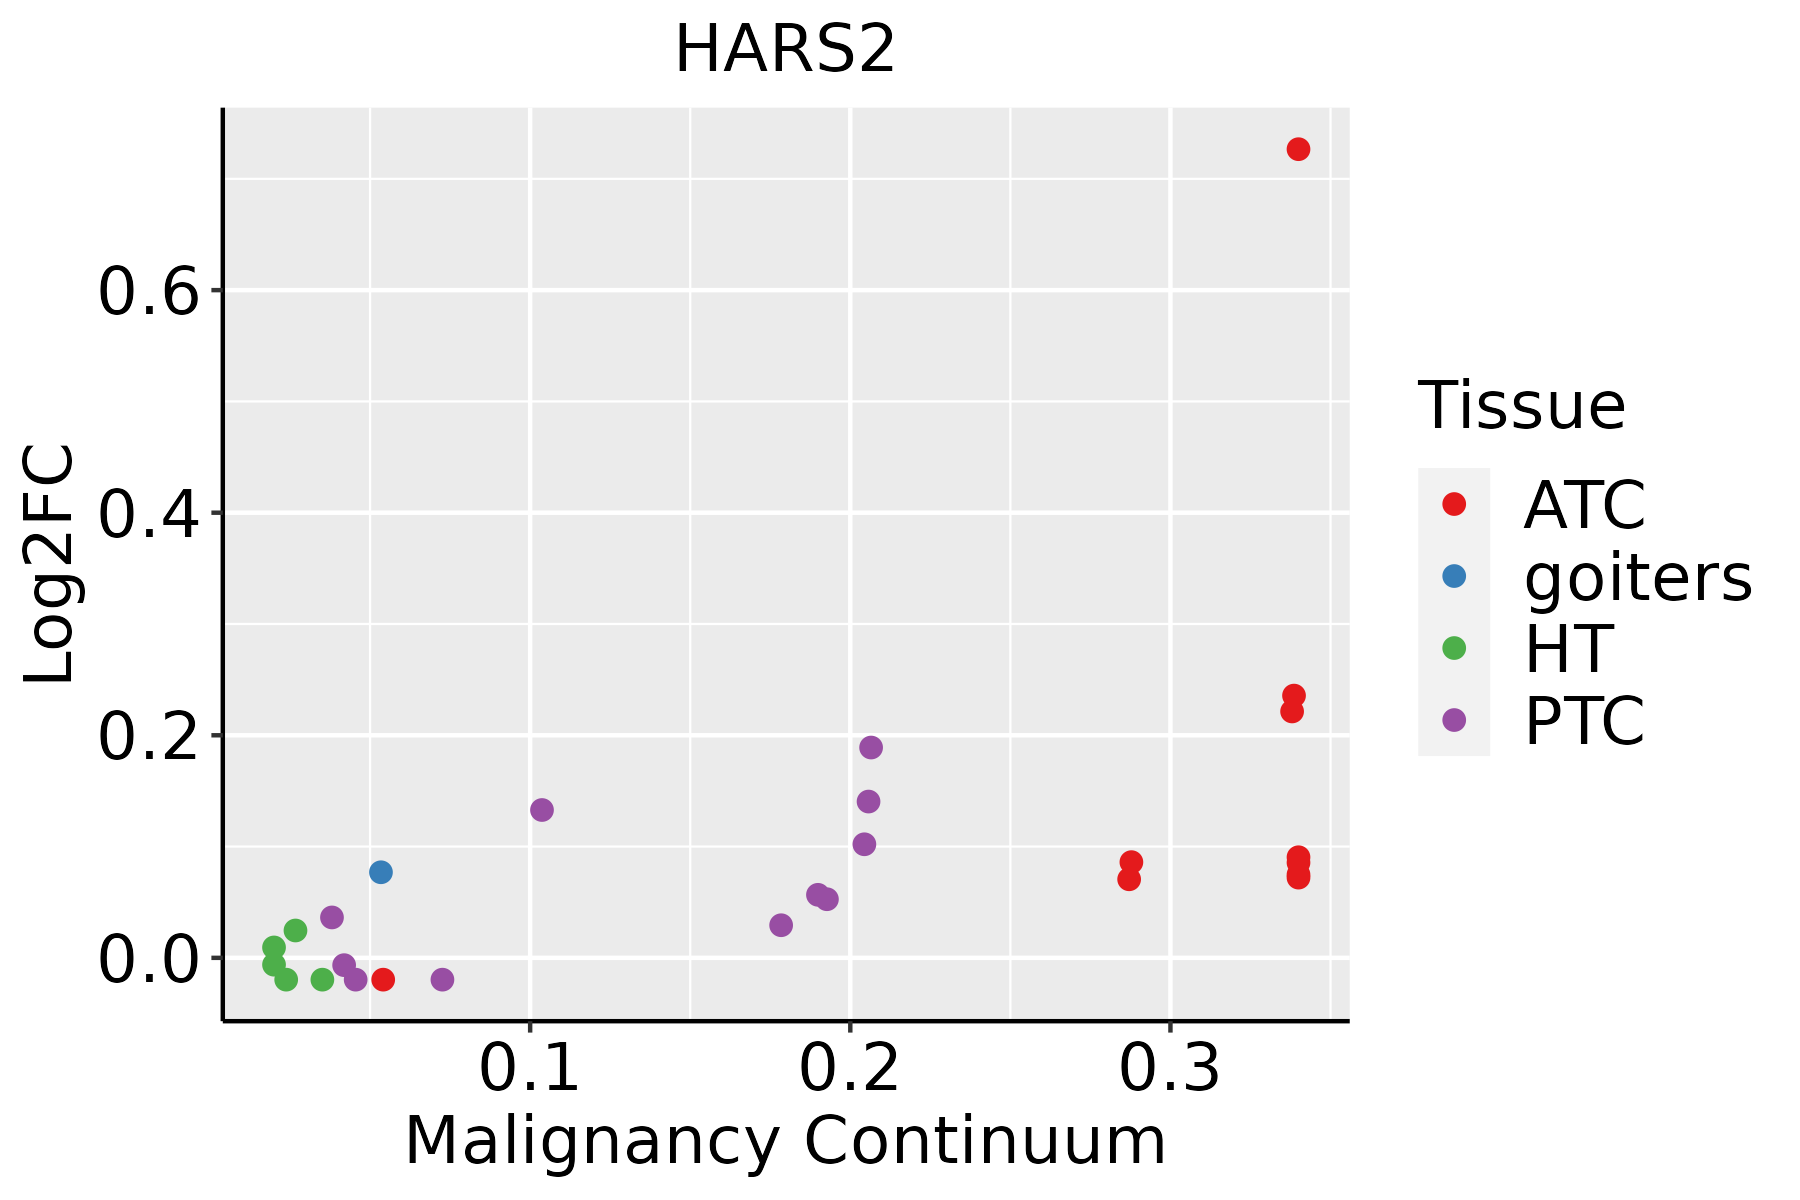 | ATC: Anaplastic thyroid cancer |
| HT: Hashimoto's thyroiditis | ||
| PTC: Papillary thyroid cancer |
| ∗log2FC in expression of this searched gene in stem-like cells from each diseased tissue sample relative to stem-like cells in normal samples in each tissue plotted against the malignancy continuum. Samples are colored based on if they are from different disease stage. |
Top |
Malignant transformation related pathway analysis |
| Find out the enriched GO biological processes and KEGG pathways involved in transition from healthy to precancer to cancer |
| Tissue | Disease Stage | Enriched GO biological Processes |
| Colorectum | AD |  |
| Colorectum | SER |  |
| Colorectum | MSS |  |
| Colorectum | MSI-H |  |
| Colorectum | FAP |  |
| ∗Top 15 enriched GO BP terms are showed in the bar plot of each disease state in each tissue. Each row represents a significant GO biological process which is colored according to the -log10(p.adjust). |
| Page: 1 2 3 4 5 6 7 8 9 |
| GO ID | Tissue | Disease Stage | Description | Gene Ratio | Bg Ratio | pvalue | p.adjust | Count |
| GO:003466012 | Esophagus | ESCC | ncRNA metabolic process | 346/8552 | 485/18723 | 4.35e-31 | 2.51e-28 | 346 |
| GO:00063992 | Esophagus | ESCC | tRNA metabolic process | 122/8552 | 179/18723 | 9.03e-10 | 2.19e-08 | 122 |
| GO:00346605 | Oral cavity | OSCC | ncRNA metabolic process | 296/7305 | 485/18723 | 2.94e-23 | 6.65e-21 | 296 |
| GO:00063991 | Oral cavity | OSCC | tRNA metabolic process | 101/7305 | 179/18723 | 1.65e-06 | 2.15e-05 | 101 |
| GO:00346608 | Thyroid | PTC | ncRNA metabolic process | 239/5968 | 485/18723 | 5.54e-16 | 4.26e-14 | 239 |
| GO:003466021 | Thyroid | ATC | ncRNA metabolic process | 240/6293 | 485/18723 | 2.03e-13 | 9.91e-12 | 240 |
| Page: 1 |
| Pathway ID | Tissue | Disease Stage | Description | Gene Ratio | Bg Ratio | pvalue | p.adjust | qvalue | Count |
| Page: 1 |
Top |
Cell-cell communication analysis |
| Identification of potential cell-cell interactions between two cell types and their ligand-receptor pairs for different disease states |
| Ligand | Receptor | LRpair | Pathway | Tissue | Disease Stage |
| Page: 1 |
Top |
Single-cell gene regulatory network inference analysis |
| Find out the significant the regulons (TFs) and the target genes of each regulon across cell types for different disease states |
| TF | Cell Type | Tissue | Disease Stage | Target Gene | RSS | Regulon Activity |
| ∗The dot plots of a searched regulon are shown for all cell subpopulations in each disease state of each tissue based on the regulon specific score inferred using pySCENIC and by calculating the average expression. |
| Page: 1 |
Top |
Somatic mutation of malignant transformation related genes |
| Annotation of somatic variants for genes involved in malignant transformation |
| Hugo Symbol | Variant Class | Variant Classification | dbSNP RS | HGVSc | HGVSp | HGVSp Short | SWISSPROT | BIOTYPE | SIFT | PolyPhen | Tumor Sample Barcode | Tissue | Histology | Sex | Age | Stage | Therapy Types | Drugs | Outcome |
| HARS2 | SNV | Missense_Mutation | novel | c.1307N>T | p.Gly436Val | p.G436V | P49590 | protein_coding | deleterious(0) | probably_damaging(0.998) | TCGA-AO-A0JC-01 | Breast | breast invasive carcinoma | Female | <65 | I/II | Chemotherapy | fluorouracil | SD |
| HARS2 | SNV | Missense_Mutation | novel | c.41N>T | p.Ser14Leu | p.S14L | P49590 | protein_coding | deleterious(0.04) | benign(0.003) | TCGA-OL-A5RW-01 | Breast | breast invasive carcinoma | Female | <65 | I/II | Chemotherapy | adriamycin | CR |
| HARS2 | SNV | Missense_Mutation | c.1459G>A | p.Glu487Lys | p.E487K | P49590 | protein_coding | deleterious(0.02) | probably_damaging(1) | TCGA-EA-A6QX-01 | Cervix | cervical & endocervical cancer | Female | <65 | III/IV | Unknown | Unknown | SD | |
| HARS2 | insertion | Frame_Shift_Ins | novel | c.502_503insTAGCA | p.Arg168LeufsTer21 | p.R168Lfs*21 | P49590 | protein_coding | TCGA-DS-A1OC-01 | Cervix | cervical & endocervical cancer | Female | <65 | I/II | Chemotherapy | gemcitabine | SD | ||
| HARS2 | SNV | Missense_Mutation | novel | c.926N>G | p.Tyr309Cys | p.Y309C | P49590 | protein_coding | deleterious(0) | benign(0.275) | TCGA-AA-3984-01 | Colorectum | colon adenocarcinoma | Female | <65 | I/II | Unknown | Unknown | SD |
| HARS2 | SNV | Missense_Mutation | c.153N>T | p.Glu51Asp | p.E51D | P49590 | protein_coding | tolerated(0.43) | benign(0.071) | TCGA-CA-6717-01 | Colorectum | colon adenocarcinoma | Male | <65 | I/II | Chemotherapy | oxaliplatin | CR | |
| HARS2 | SNV | Missense_Mutation | c.118G>A | p.Ala40Thr | p.A40T | P49590 | protein_coding | tolerated(0.54) | benign(0.024) | TCGA-CK-4951-01 | Colorectum | colon adenocarcinoma | Female | >=65 | I/II | Unknown | Unknown | PD | |
| HARS2 | SNV | Missense_Mutation | c.175A>C | p.Thr59Pro | p.T59P | P49590 | protein_coding | deleterious(0.01) | benign(0.043) | TCGA-D5-6540-01 | Colorectum | colon adenocarcinoma | Male | >=65 | I/II | Unknown | Unknown | SD | |
| HARS2 | SNV | Missense_Mutation | c.1087N>T | p.Arg363Cys | p.R363C | P49590 | protein_coding | deleterious(0) | probably_damaging(1) | TCGA-D5-6928-01 | Colorectum | colon adenocarcinoma | Male | >=65 | I/II | Unknown | Unknown | SD | |
| HARS2 | SNV | Missense_Mutation | novel | c.1300G>A | p.Asp434Asn | p.D434N | P49590 | protein_coding | tolerated(0.28) | benign(0.097) | TCGA-AG-A002-01 | Colorectum | rectum adenocarcinoma | Male | <65 | I/II | Unknown | Unknown | SD |
| Page: 1 2 3 4 5 |
Top |
Related drugs of malignant transformation related genes |
| Identification of chemicals and drugs interact with genes involved in malignant transfromation |
| (DGIdb 4.0) |
| Entrez ID | Symbol | Category | Interaction Types | Drug Claim Name | Drug Name | PMIDs |
| Page: 1 |

Copyright 2023-Present -The University of Texas Health Science Center at Houston |