
|
|||||
|
 | |
| |
| |
| |
| |
| |
|
Gene: HARS |
Gene summary for HARS |
| Gene information | Species | Human | Gene symbol | HARS | Gene ID | 3035 |
| Gene name | histidyl-tRNA synthetase 1 | |
| Gene Alias | CMT2W | |
| Cytomap | 5q31.3 | |
| Gene Type | protein-coding | GO ID | GO:0006082 | UniProtAcc | P12081 |
Top |
Malignant transformation analysis |
| Identification of the aberrant gene expression in precancerous and cancerous lesions by comparing the gene expression of stem-like cells in diseased tissues with normal stem cells |
| Entrez ID | Symbol | Replicates | Species | Organ | Tissue | Adj P-value | Log2FC | Malignancy |
| 3035 | HARS | LZE4T | Human | Esophagus | ESCC | 4.86e-11 | 2.87e-01 | 0.0811 |
| 3035 | HARS | LZE8T | Human | Esophagus | ESCC | 4.50e-05 | 2.09e-01 | 0.067 |
| 3035 | HARS | LZE24T | Human | Esophagus | ESCC | 2.31e-10 | 2.63e-01 | 0.0596 |
| 3035 | HARS | LZE6T | Human | Esophagus | ESCC | 2.43e-05 | 3.23e-01 | 0.0845 |
| 3035 | HARS | P1T-E | Human | Esophagus | ESCC | 1.94e-06 | 2.02e-01 | 0.0875 |
| 3035 | HARS | P2T-E | Human | Esophagus | ESCC | 1.91e-32 | 5.61e-01 | 0.1177 |
| 3035 | HARS | P4T-E | Human | Esophagus | ESCC | 4.09e-22 | 3.74e-01 | 0.1323 |
| 3035 | HARS | P5T-E | Human | Esophagus | ESCC | 1.13e-18 | 4.09e-01 | 0.1327 |
| 3035 | HARS | P8T-E | Human | Esophagus | ESCC | 6.99e-12 | 2.10e-01 | 0.0889 |
| 3035 | HARS | P9T-E | Human | Esophagus | ESCC | 1.03e-16 | 2.85e-01 | 0.1131 |
| 3035 | HARS | P10T-E | Human | Esophagus | ESCC | 3.72e-17 | 2.28e-01 | 0.116 |
| 3035 | HARS | P11T-E | Human | Esophagus | ESCC | 1.83e-29 | 8.89e-01 | 0.1426 |
| 3035 | HARS | P12T-E | Human | Esophagus | ESCC | 1.26e-30 | 6.64e-01 | 0.1122 |
| 3035 | HARS | P15T-E | Human | Esophagus | ESCC | 4.61e-23 | 4.07e-01 | 0.1149 |
| 3035 | HARS | P16T-E | Human | Esophagus | ESCC | 7.45e-24 | 3.12e-01 | 0.1153 |
| 3035 | HARS | P17T-E | Human | Esophagus | ESCC | 8.72e-10 | 5.86e-01 | 0.1278 |
| 3035 | HARS | P19T-E | Human | Esophagus | ESCC | 3.00e-07 | 7.50e-01 | 0.1662 |
| 3035 | HARS | P20T-E | Human | Esophagus | ESCC | 1.90e-30 | 6.89e-01 | 0.1124 |
| 3035 | HARS | P21T-E | Human | Esophagus | ESCC | 9.73e-29 | 5.63e-01 | 0.1617 |
| 3035 | HARS | P22T-E | Human | Esophagus | ESCC | 9.04e-27 | 5.18e-01 | 0.1236 |
| Page: 1 2 3 4 5 6 |
| Tissue | Expression Dynamics | Abbreviation |
| Esophagus | 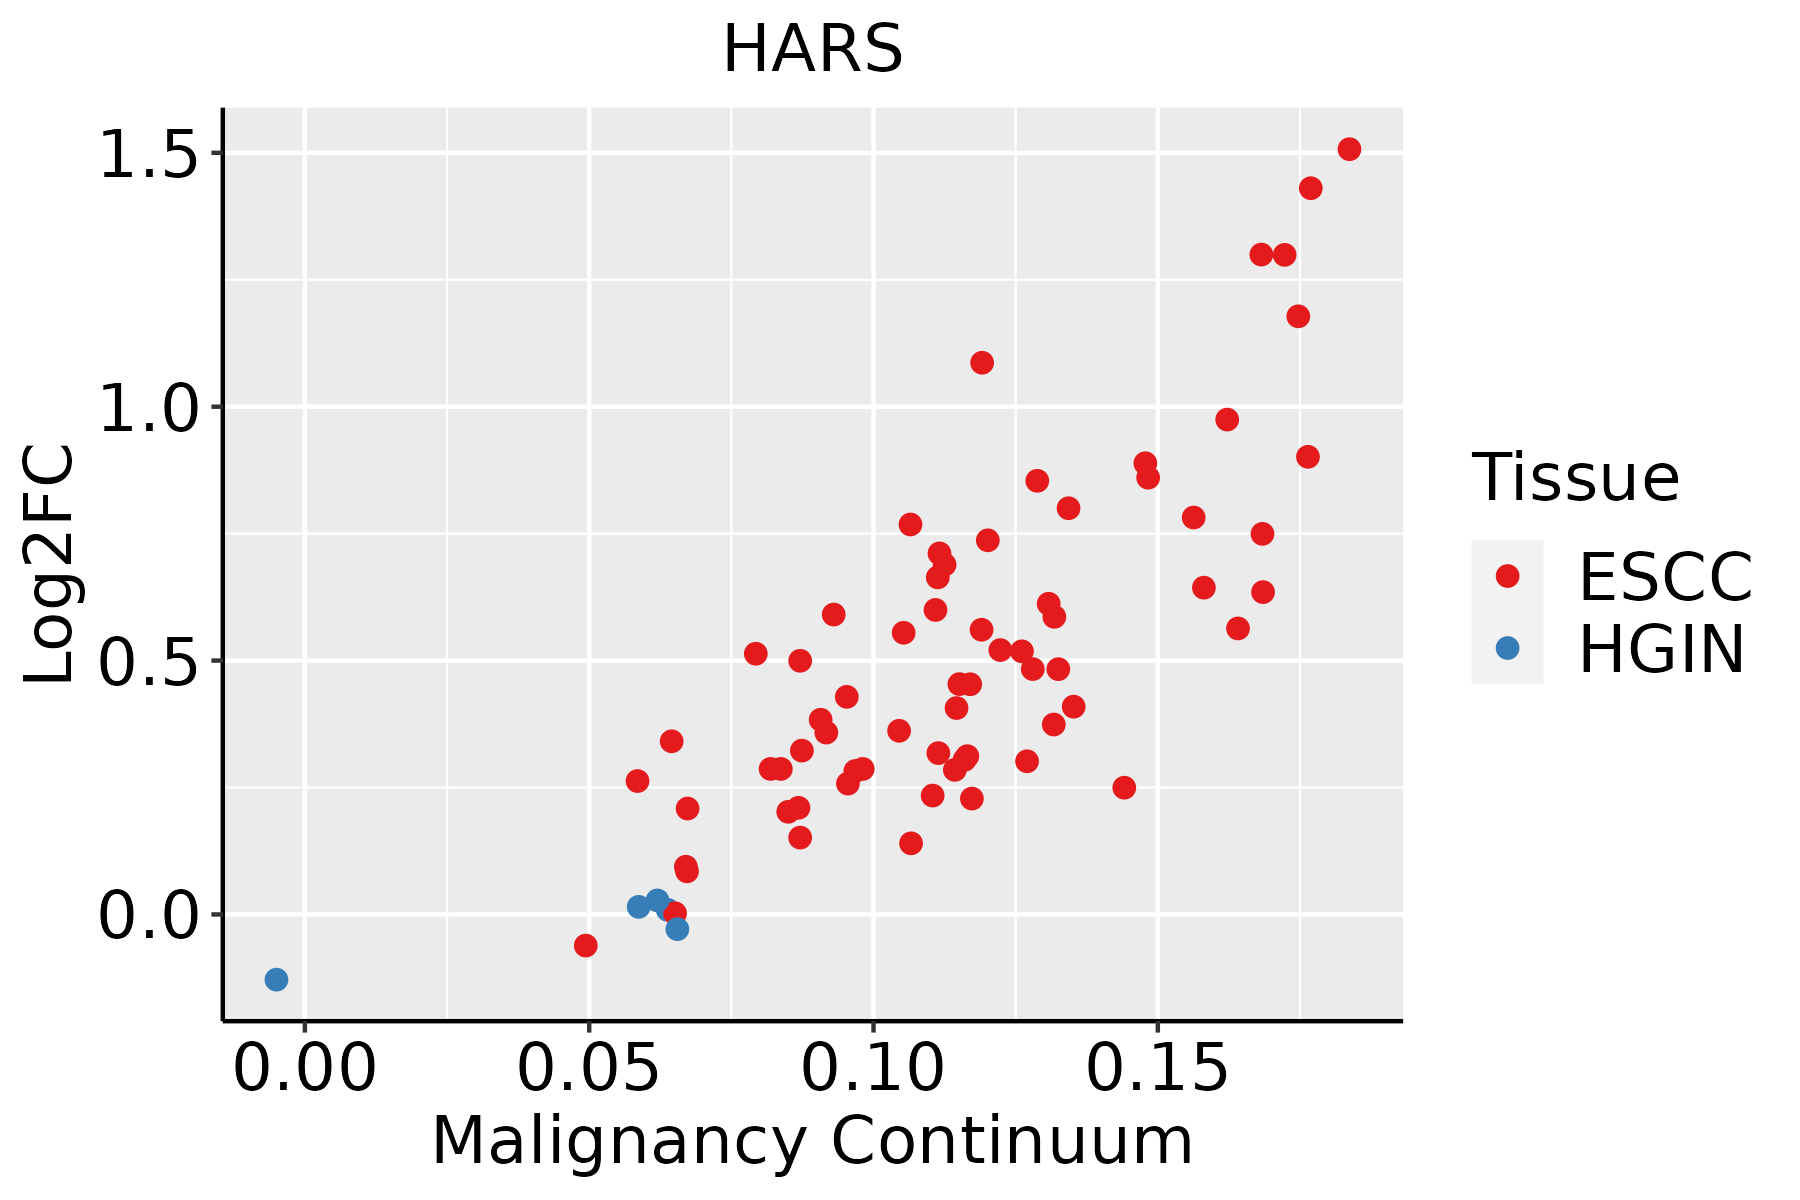 | ESCC: Esophageal squamous cell carcinoma |
| HGIN: High-grade intraepithelial neoplasias | ||
| LGIN: Low-grade intraepithelial neoplasias | ||
| Liver |  | HCC: Hepatocellular carcinoma |
| NAFLD: Non-alcoholic fatty liver disease | ||
| Oral Cavity | 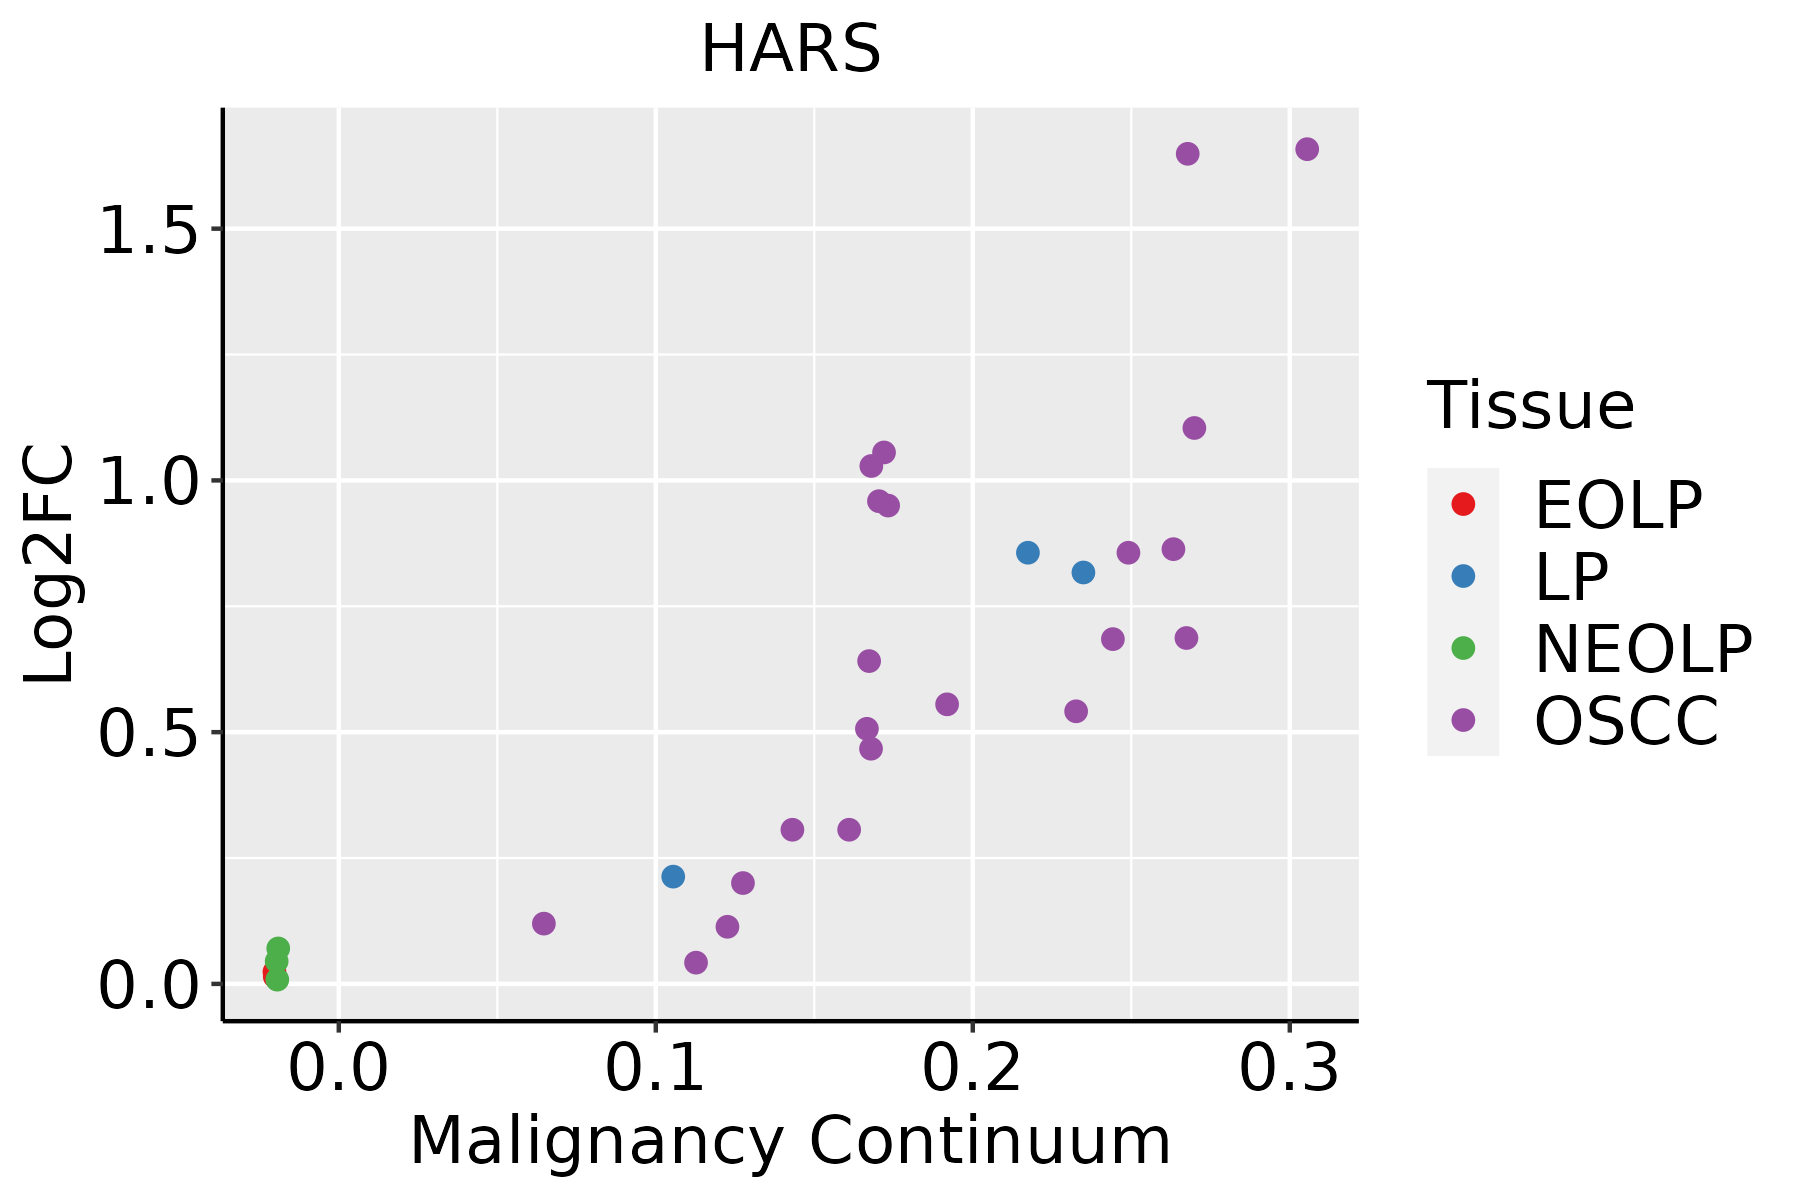 | EOLP: Erosive Oral lichen planus |
| LP: leukoplakia | ||
| NEOLP: Non-erosive oral lichen planus | ||
| OSCC: Oral squamous cell carcinoma | ||
| Skin | 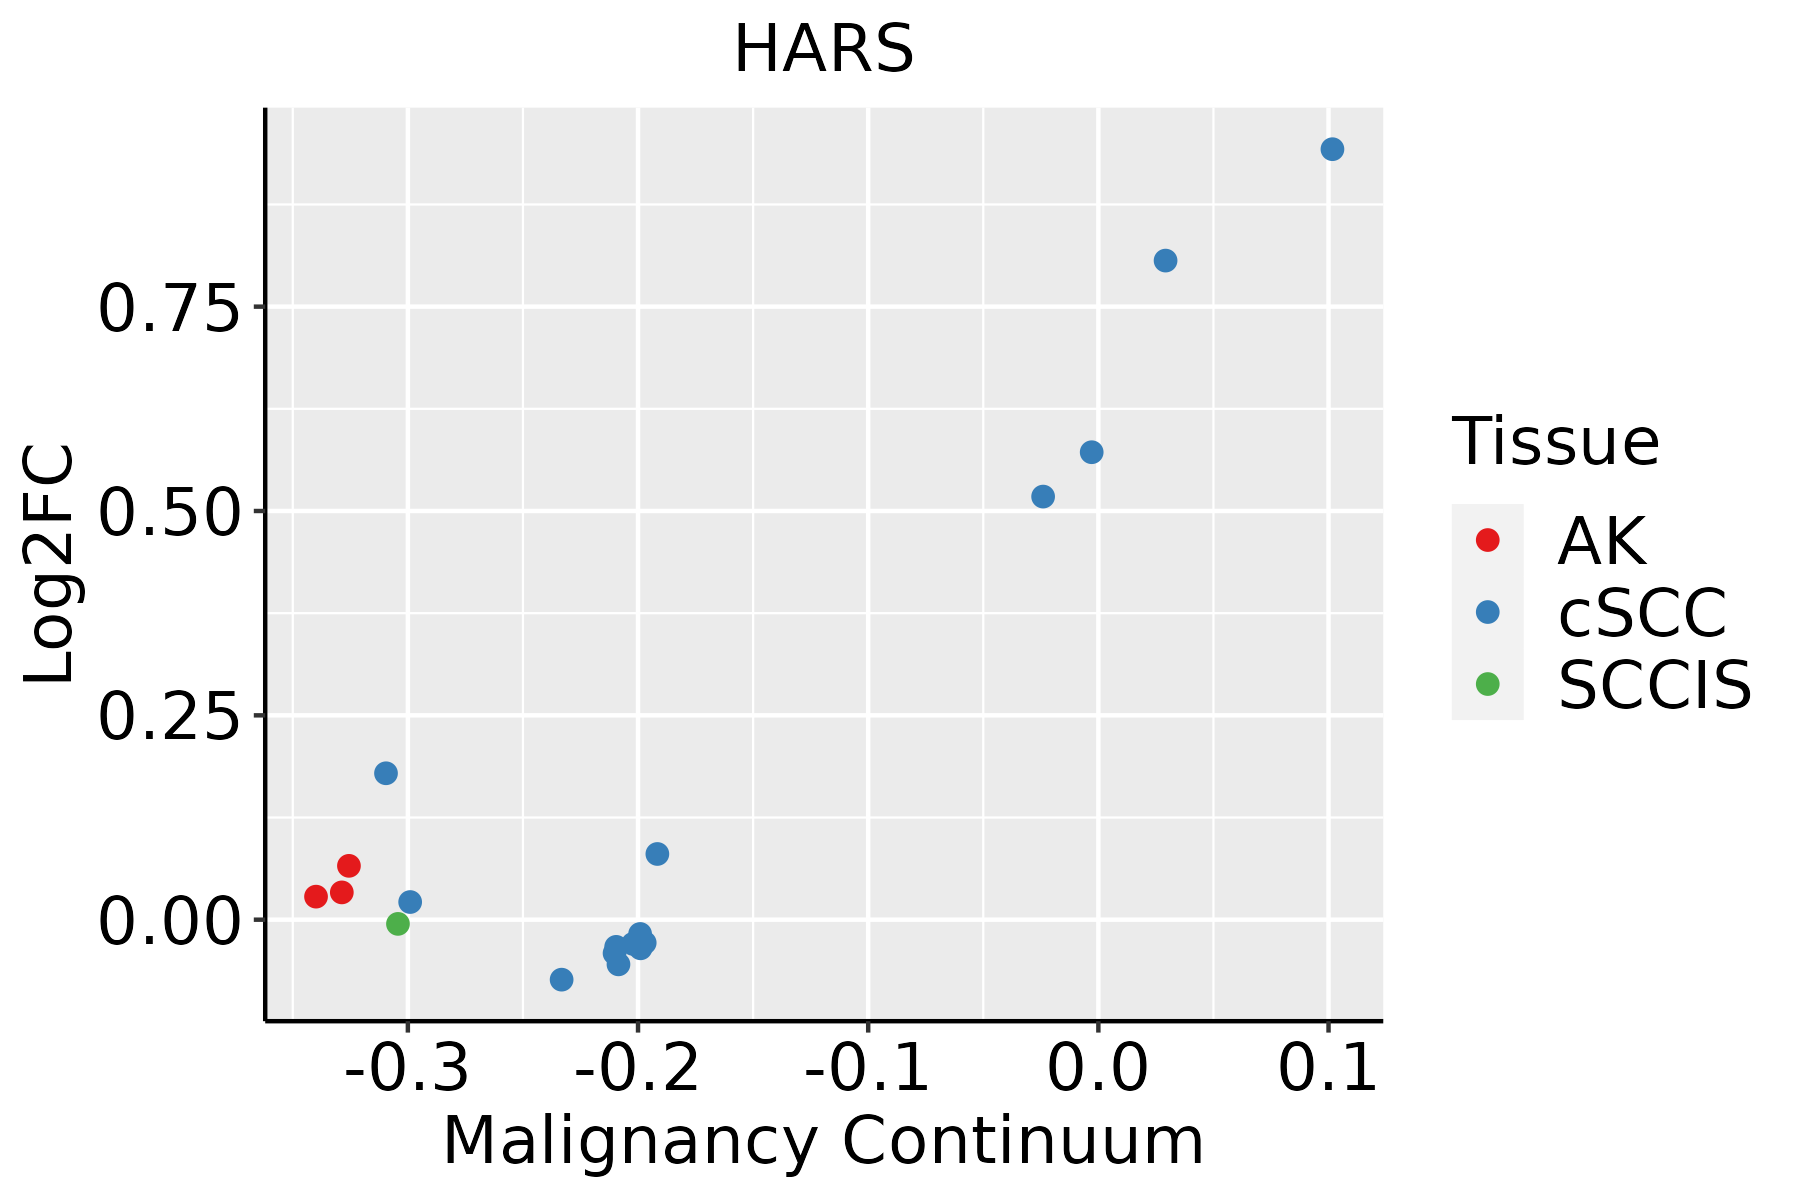 | AK: Actinic keratosis |
| cSCC: Cutaneous squamous cell carcinoma | ||
| SCCIS:squamous cell carcinoma in situ | ||
| Thyroid | 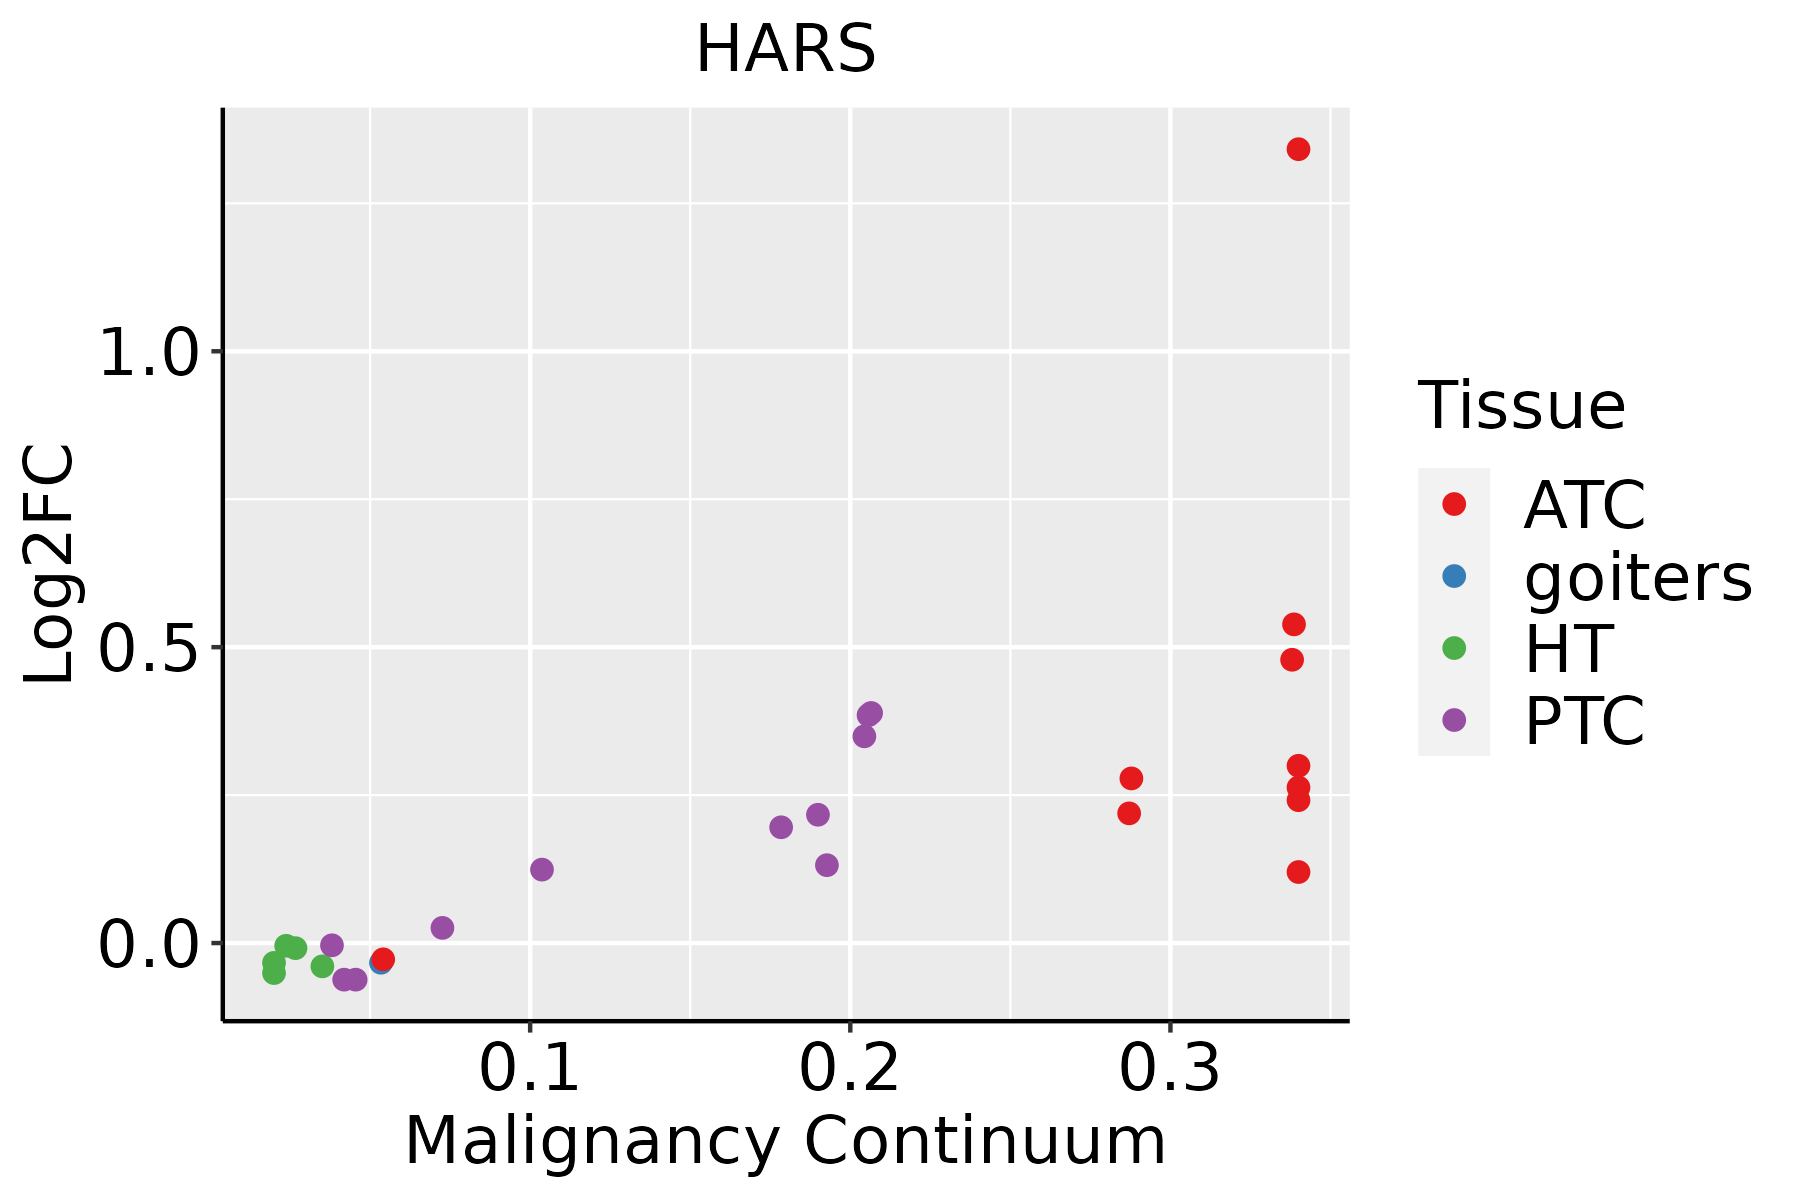 | ATC: Anaplastic thyroid cancer |
| HT: Hashimoto's thyroiditis | ||
| PTC: Papillary thyroid cancer |
| ∗log2FC in expression of this searched gene in stem-like cells from each diseased tissue sample relative to stem-like cells in normal samples in each tissue plotted against the malignancy continuum. Samples are colored based on if they are from different disease stage. |
Top |
Malignant transformation related pathway analysis |
| Find out the enriched GO biological processes and KEGG pathways involved in transition from healthy to precancer to cancer |
| Tissue | Disease Stage | Enriched GO biological Processes |
| Colorectum | AD |  |
| Colorectum | SER |  |
| Colorectum | MSS |  |
| Colorectum | MSI-H |  |
| Colorectum | FAP |  |
| ∗Top 15 enriched GO BP terms are showed in the bar plot of each disease state in each tissue. Each row represents a significant GO biological process which is colored according to the -log10(p.adjust). |
| Page: 1 2 3 4 5 6 7 8 9 |
| GO ID | Tissue | Disease Stage | Description | Gene Ratio | Bg Ratio | pvalue | p.adjust | Count |
| GO:003466012 | Esophagus | ESCC | ncRNA metabolic process | 346/8552 | 485/18723 | 4.35e-31 | 2.51e-28 | 346 |
| GO:00063992 | Esophagus | ESCC | tRNA metabolic process | 122/8552 | 179/18723 | 9.03e-10 | 2.19e-08 | 122 |
| GO:00346605 | Oral cavity | OSCC | ncRNA metabolic process | 296/7305 | 485/18723 | 2.94e-23 | 6.65e-21 | 296 |
| GO:00063991 | Oral cavity | OSCC | tRNA metabolic process | 101/7305 | 179/18723 | 1.65e-06 | 2.15e-05 | 101 |
| GO:00346608 | Thyroid | PTC | ncRNA metabolic process | 239/5968 | 485/18723 | 5.54e-16 | 4.26e-14 | 239 |
| GO:003466021 | Thyroid | ATC | ncRNA metabolic process | 240/6293 | 485/18723 | 2.03e-13 | 9.91e-12 | 240 |
| Page: 1 |
| Pathway ID | Tissue | Disease Stage | Description | Gene Ratio | Bg Ratio | pvalue | p.adjust | qvalue | Count |
| Page: 1 |
Top |
Cell-cell communication analysis |
| Identification of potential cell-cell interactions between two cell types and their ligand-receptor pairs for different disease states |
| Ligand | Receptor | LRpair | Pathway | Tissue | Disease Stage |
| Page: 1 |
Top |
Single-cell gene regulatory network inference analysis |
| Find out the significant the regulons (TFs) and the target genes of each regulon across cell types for different disease states |
| TF | Cell Type | Tissue | Disease Stage | Target Gene | RSS | Regulon Activity |
| ∗The dot plots of a searched regulon are shown for all cell subpopulations in each disease state of each tissue based on the regulon specific score inferred using pySCENIC and by calculating the average expression. |
| Page: 1 |
Top |
Somatic mutation of malignant transformation related genes |
| Annotation of somatic variants for genes involved in malignant transformation |
| Hugo Symbol | Variant Class | Variant Classification | dbSNP RS | HGVSc | HGVSp | HGVSp Short | SWISSPROT | BIOTYPE | SIFT | PolyPhen | Tumor Sample Barcode | Tissue | Histology | Sex | Age | Stage | Therapy Types | Drugs | Outcome |
| HARS | SNV | Missense_Mutation | novel | c.1063N>A | p.Gly355Ser | p.G355S | P12081 | protein_coding | deleterious(0.01) | possibly_damaging(0.899) | TCGA-BH-A0GZ-01 | Breast | breast invasive carcinoma | Female | <65 | I/II | Hormone Therapy | arimidex | SD |
| HARS | SNV | Missense_Mutation | c.946N>A | p.Asp316Asn | p.D316N | P12081 | protein_coding | tolerated(0.1) | benign(0.244) | TCGA-BH-A0GZ-01 | Breast | breast invasive carcinoma | Female | <65 | I/II | Hormone Therapy | arimidex | SD | |
| HARS | SNV | Missense_Mutation | c.56N>A | p.Arg19Gln | p.R19Q | P12081 | protein_coding | tolerated(0.15) | benign(0.013) | TCGA-EW-A1J5-01 | Breast | breast invasive carcinoma | Female | <65 | I/II | Chemotherapy | adriamycin | SD | |
| HARS | deletion | Frame_Shift_Del | novel | c.918delN | p.Phe306LeufsTer4 | p.F306Lfs*4 | P12081 | protein_coding | TCGA-D8-A27V-01 | Breast | breast invasive carcinoma | Female | <65 | I/II | Hormone Therapy | tamoxiphen | SD | ||
| HARS | SNV | Missense_Mutation | novel | c.1315N>A | p.Glu439Lys | p.E439K | P12081 | protein_coding | deleterious(0.01) | probably_damaging(0.949) | TCGA-EK-A2R7-01 | Cervix | cervical & endocervical cancer | Female | <65 | I/II | Unknown | Unknown | SD |
| HARS | SNV | Missense_Mutation | novel | c.22G>C | p.Glu8Gln | p.E8Q | P12081 | protein_coding | tolerated(0.73) | benign(0.009) | TCGA-IR-A3LA-01 | Cervix | cervical & endocervical cancer | Female | <65 | I/II | Chemotherapy | cisplatin | CR |
| HARS | SNV | Missense_Mutation | novel | c.739G>A | p.Glu247Lys | p.E247K | P12081 | protein_coding | tolerated(0.16) | benign(0.02) | TCGA-VS-A8EG-01 | Cervix | cervical & endocervical cancer | Female | <65 | I/II | Unknown | Unknown | SD |
| HARS | SNV | Missense_Mutation | rs752549829 | c.217N>T | p.Arg73Cys | p.R73C | P12081 | protein_coding | deleterious(0) | probably_damaging(1) | TCGA-AA-A00N-01 | Colorectum | colon adenocarcinoma | Male | >=65 | I/II | Unknown | Unknown | PD |
| HARS | SNV | Missense_Mutation | novel | c.172A>C | p.Thr58Pro | p.T58P | P12081 | protein_coding | deleterious(0.01) | benign(0.272) | TCGA-AD-6895-01 | Colorectum | colon adenocarcinoma | Male | >=65 | III/IV | Unknown | Unknown | SD |
| HARS | SNV | Missense_Mutation | c.782N>T | p.Pro261Leu | p.P261L | P12081 | protein_coding | deleterious(0.03) | benign(0.24) | TCGA-AD-6964-01 | Colorectum | colon adenocarcinoma | Male | <65 | III/IV | Chemotherapy | folfox | PD |
| Page: 1 2 3 4 5 |
Top |
Related drugs of malignant transformation related genes |
| Identification of chemicals and drugs interact with genes involved in malignant transfromation |
| (DGIdb 4.0) |
| Entrez ID | Symbol | Category | Interaction Types | Drug Claim Name | Drug Name | PMIDs |
| Page: 1 |

Copyright 2023-Present -The University of Texas Health Science Center at Houston |