
|
|||||
|
 | |
| |
| |
| |
| |
| |
|
Gene: HADH |
Gene summary for HADH |
| Gene information | Species | Human | Gene symbol | HADH | Gene ID | 3033 |
| Gene name | hydroxyacyl-CoA dehydrogenase | |
| Gene Alias | HAD | |
| Cytomap | 4q25 | |
| Gene Type | protein-coding | GO ID | GO:0001659 | UniProtAcc | Q16836 |
Top |
Malignant transformation analysis |
| Identification of the aberrant gene expression in precancerous and cancerous lesions by comparing the gene expression of stem-like cells in diseased tissues with normal stem cells |
| Entrez ID | Symbol | Replicates | Species | Organ | Tissue | Adj P-value | Log2FC | Malignancy |
| 3033 | HADH | HTA11_1938_2000001011 | Human | Colorectum | AD | 4.96e-04 | 4.76e-01 | -0.0811 |
| 3033 | HADH | HTA11_78_2000001011 | Human | Colorectum | AD | 1.93e-04 | 4.41e-01 | -0.1088 |
| 3033 | HADH | HTA11_347_2000001011 | Human | Colorectum | AD | 6.91e-25 | 8.18e-01 | -0.1954 |
| 3033 | HADH | HTA11_83_2000001011 | Human | Colorectum | SER | 2.42e-03 | 4.70e-01 | -0.1526 |
| 3033 | HADH | HTA11_1391_2000001011 | Human | Colorectum | AD | 7.75e-08 | 6.53e-01 | -0.059 |
| 3033 | HADH | HTA11_6801_2000001011 | Human | Colorectum | SER | 5.05e-07 | 8.31e-01 | 0.0171 |
| 3033 | HADH | HTA11_7469_2000001011 | Human | Colorectum | AD | 7.13e-05 | 9.04e-01 | -0.0124 |
| 3033 | HADH | A015-C-203 | Human | Colorectum | FAP | 7.33e-17 | -2.64e-01 | -0.1294 |
| 3033 | HADH | A002-C-201 | Human | Colorectum | FAP | 6.13e-03 | -1.74e-01 | 0.0324 |
| 3033 | HADH | A002-C-203 | Human | Colorectum | FAP | 1.97e-02 | -9.49e-02 | 0.2786 |
| 3033 | HADH | A001-C-119 | Human | Colorectum | FAP | 4.67e-04 | -3.59e-01 | -0.1557 |
| 3033 | HADH | A001-C-108 | Human | Colorectum | FAP | 2.76e-11 | -2.51e-01 | -0.0272 |
| 3033 | HADH | A002-C-205 | Human | Colorectum | FAP | 3.65e-07 | -2.54e-01 | -0.1236 |
| 3033 | HADH | A001-C-104 | Human | Colorectum | FAP | 6.79e-04 | -1.62e-01 | 0.0184 |
| 3033 | HADH | A015-C-006 | Human | Colorectum | FAP | 1.28e-04 | -2.45e-01 | -0.0994 |
| 3033 | HADH | A015-C-106 | Human | Colorectum | FAP | 6.21e-09 | -2.15e-01 | -0.0511 |
| 3033 | HADH | A002-C-114 | Human | Colorectum | FAP | 1.61e-05 | -1.98e-01 | -0.1561 |
| 3033 | HADH | A015-C-104 | Human | Colorectum | FAP | 8.30e-13 | -2.37e-01 | -0.1899 |
| 3033 | HADH | A001-C-014 | Human | Colorectum | FAP | 2.39e-10 | -2.24e-01 | 0.0135 |
| 3033 | HADH | A002-C-016 | Human | Colorectum | FAP | 6.38e-08 | -1.69e-01 | 0.0521 |
| Page: 1 2 3 4 5 6 7 |
| Tissue | Expression Dynamics | Abbreviation |
| Colorectum (GSE201348) |  | FAP: Familial adenomatous polyposis |
| CRC: Colorectal cancer | ||
| Colorectum (HTA11) |  | AD: Adenomas |
| SER: Sessile serrated lesions | ||
| MSI-H: Microsatellite-high colorectal cancer | ||
| MSS: Microsatellite stable colorectal cancer | ||
| Esophagus | 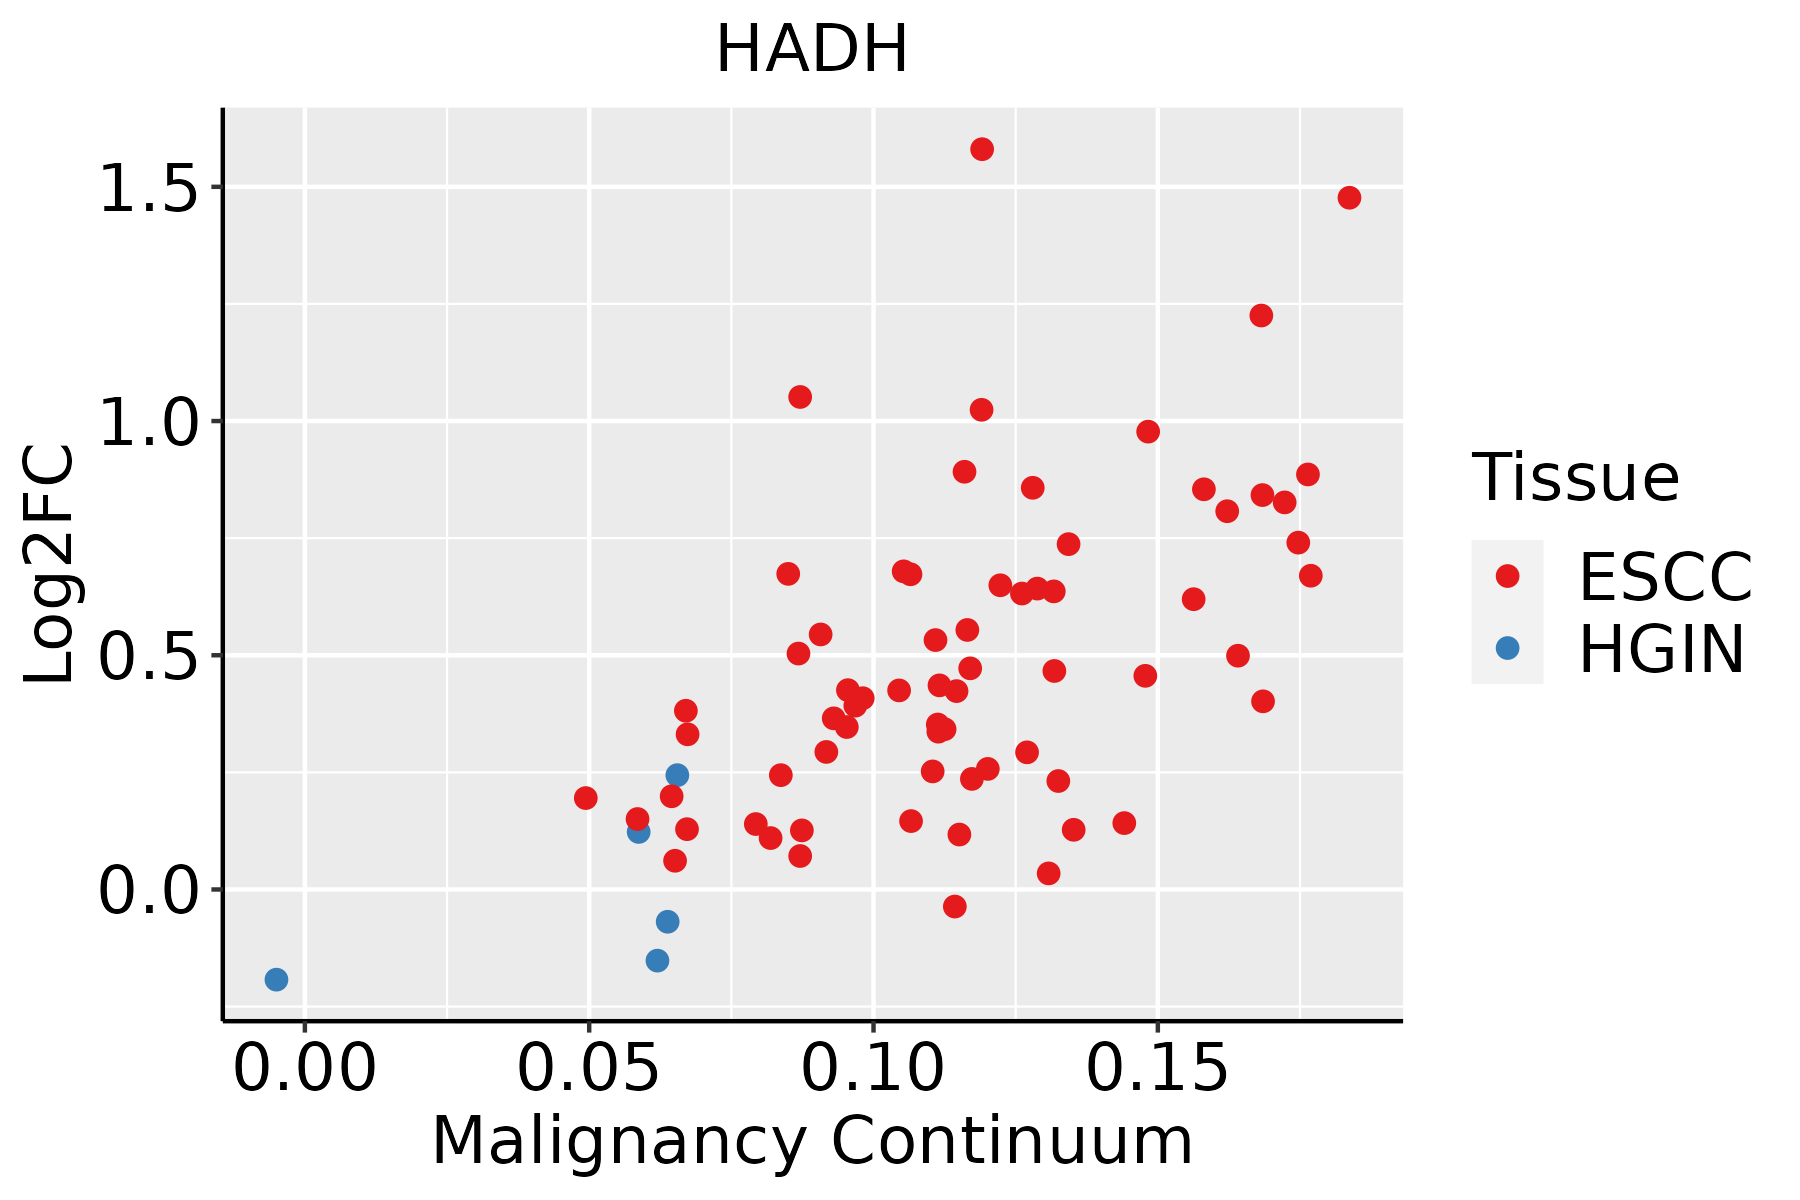 | ESCC: Esophageal squamous cell carcinoma |
| HGIN: High-grade intraepithelial neoplasias | ||
| LGIN: Low-grade intraepithelial neoplasias | ||
| Liver |  | HCC: Hepatocellular carcinoma |
| NAFLD: Non-alcoholic fatty liver disease | ||
| Oral Cavity | 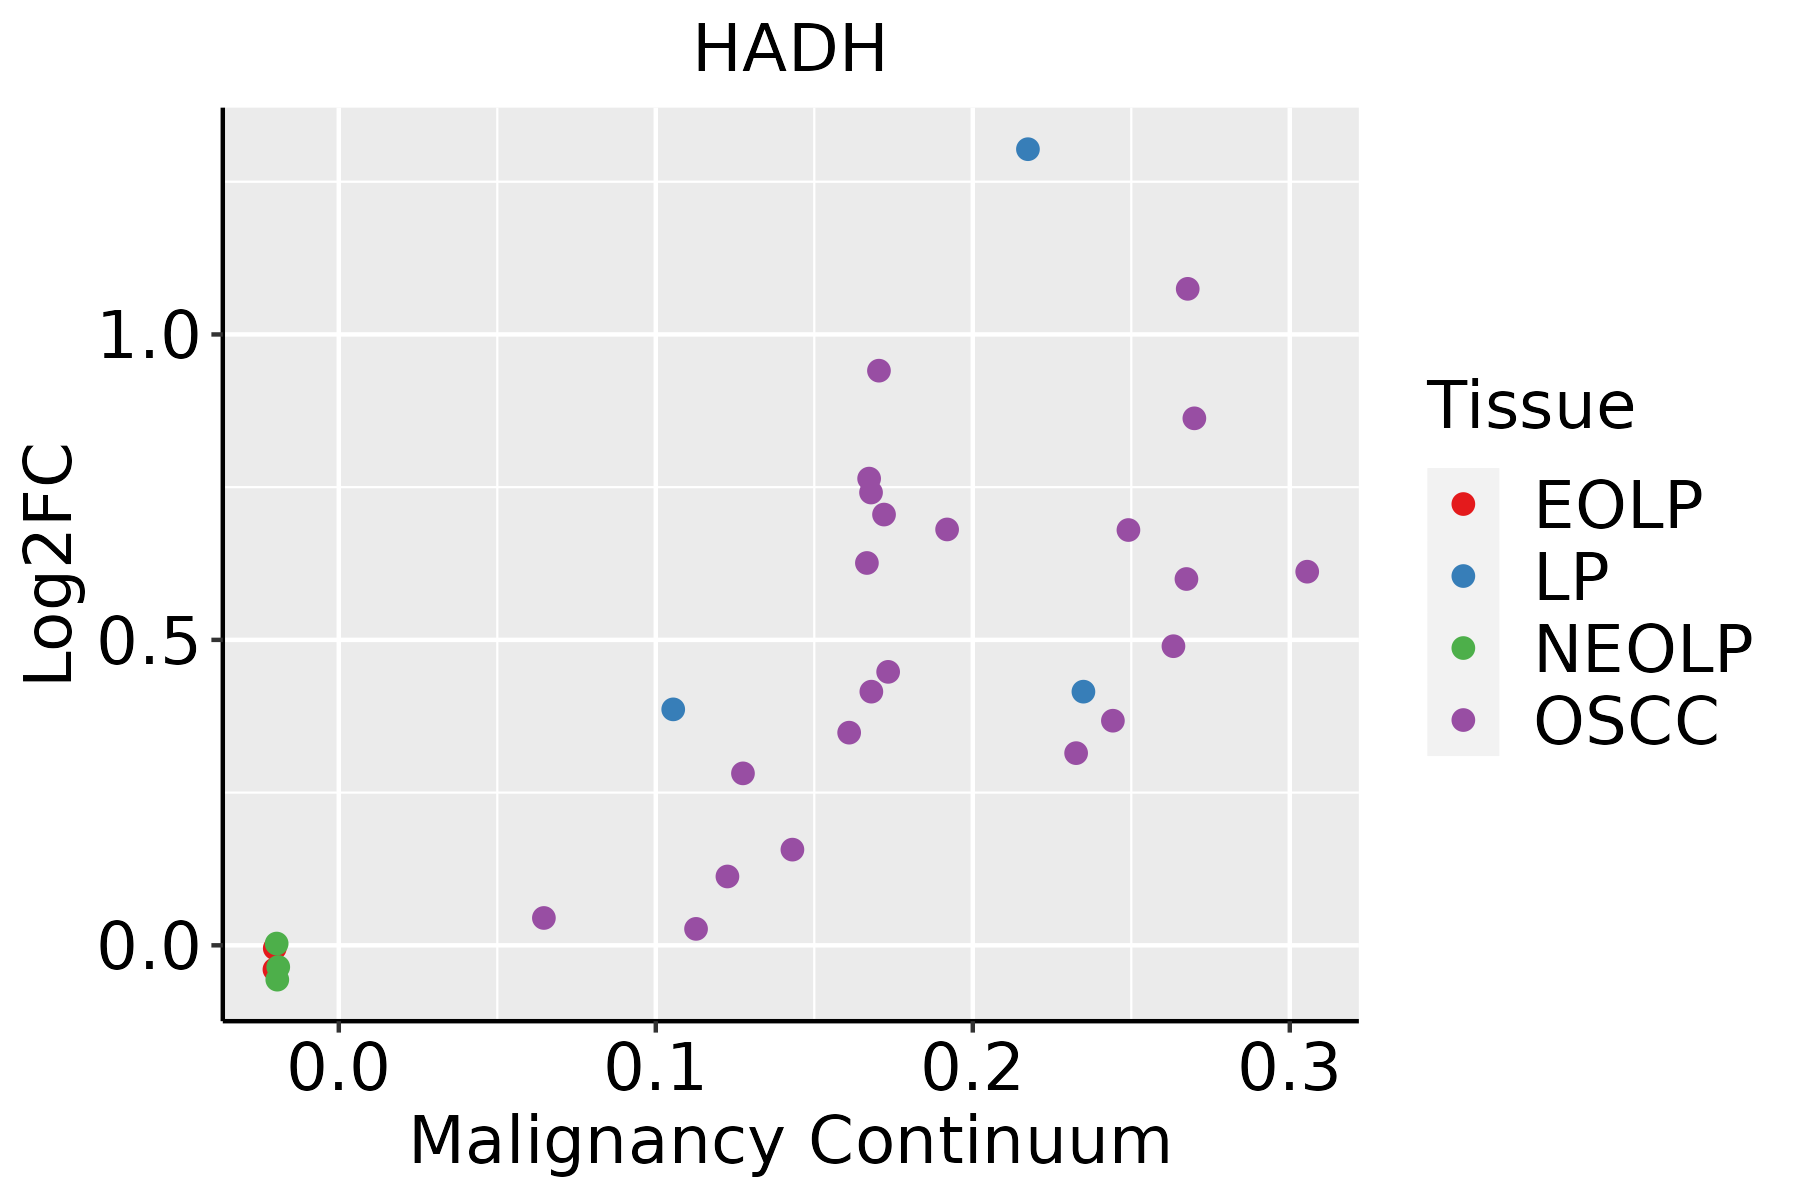 | EOLP: Erosive Oral lichen planus |
| LP: leukoplakia | ||
| NEOLP: Non-erosive oral lichen planus | ||
| OSCC: Oral squamous cell carcinoma | ||
| Skin |  | AK: Actinic keratosis |
| cSCC: Cutaneous squamous cell carcinoma | ||
| SCCIS:squamous cell carcinoma in situ |
| ∗log2FC in expression of this searched gene in stem-like cells from each diseased tissue sample relative to stem-like cells in normal samples in each tissue plotted against the malignancy continuum. Samples are colored based on if they are from different disease stage. |
Top |
Malignant transformation related pathway analysis |
| Find out the enriched GO biological processes and KEGG pathways involved in transition from healthy to precancer to cancer |
| Tissue | Disease Stage | Enriched GO biological Processes |
| Colorectum | AD |  |
| Colorectum | SER |  |
| Colorectum | MSS |  |
| Colorectum | MSI-H |  |
| Colorectum | FAP |  |
| ∗Top 15 enriched GO BP terms are showed in the bar plot of each disease state in each tissue. Each row represents a significant GO biological process which is colored according to the -log10(p.adjust). |
| Page: 1 2 3 4 5 6 7 8 9 |
| GO ID | Tissue | Disease Stage | Description | Gene Ratio | Bg Ratio | pvalue | p.adjust | Count |
| GO:0032868 | Colorectum | AD | response to insulin | 91/3918 | 264/18723 | 2.02e-07 | 8.48e-06 | 91 |
| GO:0044282 | Colorectum | AD | small molecule catabolic process | 118/3918 | 376/18723 | 1.05e-06 | 3.55e-05 | 118 |
| GO:0043434 | Colorectum | AD | response to peptide hormone | 126/3918 | 414/18723 | 2.70e-06 | 7.86e-05 | 126 |
| GO:0006635 | Colorectum | AD | fatty acid beta-oxidation | 33/3918 | 74/18723 | 3.98e-06 | 1.09e-04 | 33 |
| GO:0009062 | Colorectum | AD | fatty acid catabolic process | 41/3918 | 100/18723 | 4.02e-06 | 1.09e-04 | 41 |
| GO:0019395 | Colorectum | AD | fatty acid oxidation | 40/3918 | 103/18723 | 2.43e-05 | 4.69e-04 | 40 |
| GO:0016042 | Colorectum | AD | lipid catabolic process | 97/3918 | 320/18723 | 4.31e-05 | 7.56e-04 | 97 |
| GO:0006631 | Colorectum | AD | fatty acid metabolic process | 114/3918 | 390/18723 | 5.58e-05 | 9.44e-04 | 114 |
| GO:0050708 | Colorectum | AD | regulation of protein secretion | 83/3918 | 268/18723 | 6.59e-05 | 1.07e-03 | 83 |
| GO:0072329 | Colorectum | AD | monocarboxylic acid catabolic process | 44/3918 | 122/18723 | 8.05e-05 | 1.28e-03 | 44 |
| GO:0034440 | Colorectum | AD | lipid oxidation | 40/3918 | 108/18723 | 8.52e-05 | 1.32e-03 | 40 |
| GO:0009306 | Colorectum | AD | protein secretion | 105/3918 | 359/18723 | 1.05e-04 | 1.57e-03 | 105 |
| GO:0035592 | Colorectum | AD | establishment of protein localization to extracellular region | 105/3918 | 360/18723 | 1.18e-04 | 1.73e-03 | 105 |
| GO:0030258 | Colorectum | AD | lipid modification | 67/3918 | 212/18723 | 1.66e-04 | 2.27e-03 | 67 |
| GO:0071692 | Colorectum | AD | protein localization to extracellular region | 106/3918 | 368/18723 | 1.86e-04 | 2.49e-03 | 106 |
| GO:0050796 | Colorectum | AD | regulation of insulin secretion | 54/3918 | 165/18723 | 2.60e-04 | 3.25e-03 | 54 |
| GO:0009410 | Colorectum | AD | response to xenobiotic stimulus | 128/3918 | 462/18723 | 2.69e-04 | 3.31e-03 | 128 |
| GO:0016054 | Colorectum | AD | organic acid catabolic process | 73/3918 | 240/18723 | 3.20e-04 | 3.81e-03 | 73 |
| GO:0044242 | Colorectum | AD | cellular lipid catabolic process | 66/3918 | 214/18723 | 3.96e-04 | 4.50e-03 | 66 |
| GO:0030073 | Colorectum | AD | insulin secretion | 61/3918 | 195/18723 | 4.28e-04 | 4.81e-03 | 61 |
| Page: 1 2 3 4 5 6 7 8 9 10 11 12 13 14 15 16 17 |
| Pathway ID | Tissue | Disease Stage | Description | Gene Ratio | Bg Ratio | pvalue | p.adjust | qvalue | Count |
| hsa00280 | Colorectum | AD | Valine, leucine and isoleucine degradation | 25/2092 | 48/8465 | 3.97e-05 | 3.41e-04 | 2.18e-04 | 25 |
| hsa00310 | Colorectum | AD | Lysine degradation | 27/2092 | 63/8465 | 1.17e-03 | 7.75e-03 | 4.94e-03 | 27 |
| hsa00071 | Colorectum | AD | Fatty acid degradation | 20/2092 | 43/8465 | 1.50e-03 | 8.69e-03 | 5.54e-03 | 20 |
| hsa002801 | Colorectum | AD | Valine, leucine and isoleucine degradation | 25/2092 | 48/8465 | 3.97e-05 | 3.41e-04 | 2.18e-04 | 25 |
| hsa003101 | Colorectum | AD | Lysine degradation | 27/2092 | 63/8465 | 1.17e-03 | 7.75e-03 | 4.94e-03 | 27 |
| hsa000711 | Colorectum | AD | Fatty acid degradation | 20/2092 | 43/8465 | 1.50e-03 | 8.69e-03 | 5.54e-03 | 20 |
| hsa00062 | Colorectum | SER | Fatty acid elongation | 11/1580 | 27/8465 | 6.38e-03 | 3.68e-02 | 2.67e-02 | 11 |
| hsa000712 | Colorectum | SER | Fatty acid degradation | 15/1580 | 43/8465 | 8.60e-03 | 4.26e-02 | 3.09e-02 | 15 |
| hsa000621 | Colorectum | SER | Fatty acid elongation | 11/1580 | 27/8465 | 6.38e-03 | 3.68e-02 | 2.67e-02 | 11 |
| hsa000713 | Colorectum | SER | Fatty acid degradation | 15/1580 | 43/8465 | 8.60e-03 | 4.26e-02 | 3.09e-02 | 15 |
| hsa003104 | Colorectum | FAP | Lysine degradation | 23/1404 | 63/8465 | 1.04e-04 | 9.46e-04 | 5.76e-04 | 23 |
| hsa002804 | Colorectum | FAP | Valine, leucine and isoleucine degradation | 18/1404 | 48/8465 | 3.94e-04 | 3.06e-03 | 1.86e-03 | 18 |
| hsa000716 | Colorectum | FAP | Fatty acid degradation | 15/1404 | 43/8465 | 2.73e-03 | 1.23e-02 | 7.50e-03 | 15 |
| hsa00380 | Colorectum | FAP | Tryptophan metabolism | 13/1404 | 42/8465 | 1.54e-02 | 4.99e-02 | 3.03e-02 | 13 |
| hsa003105 | Colorectum | FAP | Lysine degradation | 23/1404 | 63/8465 | 1.04e-04 | 9.46e-04 | 5.76e-04 | 23 |
| hsa002805 | Colorectum | FAP | Valine, leucine and isoleucine degradation | 18/1404 | 48/8465 | 3.94e-04 | 3.06e-03 | 1.86e-03 | 18 |
| hsa000717 | Colorectum | FAP | Fatty acid degradation | 15/1404 | 43/8465 | 2.73e-03 | 1.23e-02 | 7.50e-03 | 15 |
| hsa003801 | Colorectum | FAP | Tryptophan metabolism | 13/1404 | 42/8465 | 1.54e-02 | 4.99e-02 | 3.03e-02 | 13 |
| hsa003106 | Colorectum | CRC | Lysine degradation | 18/1091 | 63/8465 | 7.21e-04 | 6.34e-03 | 4.30e-03 | 18 |
| hsa01212 | Colorectum | CRC | Fatty acid metabolism | 14/1091 | 57/8465 | 1.17e-02 | 4.99e-02 | 3.38e-02 | 14 |
| Page: 1 2 3 4 |
Top |
Cell-cell communication analysis |
| Identification of potential cell-cell interactions between two cell types and their ligand-receptor pairs for different disease states |
| Ligand | Receptor | LRpair | Pathway | Tissue | Disease Stage |
| Page: 1 |
Top |
Single-cell gene regulatory network inference analysis |
| Find out the significant the regulons (TFs) and the target genes of each regulon across cell types for different disease states |
| TF | Cell Type | Tissue | Disease Stage | Target Gene | RSS | Regulon Activity |
| ∗The dot plots of a searched regulon are shown for all cell subpopulations in each disease state of each tissue based on the regulon specific score inferred using pySCENIC and by calculating the average expression. |
| Page: 1 |
Top |
Somatic mutation of malignant transformation related genes |
| Annotation of somatic variants for genes involved in malignant transformation |
| Hugo Symbol | Variant Class | Variant Classification | dbSNP RS | HGVSc | HGVSp | HGVSp Short | SWISSPROT | BIOTYPE | SIFT | PolyPhen | Tumor Sample Barcode | Tissue | Histology | Sex | Age | Stage | Therapy Types | Drugs | Outcome |
| HADH | SNV | Missense_Mutation | novel | c.856A>G | p.Thr286Ala | p.T286A | Q16836 | protein_coding | deleterious(0.01) | possibly_damaging(0.702) | TCGA-A2-A04Y-01 | Breast | breast invasive carcinoma | Female | <65 | I/II | Chemotherapy | cytoxan | SD |
| HADH | SNV | Missense_Mutation | rs150930917 | c.237N>T | p.Lys79Asn | p.K79N | Q16836 | protein_coding | deleterious(0.02) | possibly_damaging(0.59) | TCGA-A7-A0DB-01 | Breast | breast invasive carcinoma | Female | <65 | I/II | Hormone Therapy | arimidex | SD |
| HADH | SNV | Missense_Mutation | c.775G>A | p.Glu259Lys | p.E259K | Q16836 | protein_coding | tolerated(0.22) | benign(0.103) | TCGA-D8-A1JC-01 | Breast | breast invasive carcinoma | Female | <65 | III/IV | Chemotherapy | adriamycin | SD | |
| HADH | insertion | Nonsense_Mutation | novel | c.858_859insTCATAGCCACACCCCAAATATGCTGTGTTCCTTCCC | p.Thr286_Thr287insSerTerProHisProLysTyrAlaValPheLeuPro | p.T286_T287insS*PHPKYAVFLP | Q16836 | protein_coding | TCGA-A2-A04Y-01 | Breast | breast invasive carcinoma | Female | <65 | I/II | Chemotherapy | cytoxan | SD | ||
| HADH | insertion | In_Frame_Ins | novel | c.669_670insCTGCAGGAAAGCCTGGAA | p.Leu223_Val224insLeuGlnGluSerLeuGlu | p.L223_V224insLQESLE | Q16836 | protein_coding | TCGA-E9-A1NC-01 | Breast | breast invasive carcinoma | Female | <65 | I/II | Chemotherapy | doxorubicin | CR | ||
| HADH | insertion | Frame_Shift_Ins | novel | c.671_672insCAACCTGTTTAAAGCTTTTCCTC | p.Pro225AsnfsTer36 | p.P225Nfs*36 | Q16836 | protein_coding | TCGA-E9-A1NC-01 | Breast | breast invasive carcinoma | Female | <65 | I/II | Chemotherapy | doxorubicin | CR | ||
| HADH | SNV | Missense_Mutation | c.56N>T | p.Ser19Leu | p.S19L | Q16836 | protein_coding | tolerated(0.19) | benign(0.09) | TCGA-C5-A1BM-01 | Cervix | cervical & endocervical cancer | Female | >=65 | I/II | Unknown | Unknown | SD | |
| HADH | SNV | Missense_Mutation | c.914N>G | p.Gln305Arg | p.Q305R | Q16836 | protein_coding | tolerated(0.33) | benign(0.025) | TCGA-A6-3809-01 | Colorectum | colon adenocarcinoma | Female | >=65 | I/II | Unknown | Unknown | SD | |
| HADH | SNV | Missense_Mutation | c.791N>T | p.Ala264Val | p.A264V | Q16836 | protein_coding | deleterious(0) | probably_damaging(0.987) | TCGA-AA-3977-01 | Colorectum | colon adenocarcinoma | Male | >=65 | I/II | Unknown | Unknown | SD | |
| HADH | SNV | Missense_Mutation | rs183387994 | c.737C>T | p.Ser246Leu | p.S246L | Q16836 | protein_coding | tolerated_low_confidence(1) | benign(0) | TCGA-AG-3592-01 | Colorectum | rectum adenocarcinoma | Male | >=65 | I/II | Unknown | Unknown | SD |
| Page: 1 2 3 4 |
Top |
Related drugs of malignant transformation related genes |
| Identification of chemicals and drugs interact with genes involved in malignant transfromation |
| (DGIdb 4.0) |
| Entrez ID | Symbol | Category | Interaction Types | Drug Claim Name | Drug Name | PMIDs |
| Page: 1 |

Copyright 2023-Present -The University of Texas Health Science Center at Houston |