
|
|||||
|
 | |
| |
| |
| |
| |
| |
|
Gene: HACL1 |
Gene summary for HACL1 |
| Gene information | Species | Human | Gene symbol | HACL1 | Gene ID | 26061 |
| Gene name | 2-hydroxyacyl-CoA lyase 1 | |
| Gene Alias | 2-HPCL | |
| Cytomap | 3p25.1 | |
| Gene Type | protein-coding | GO ID | GO:0001561 | UniProtAcc | Q9UJ83 |
Top |
Malignant transformation analysis |
| Identification of the aberrant gene expression in precancerous and cancerous lesions by comparing the gene expression of stem-like cells in diseased tissues with normal stem cells |
| Entrez ID | Symbol | Replicates | Species | Organ | Tissue | Adj P-value | Log2FC | Malignancy |
| 26061 | HACL1 | LZE24T | Human | Esophagus | ESCC | 1.62e-02 | 8.92e-02 | 0.0596 |
| 26061 | HACL1 | P2T-E | Human | Esophagus | ESCC | 3.62e-11 | 1.73e-01 | 0.1177 |
| 26061 | HACL1 | P4T-E | Human | Esophagus | ESCC | 2.01e-05 | 1.51e-01 | 0.1323 |
| 26061 | HACL1 | P5T-E | Human | Esophagus | ESCC | 2.32e-16 | 3.37e-01 | 0.1327 |
| 26061 | HACL1 | P8T-E | Human | Esophagus | ESCC | 4.60e-11 | 8.06e-02 | 0.0889 |
| 26061 | HACL1 | P9T-E | Human | Esophagus | ESCC | 6.73e-04 | 1.43e-01 | 0.1131 |
| 26061 | HACL1 | P10T-E | Human | Esophagus | ESCC | 2.62e-14 | 2.45e-01 | 0.116 |
| 26061 | HACL1 | P12T-E | Human | Esophagus | ESCC | 5.62e-19 | 1.94e-01 | 0.1122 |
| 26061 | HACL1 | P15T-E | Human | Esophagus | ESCC | 4.03e-07 | 2.13e-01 | 0.1149 |
| 26061 | HACL1 | P16T-E | Human | Esophagus | ESCC | 2.51e-12 | 1.90e-01 | 0.1153 |
| 26061 | HACL1 | P20T-E | Human | Esophagus | ESCC | 1.02e-12 | 2.23e-01 | 0.1124 |
| 26061 | HACL1 | P21T-E | Human | Esophagus | ESCC | 4.47e-09 | 1.17e-01 | 0.1617 |
| 26061 | HACL1 | P22T-E | Human | Esophagus | ESCC | 4.89e-08 | 9.31e-02 | 0.1236 |
| 26061 | HACL1 | P23T-E | Human | Esophagus | ESCC | 2.68e-12 | 2.71e-01 | 0.108 |
| 26061 | HACL1 | P24T-E | Human | Esophagus | ESCC | 1.10e-09 | 2.67e-01 | 0.1287 |
| 26061 | HACL1 | P26T-E | Human | Esophagus | ESCC | 7.03e-11 | 2.73e-01 | 0.1276 |
| 26061 | HACL1 | P27T-E | Human | Esophagus | ESCC | 5.03e-14 | 1.98e-01 | 0.1055 |
| 26061 | HACL1 | P28T-E | Human | Esophagus | ESCC | 2.74e-13 | 1.59e-01 | 0.1149 |
| 26061 | HACL1 | P30T-E | Human | Esophagus | ESCC | 3.01e-12 | 6.22e-01 | 0.137 |
| 26061 | HACL1 | P31T-E | Human | Esophagus | ESCC | 2.21e-08 | 2.37e-01 | 0.1251 |
| Page: 1 2 3 |
| Tissue | Expression Dynamics | Abbreviation |
| Esophagus | 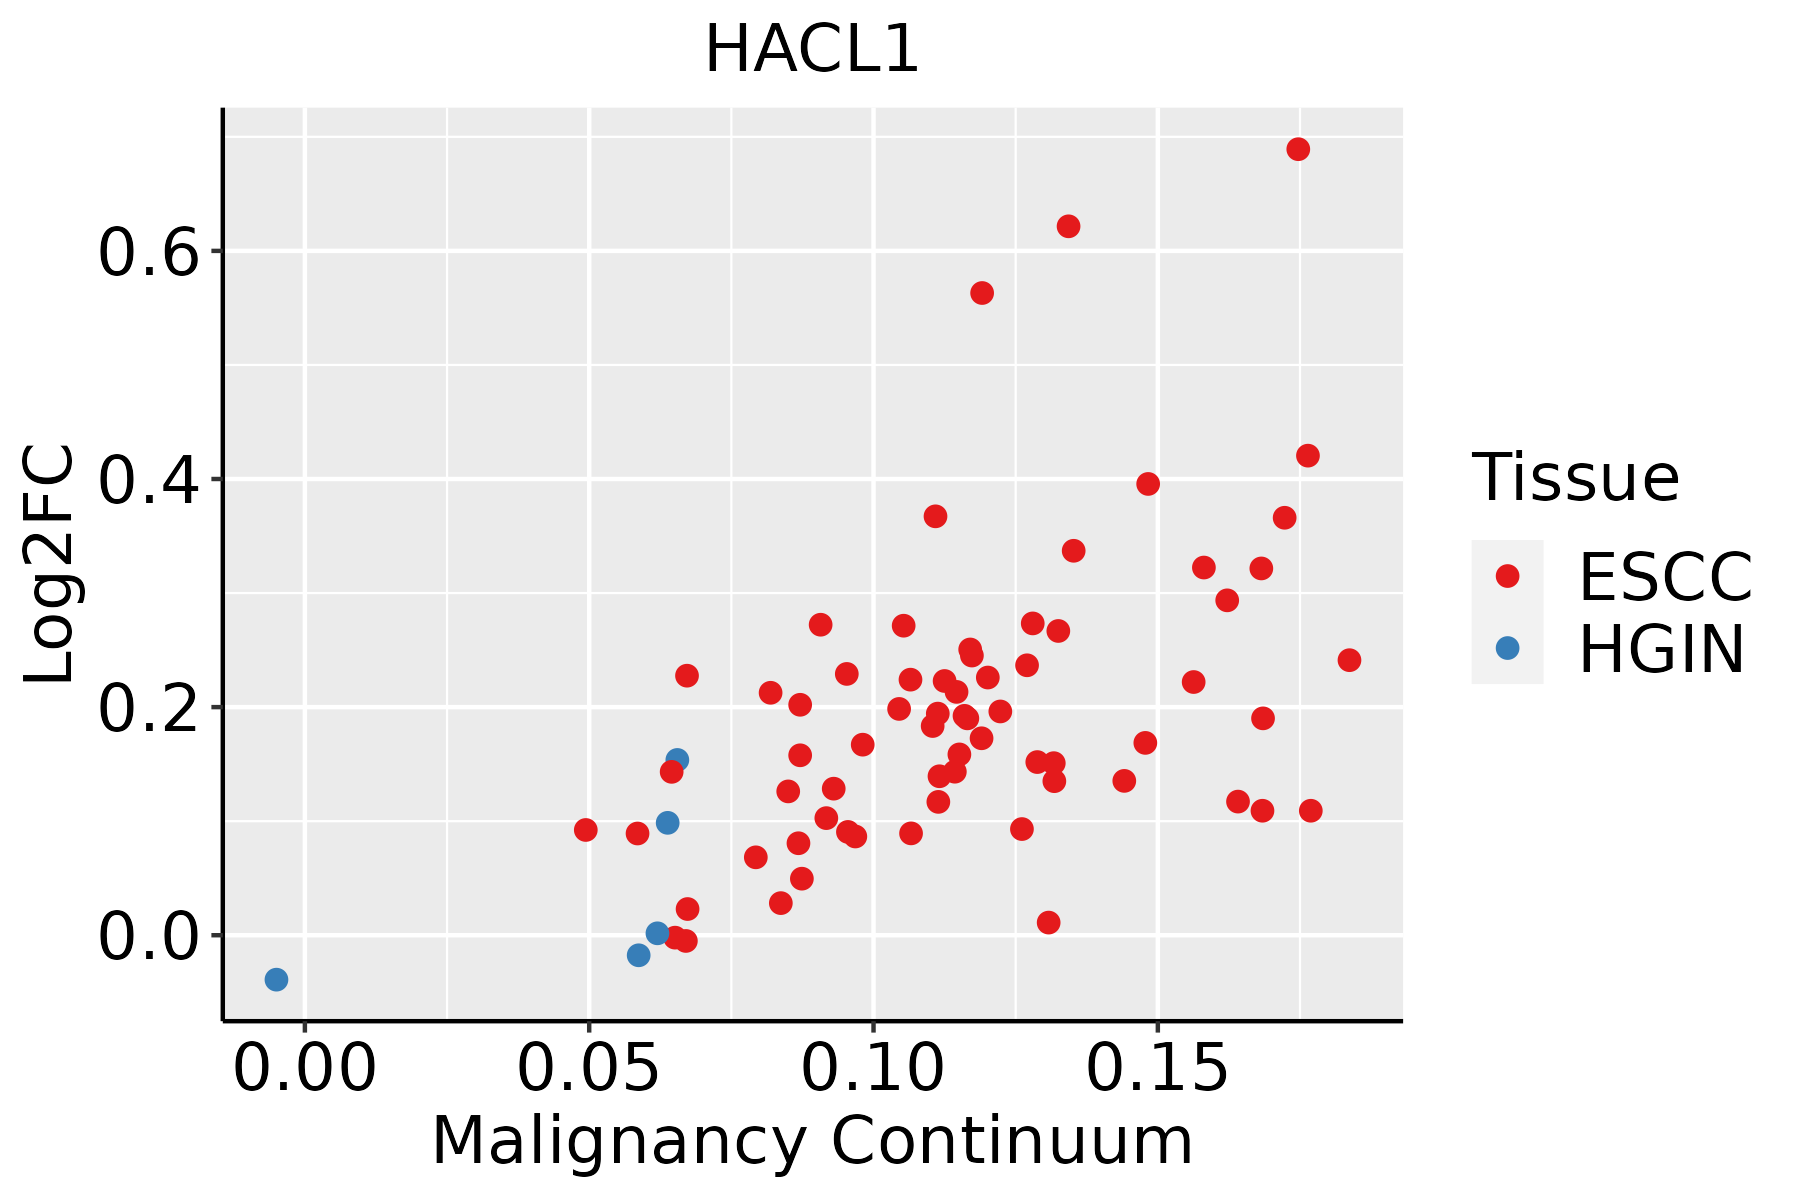 | ESCC: Esophageal squamous cell carcinoma |
| HGIN: High-grade intraepithelial neoplasias | ||
| LGIN: Low-grade intraepithelial neoplasias | ||
| Liver |  | HCC: Hepatocellular carcinoma |
| NAFLD: Non-alcoholic fatty liver disease | ||
| Oral Cavity | 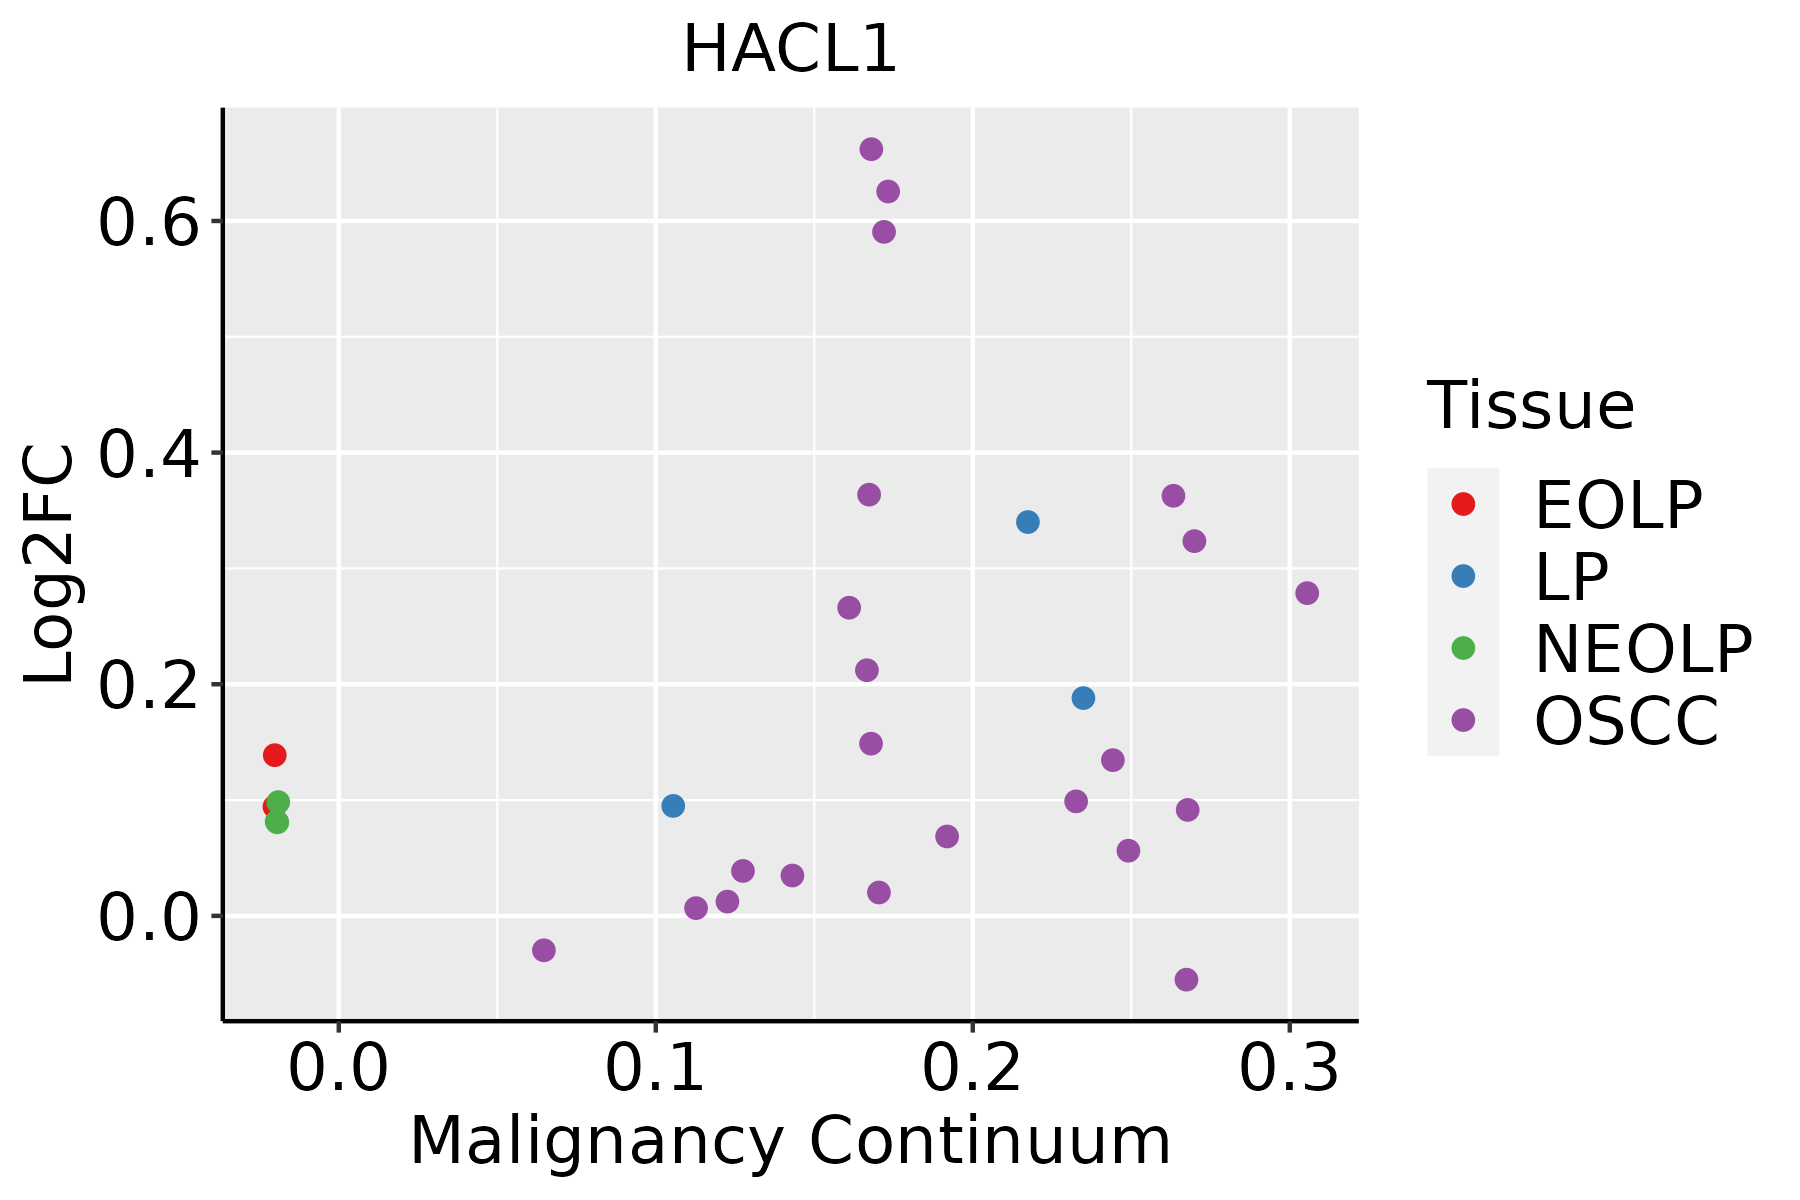 | EOLP: Erosive Oral lichen planus |
| LP: leukoplakia | ||
| NEOLP: Non-erosive oral lichen planus | ||
| OSCC: Oral squamous cell carcinoma |
| ∗log2FC in expression of this searched gene in stem-like cells from each diseased tissue sample relative to stem-like cells in normal samples in each tissue plotted against the malignancy continuum. Samples are colored based on if they are from different disease stage. |
Top |
Malignant transformation related pathway analysis |
| Find out the enriched GO biological processes and KEGG pathways involved in transition from healthy to precancer to cancer |
| Tissue | Disease Stage | Enriched GO biological Processes |
| Colorectum | AD |  |
| Colorectum | SER |  |
| Colorectum | MSS |  |
| Colorectum | MSI-H |  |
| Colorectum | FAP |  |
| ∗Top 15 enriched GO BP terms are showed in the bar plot of each disease state in each tissue. Each row represents a significant GO biological process which is colored according to the -log10(p.adjust). |
| Page: 1 2 3 4 5 6 7 8 9 |
| GO ID | Tissue | Disease Stage | Description | Gene Ratio | Bg Ratio | pvalue | p.adjust | Count |
| GO:0072594110 | Esophagus | ESCC | establishment of protein localization to organelle | 311/8552 | 422/18723 | 3.02e-32 | 2.13e-29 | 311 |
| GO:0006605111 | Esophagus | ESCC | protein targeting | 229/8552 | 314/18723 | 4.93e-23 | 1.01e-20 | 229 |
| GO:00193958 | Esophagus | ESCC | fatty acid oxidation | 69/8552 | 103/18723 | 9.95e-06 | 9.44e-05 | 69 |
| GO:00344407 | Esophagus | ESCC | lipid oxidation | 71/8552 | 108/18723 | 2.00e-05 | 1.74e-04 | 71 |
| GO:00090628 | Esophagus | ESCC | fatty acid catabolic process | 66/8552 | 100/18723 | 3.21e-05 | 2.66e-04 | 66 |
| GO:00066318 | Esophagus | ESCC | fatty acid metabolic process | 217/8552 | 390/18723 | 4.21e-05 | 3.39e-04 | 217 |
| GO:00723297 | Esophagus | ESCC | monocarboxylic acid catabolic process | 74/8552 | 122/18723 | 6.03e-04 | 3.27e-03 | 74 |
| GO:00442427 | Esophagus | ESCC | cellular lipid catabolic process | 121/8552 | 214/18723 | 8.63e-04 | 4.43e-03 | 121 |
| GO:00442827 | Esophagus | ESCC | small molecule catabolic process | 201/8552 | 376/18723 | 1.35e-03 | 6.41e-03 | 201 |
| GO:00302586 | Esophagus | ESCC | lipid modification | 116/8552 | 212/18723 | 4.90e-03 | 1.89e-02 | 116 |
| GO:00066252 | Esophagus | ESCC | protein targeting to peroxisome | 14/8552 | 18/18723 | 5.77e-03 | 2.14e-02 | 14 |
| GO:00726622 | Esophagus | ESCC | protein localization to peroxisome | 14/8552 | 18/18723 | 5.77e-03 | 2.14e-02 | 14 |
| GO:00726632 | Esophagus | ESCC | establishment of protein localization to peroxisome | 14/8552 | 18/18723 | 5.77e-03 | 2.14e-02 | 14 |
| GO:00160427 | Esophagus | ESCC | lipid catabolic process | 168/8552 | 320/18723 | 7.97e-03 | 2.84e-02 | 168 |
| GO:00435742 | Esophagus | ESCC | peroxisomal transport | 16/8552 | 22/18723 | 9.46e-03 | 3.28e-02 | 16 |
| GO:007259422 | Liver | HCC | establishment of protein localization to organelle | 299/7958 | 422/18723 | 1.06e-32 | 6.10e-30 | 299 |
| GO:000660512 | Liver | HCC | protein targeting | 219/7958 | 314/18723 | 7.74e-23 | 1.49e-20 | 219 |
| GO:000663122 | Liver | HCC | fatty acid metabolic process | 238/7958 | 390/18723 | 8.24e-14 | 4.84e-12 | 238 |
| GO:004428221 | Liver | HCC | small molecule catabolic process | 225/7958 | 376/18723 | 6.50e-12 | 2.80e-10 | 225 |
| GO:001605421 | Liver | HCC | organic acid catabolic process | 152/7958 | 240/18723 | 5.11e-11 | 1.92e-09 | 152 |
| Page: 1 2 3 |
| Pathway ID | Tissue | Disease Stage | Description | Gene Ratio | Bg Ratio | pvalue | p.adjust | qvalue | Count |
| hsa041467 | Esophagus | ESCC | Peroxisome | 55/4205 | 82/8465 | 1.04e-03 | 3.27e-03 | 1.68e-03 | 55 |
| hsa0414612 | Esophagus | ESCC | Peroxisome | 55/4205 | 82/8465 | 1.04e-03 | 3.27e-03 | 1.68e-03 | 55 |
| hsa041464 | Liver | HCC | Peroxisome | 58/4020 | 82/8465 | 1.57e-05 | 1.05e-04 | 5.85e-05 | 58 |
| hsa041465 | Liver | HCC | Peroxisome | 58/4020 | 82/8465 | 1.57e-05 | 1.05e-04 | 5.85e-05 | 58 |
| Page: 1 |
Top |
Cell-cell communication analysis |
| Identification of potential cell-cell interactions between two cell types and their ligand-receptor pairs for different disease states |
| Ligand | Receptor | LRpair | Pathway | Tissue | Disease Stage |
| Page: 1 |
Top |
Single-cell gene regulatory network inference analysis |
| Find out the significant the regulons (TFs) and the target genes of each regulon across cell types for different disease states |
| TF | Cell Type | Tissue | Disease Stage | Target Gene | RSS | Regulon Activity |
| ∗The dot plots of a searched regulon are shown for all cell subpopulations in each disease state of each tissue based on the regulon specific score inferred using pySCENIC and by calculating the average expression. |
| Page: 1 |
Top |
Somatic mutation of malignant transformation related genes |
| Annotation of somatic variants for genes involved in malignant transformation |
| Hugo Symbol | Variant Class | Variant Classification | dbSNP RS | HGVSc | HGVSp | HGVSp Short | SWISSPROT | BIOTYPE | SIFT | PolyPhen | Tumor Sample Barcode | Tissue | Histology | Sex | Age | Stage | Therapy Types | Drugs | Outcome |
| HACL1 | SNV | Missense_Mutation | novel | c.1169G>A | p.Arg390Lys | p.R390K | Q9UJ83 | protein_coding | tolerated(1) | benign(0) | TCGA-5L-AAT0-01 | Breast | breast invasive carcinoma | Female | <65 | I/II | Hormone Therapy | tamoxiphen | SD |
| HACL1 | SNV | Missense_Mutation | novel | c.1318N>T | p.Ala440Ser | p.A440S | Q9UJ83 | protein_coding | tolerated(0.24) | benign(0.196) | TCGA-AN-A046-01 | Breast | breast invasive carcinoma | Female | >=65 | I/II | Unknown | Unknown | SD |
| HACL1 | SNV | Missense_Mutation | rs770803683 | c.1125N>A | p.Met375Ile | p.M375I | Q9UJ83 | protein_coding | deleterious(0.04) | benign(0.157) | TCGA-AO-A0J7-01 | Breast | breast invasive carcinoma | Female | >=65 | I/II | Chemotherapy | doxorubicin | SD |
| HACL1 | SNV | Missense_Mutation | c.1601N>T | p.Thr534Ile | p.T534I | Q9UJ83 | protein_coding | deleterious(0) | probably_damaging(0.991) | TCGA-B6-A0I9-01 | Breast | breast invasive carcinoma | Female | <65 | III/IV | Unknown | Unknown | PD | |
| HACL1 | insertion | Frame_Shift_Ins | novel | c.1574_1575insG | p.Phe525LeufsTer27 | p.F525Lfs*27 | Q9UJ83 | protein_coding | TCGA-AN-A04A-01 | Breast | breast invasive carcinoma | Female | <65 | III/IV | Unknown | Unknown | SD | ||
| HACL1 | insertion | Frame_Shift_Ins | novel | c.1572_1573insCTCCTGTGGGT | p.Phe525LeufsTer22 | p.F525Lfs*22 | Q9UJ83 | protein_coding | TCGA-AN-A04A-01 | Breast | breast invasive carcinoma | Female | <65 | III/IV | Unknown | Unknown | SD | ||
| HACL1 | SNV | Missense_Mutation | rs140199501 | c.1693C>T | p.Arg565Trp | p.R565W | Q9UJ83 | protein_coding | deleterious(0) | probably_damaging(0.999) | TCGA-2W-A8YY-01 | Cervix | cervical & endocervical cancer | Female | <65 | I/II | Chemotherapy | cisplatin | CR |
| HACL1 | SNV | Missense_Mutation | novel | c.875C>T | p.Pro292Leu | p.P292L | Q9UJ83 | protein_coding | deleterious(0) | probably_damaging(0.972) | TCGA-2W-A8YY-01 | Cervix | cervical & endocervical cancer | Female | <65 | I/II | Chemotherapy | cisplatin | CR |
| HACL1 | SNV | Missense_Mutation | c.229N>T | p.Pro77Ser | p.P77S | Q9UJ83 | protein_coding | deleterious(0) | probably_damaging(0.998) | TCGA-DR-A0ZM-01 | Cervix | cervical & endocervical cancer | Female | <65 | III/IV | Unspecific | Cisplatin | SD | |
| HACL1 | SNV | Missense_Mutation | c.262C>G | p.Leu88Val | p.L88V | Q9UJ83 | protein_coding | tolerated(0.44) | possibly_damaging(0.609) | TCGA-Q1-A73O-01 | Cervix | cervical & endocervical cancer | Female | <65 | I/II | Chemotherapy | cisplatin | CR |
| Page: 1 2 3 4 5 6 |
Top |
Related drugs of malignant transformation related genes |
| Identification of chemicals and drugs interact with genes involved in malignant transfromation |
| (DGIdb 4.0) |
| Entrez ID | Symbol | Category | Interaction Types | Drug Claim Name | Drug Name | PMIDs |
| Page: 1 |

Copyright 2023-Present -The University of Texas Health Science Center at Houston |