
|
|||||
|
 | |
| |
| |
| |
| |
| |
|
Gene: HABP4 |
Gene summary for HABP4 |
| Gene information | Species | Human | Gene symbol | HABP4 | Gene ID | 22927 |
| Gene name | hyaluronan binding protein 4 | |
| Gene Alias | IHABP-4 | |
| Cytomap | 9q22.32 | |
| Gene Type | protein-coding | GO ID | GO:0006139 | UniProtAcc | Q5JVS0 |
Top |
Malignant transformation analysis |
| Identification of the aberrant gene expression in precancerous and cancerous lesions by comparing the gene expression of stem-like cells in diseased tissues with normal stem cells |
| Entrez ID | Symbol | Replicates | Species | Organ | Tissue | Adj P-value | Log2FC | Malignancy |
| 22927 | HABP4 | HCC1_Meng | Human | Liver | HCC | 2.67e-15 | -3.20e-02 | 0.0246 |
| 22927 | HABP4 | HCC1 | Human | Liver | HCC | 2.68e-04 | 4.41e+00 | 0.5336 |
| 22927 | HABP4 | HCC2 | Human | Liver | HCC | 3.55e-03 | 2.26e+00 | 0.5341 |
| 22927 | HABP4 | S014 | Human | Liver | HCC | 1.61e-20 | 8.39e-01 | 0.2254 |
| 22927 | HABP4 | S015 | Human | Liver | HCC | 1.06e-13 | 8.64e-01 | 0.2375 |
| 22927 | HABP4 | S016 | Human | Liver | HCC | 1.86e-18 | 7.42e-01 | 0.2243 |
| Page: 1 |
| Tissue | Expression Dynamics | Abbreviation |
| Liver | 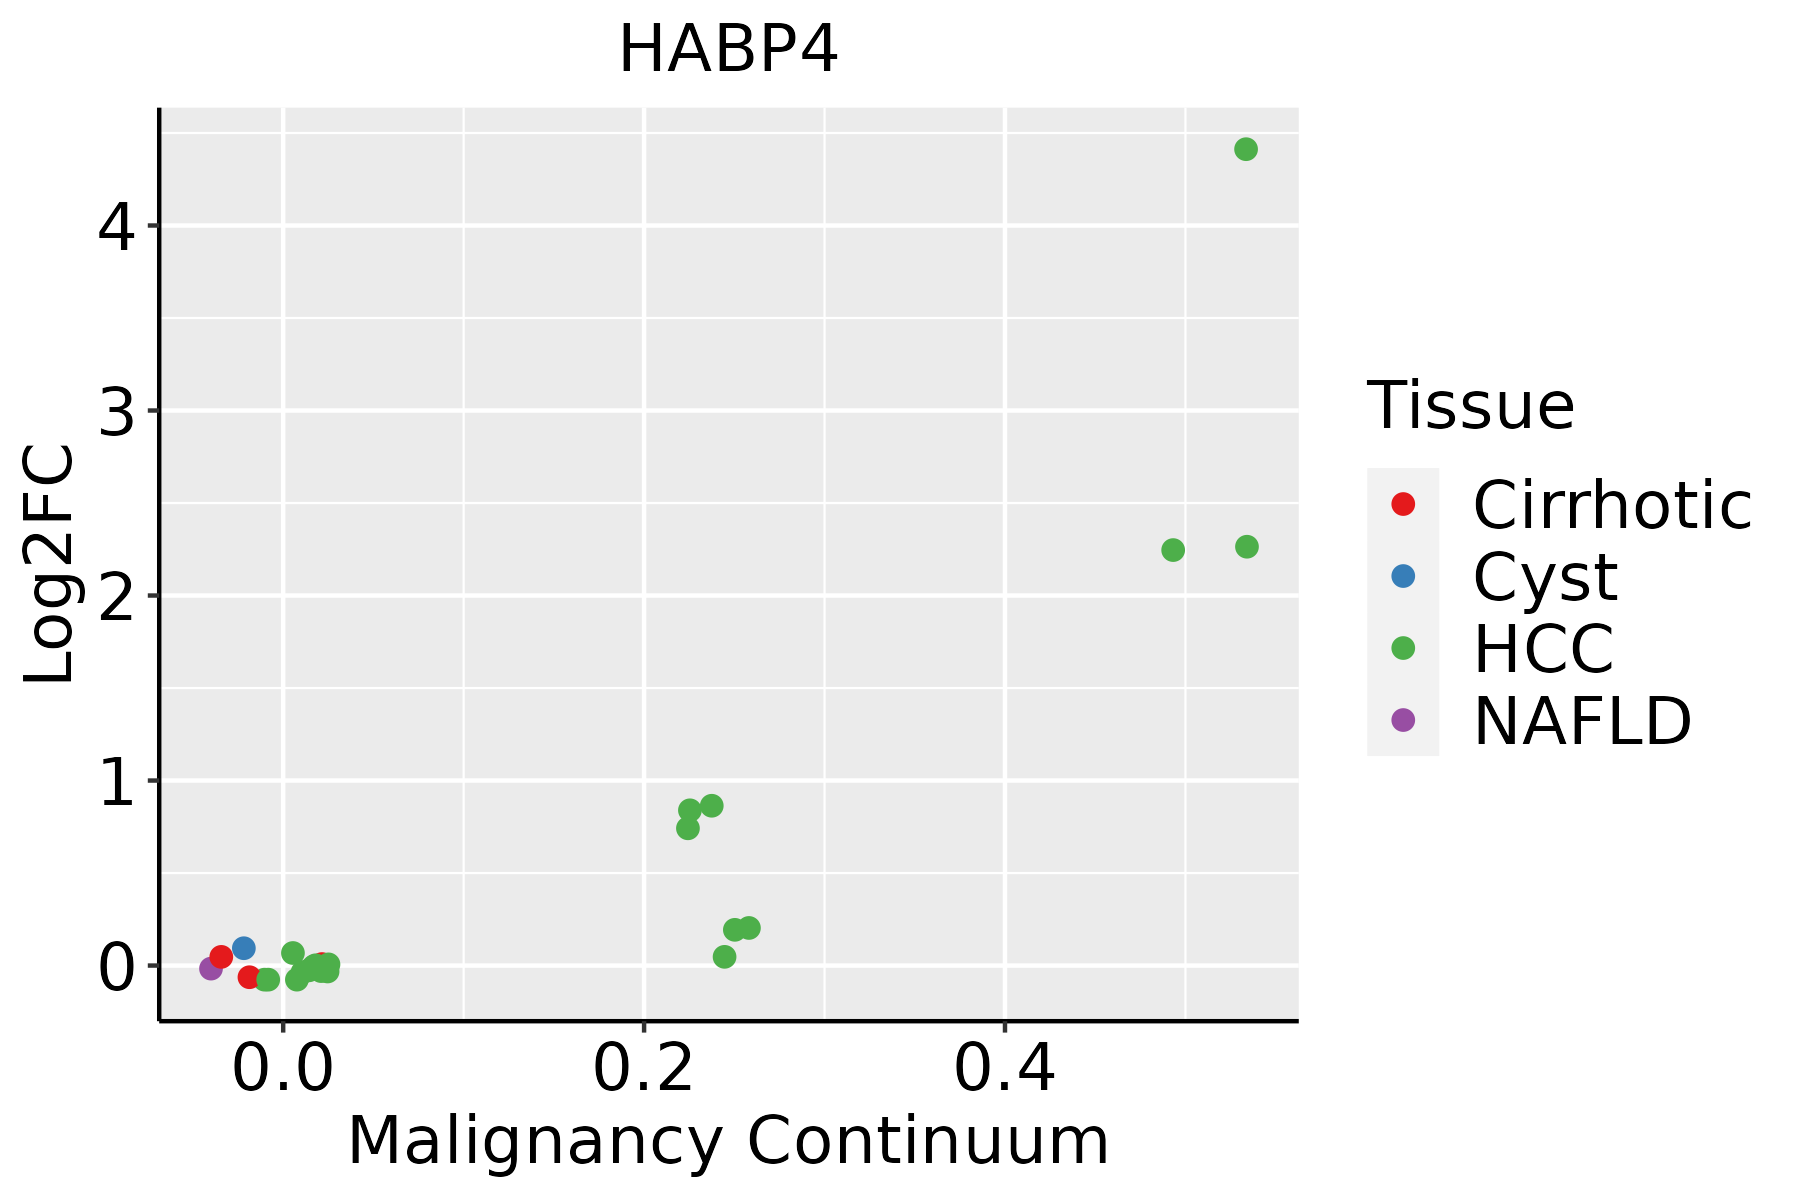 | HCC: Hepatocellular carcinoma |
| NAFLD: Non-alcoholic fatty liver disease |
| ∗log2FC in expression of this searched gene in stem-like cells from each diseased tissue sample relative to stem-like cells in normal samples in each tissue plotted against the malignancy continuum. Samples are colored based on if they are from different disease stage. |
Top |
Malignant transformation related pathway analysis |
| Find out the enriched GO biological processes and KEGG pathways involved in transition from healthy to precancer to cancer |
| Tissue | Disease Stage | Enriched GO biological Processes |
| Colorectum | AD |  |
| Colorectum | SER |  |
| Colorectum | MSS |  |
| Colorectum | MSI-H |  |
| Colorectum | FAP |  |
| ∗Top 15 enriched GO BP terms are showed in the bar plot of each disease state in each tissue. Each row represents a significant GO biological process which is colored according to the -log10(p.adjust). |
| Page: 1 2 3 4 5 6 7 8 9 |
| GO ID | Tissue | Disease Stage | Description | Gene Ratio | Bg Ratio | pvalue | p.adjust | Count |
| GO:000838022 | Liver | HCC | RNA splicing | 313/7958 | 434/18723 | 1.36e-36 | 1.73e-33 | 313 |
| GO:004348422 | Liver | HCC | regulation of RNA splicing | 113/7958 | 148/18723 | 4.32e-17 | 4.15e-15 | 113 |
| GO:000641722 | Liver | HCC | regulation of translation | 287/7958 | 468/18723 | 8.79e-17 | 8.08e-15 | 287 |
| GO:000641322 | Liver | HCC | translational initiation | 94/7958 | 118/18723 | 1.39e-16 | 1.24e-14 | 94 |
| GO:005109822 | Liver | HCC | regulation of binding | 225/7958 | 363/18723 | 3.78e-14 | 2.37e-12 | 225 |
| GO:004572712 | Liver | HCC | positive regulation of translation | 97/7958 | 136/18723 | 8.51e-12 | 3.55e-10 | 97 |
| GO:003425022 | Liver | HCC | positive regulation of cellular amide metabolic process | 110/7958 | 162/18723 | 5.14e-11 | 1.92e-09 | 110 |
| GO:000644622 | Liver | HCC | regulation of translational initiation | 62/7958 | 79/18723 | 6.85e-11 | 2.48e-09 | 62 |
| GO:007149622 | Liver | HCC | cellular response to external stimulus | 191/7958 | 320/18723 | 3.40e-10 | 1.13e-08 | 191 |
| GO:007121421 | Liver | HCC | cellular response to abiotic stimulus | 183/7958 | 331/18723 | 1.59e-06 | 2.26e-05 | 183 |
| GO:010400421 | Liver | HCC | cellular response to environmental stimulus | 183/7958 | 331/18723 | 1.59e-06 | 2.26e-05 | 183 |
| GO:00069971 | Liver | HCC | nucleus organization | 82/7958 | 133/18723 | 6.32e-06 | 7.72e-05 | 82 |
| GO:003312012 | Liver | HCC | positive regulation of RNA splicing | 29/7958 | 37/18723 | 9.37e-06 | 1.09e-04 | 29 |
| GO:005110012 | Liver | HCC | negative regulation of binding | 94/7958 | 162/18723 | 4.69e-05 | 4.50e-04 | 94 |
| GO:00459481 | Liver | HCC | positive regulation of translational initiation | 22/7958 | 30/18723 | 6.14e-04 | 3.82e-03 | 22 |
| GO:00712601 | Liver | HCC | cellular response to mechanical stimulus | 48/7958 | 81/18723 | 1.72e-03 | 8.96e-03 | 48 |
| GO:00096124 | Liver | HCC | response to mechanical stimulus | 113/7958 | 216/18723 | 2.20e-03 | 1.10e-02 | 113 |
| GO:005110112 | Liver | HCC | regulation of DNA binding | 64/7958 | 118/18723 | 6.60e-03 | 2.68e-02 | 64 |
| Page: 1 |
| Pathway ID | Tissue | Disease Stage | Description | Gene Ratio | Bg Ratio | pvalue | p.adjust | qvalue | Count |
| Page: 1 |
Top |
Cell-cell communication analysis |
| Identification of potential cell-cell interactions between two cell types and their ligand-receptor pairs for different disease states |
| Ligand | Receptor | LRpair | Pathway | Tissue | Disease Stage |
| Page: 1 |
Top |
Single-cell gene regulatory network inference analysis |
| Find out the significant the regulons (TFs) and the target genes of each regulon across cell types for different disease states |
| TF | Cell Type | Tissue | Disease Stage | Target Gene | RSS | Regulon Activity |
| ∗The dot plots of a searched regulon are shown for all cell subpopulations in each disease state of each tissue based on the regulon specific score inferred using pySCENIC and by calculating the average expression. |
| Page: 1 |
Top |
Somatic mutation of malignant transformation related genes |
| Annotation of somatic variants for genes involved in malignant transformation |
| Hugo Symbol | Variant Class | Variant Classification | dbSNP RS | HGVSc | HGVSp | HGVSp Short | SWISSPROT | BIOTYPE | SIFT | PolyPhen | Tumor Sample Barcode | Tissue | Histology | Sex | Age | Stage | Therapy Types | Drugs | Outcome |
| HABP4 | SNV | Missense_Mutation | novel | c.725N>A | p.Gly242Glu | p.G242E | Q5JVS0 | protein_coding | deleterious(0.02) | possibly_damaging(0.879) | TCGA-A2-A0EV-01 | Breast | breast invasive carcinoma | Female | >=65 | I/II | Unknown | Unknown | SD |
| HABP4 | SNV | Missense_Mutation | c.608N>A | p.Arg203Lys | p.R203K | Q5JVS0 | protein_coding | tolerated(0.13) | benign(0.006) | TCGA-C8-A130-01 | Breast | breast invasive carcinoma | Female | <65 | III/IV | Unknown | Unknown | SD | |
| HABP4 | SNV | Missense_Mutation | rs780353636 | c.401N>A | p.Arg134His | p.R134H | Q5JVS0 | protein_coding | deleterious(0.01) | possibly_damaging(0.894) | TCGA-2W-A8YY-01 | Cervix | cervical & endocervical cancer | Female | <65 | I/II | Chemotherapy | cisplatin | CR |
| HABP4 | SNV | Missense_Mutation | c.1156G>C | p.Glu386Gln | p.E386Q | Q5JVS0 | protein_coding | deleterious(0.05) | probably_damaging(0.982) | TCGA-DR-A0ZM-01 | Cervix | cervical & endocervical cancer | Female | <65 | III/IV | Unspecific | Cisplatin | SD | |
| HABP4 | SNV | Missense_Mutation | c.1130N>A | p.Gly377Glu | p.G377E | Q5JVS0 | protein_coding | deleterious(0) | probably_damaging(0.949) | TCGA-EK-A2RJ-01 | Cervix | cervical & endocervical cancer | Female | <65 | I/II | Unknown | Unknown | SD | |
| HABP4 | SNV | Missense_Mutation | rs771229420 | c.898C>G | p.Gln300Glu | p.Q300E | Q5JVS0 | protein_coding | deleterious(0) | probably_damaging(0.998) | TCGA-VS-A8QC-01 | Cervix | cervical & endocervical cancer | Female | <65 | I/II | Chemotherapy | paclitaxel | PD |
| HABP4 | SNV | Missense_Mutation | novel | c.586N>T | p.Gly196Cys | p.G196C | Q5JVS0 | protein_coding | deleterious(0.01) | probably_damaging(0.978) | TCGA-AG-A002-01 | Colorectum | rectum adenocarcinoma | Male | <65 | I/II | Unknown | Unknown | SD |
| HABP4 | deletion | In_Frame_Del | c.899_901delNNN | p.Glu301del | p.E301del | Q5JVS0 | protein_coding | TCGA-AA-3811-01 | Colorectum | colon adenocarcinoma | Female | >=65 | III/IV | Unknown | Unknown | PD | |||
| HABP4 | SNV | Missense_Mutation | novel | c.502N>T | p.Pro168Ser | p.P168S | Q5JVS0 | protein_coding | tolerated(0.57) | benign(0) | TCGA-A5-A0G1-01 | Endometrium | uterine corpus endometrioid carcinoma | Female | >=65 | I/II | Unknown | Unknown | SD |
| HABP4 | SNV | Missense_Mutation | novel | c.502N>T | p.Pro168Ser | p.P168S | Q5JVS0 | protein_coding | tolerated(0.57) | benign(0) | TCGA-A5-A0GG-01 | Endometrium | uterine corpus endometrioid carcinoma | Female | >=65 | I/II | Unknown | Unknown | SD |
| Page: 1 2 3 4 |
Top |
Related drugs of malignant transformation related genes |
| Identification of chemicals and drugs interact with genes involved in malignant transfromation |
| (DGIdb 4.0) |
| Entrez ID | Symbol | Category | Interaction Types | Drug Claim Name | Drug Name | PMIDs |
| Page: 1 |

Copyright 2023-Present -The University of Texas Health Science Center at Houston |