
|
|||||
|
 | |
| |
| |
| |
| |
| |
|
Gene: HAAO |
Gene summary for HAAO |
| Gene information | Species | Human | Gene symbol | HAAO | Gene ID | 23498 |
| Gene name | 3-hydroxyanthranilate 3,4-dioxygenase | |
| Gene Alias | 3-HAO | |
| Cytomap | 2p21 | |
| Gene Type | protein-coding | GO ID | GO:0006082 | UniProtAcc | P46952 |
Top |
Malignant transformation analysis |
| Identification of the aberrant gene expression in precancerous and cancerous lesions by comparing the gene expression of stem-like cells in diseased tissues with normal stem cells |
| Entrez ID | Symbol | Replicates | Species | Organ | Tissue | Adj P-value | Log2FC | Malignancy |
| 23498 | HAAO | S43 | Human | Liver | Cirrhotic | 1.81e-02 | -1.17e-01 | -0.0187 |
| 23498 | HAAO | HCC1_Meng | Human | Liver | HCC | 1.52e-55 | 2.84e-02 | 0.0246 |
| 23498 | HAAO | HCC2_Meng | Human | Liver | HCC | 8.91e-03 | -1.53e-01 | 0.0107 |
| 23498 | HAAO | HCC1 | Human | Liver | HCC | 2.36e-12 | 4.55e+00 | 0.5336 |
| 23498 | HAAO | Pt14.b | Human | Liver | HCC | 1.89e-03 | 2.43e-01 | 0.018 |
| 23498 | HAAO | S014 | Human | Liver | HCC | 3.97e-25 | 1.23e+00 | 0.2254 |
| 23498 | HAAO | S015 | Human | Liver | HCC | 7.61e-26 | 1.45e+00 | 0.2375 |
| 23498 | HAAO | S016 | Human | Liver | HCC | 5.18e-32 | 1.20e+00 | 0.2243 |
| 23498 | HAAO | S028 | Human | Liver | HCC | 2.13e-06 | 5.35e-01 | 0.2503 |
| 23498 | HAAO | S029 | Human | Liver | HCC | 3.36e-05 | 5.25e-01 | 0.2581 |
| 23498 | HAAO | C46 | Human | Oral cavity | OSCC | 9.84e-04 | 1.16e-01 | 0.1673 |
| Page: 1 |
| Tissue | Expression Dynamics | Abbreviation |
| Liver |  | HCC: Hepatocellular carcinoma |
| NAFLD: Non-alcoholic fatty liver disease | ||
| Oral Cavity | 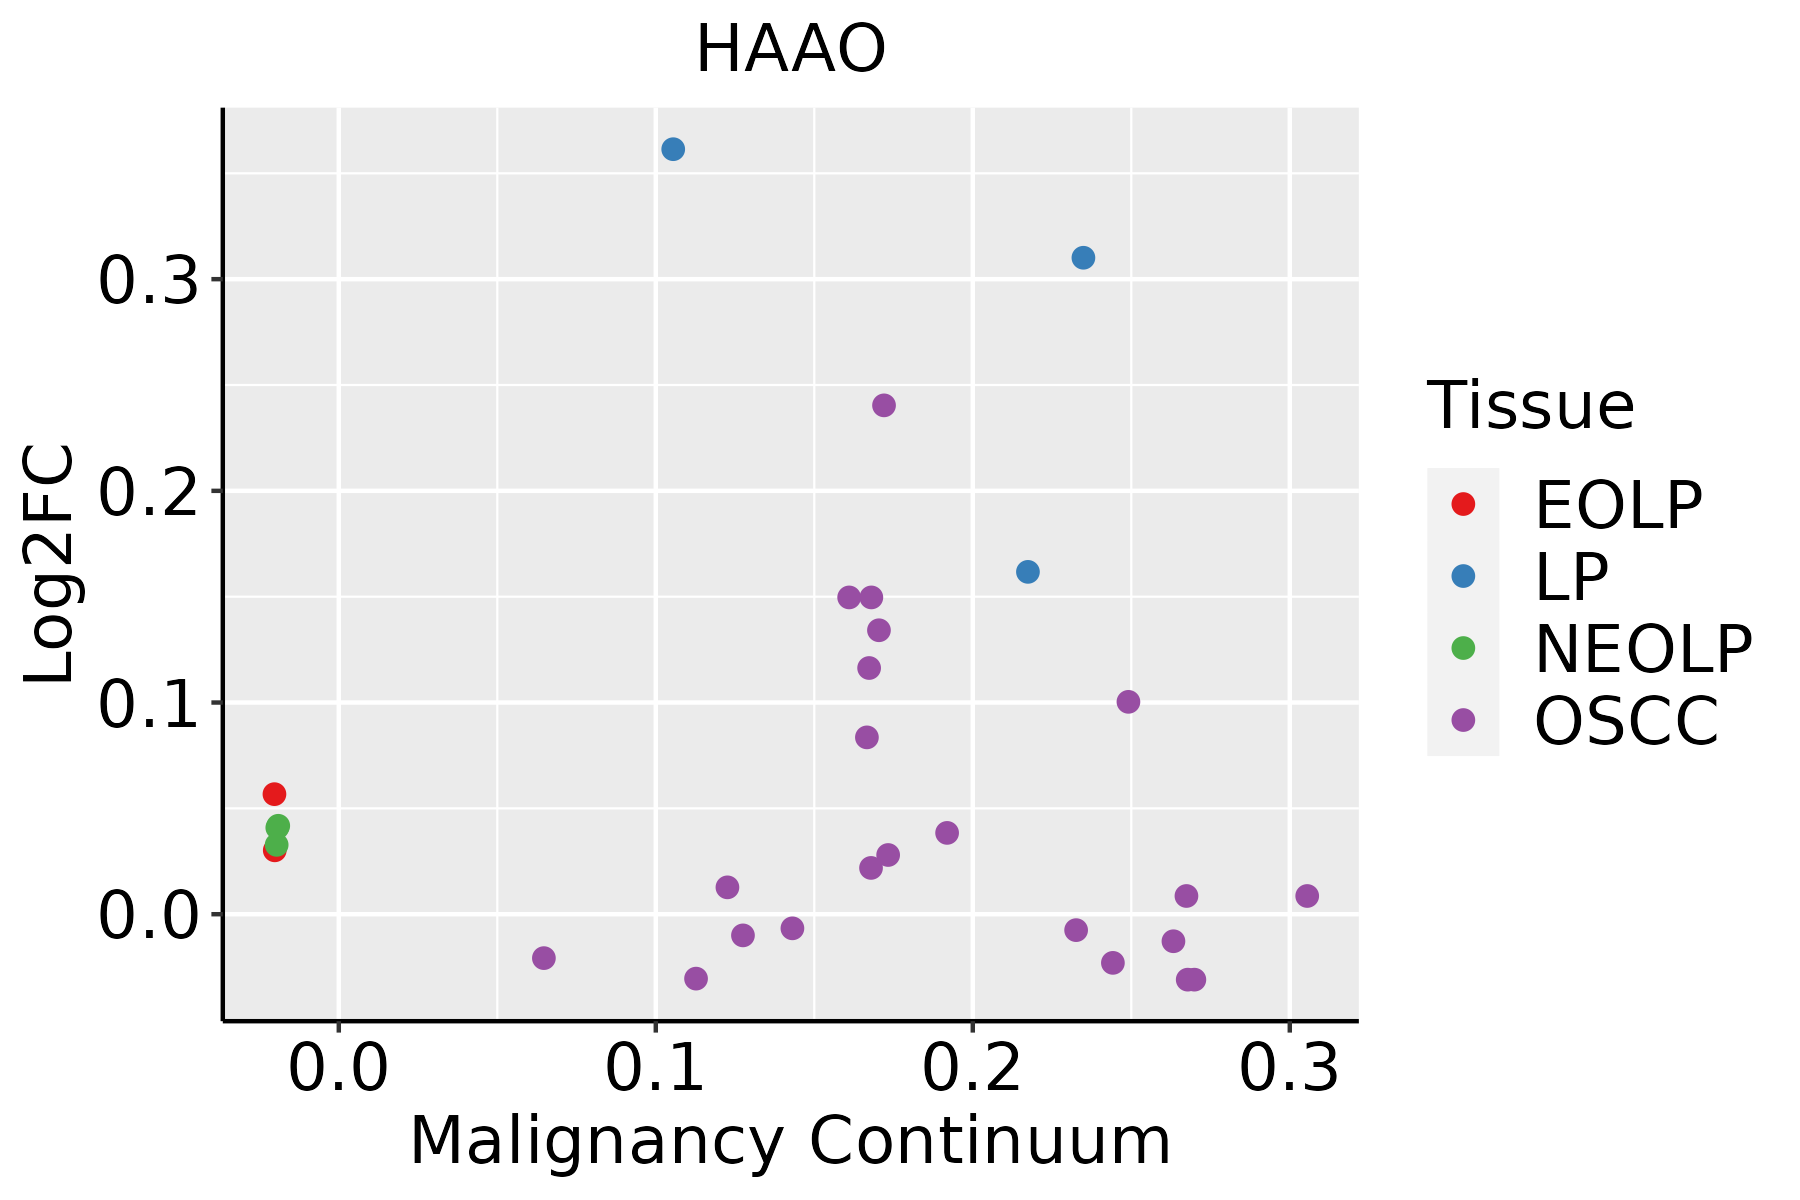 | EOLP: Erosive Oral lichen planus |
| LP: leukoplakia | ||
| NEOLP: Non-erosive oral lichen planus | ||
| OSCC: Oral squamous cell carcinoma |
| ∗log2FC in expression of this searched gene in stem-like cells from each diseased tissue sample relative to stem-like cells in normal samples in each tissue plotted against the malignancy continuum. Samples are colored based on if they are from different disease stage. |
Top |
Malignant transformation related pathway analysis |
| Find out the enriched GO biological processes and KEGG pathways involved in transition from healthy to precancer to cancer |
| Tissue | Disease Stage | Enriched GO biological Processes |
| Colorectum | AD |  |
| Colorectum | SER |  |
| Colorectum | MSS |  |
| Colorectum | MSI-H |  |
| Colorectum | FAP |  |
| ∗Top 15 enriched GO BP terms are showed in the bar plot of each disease state in each tissue. Each row represents a significant GO biological process which is colored according to the -log10(p.adjust). |
| Page: 1 2 3 4 5 6 7 8 9 |
| GO ID | Tissue | Disease Stage | Description | Gene Ratio | Bg Ratio | pvalue | p.adjust | Count |
| GO:000609112 | Liver | Cirrhotic | generation of precursor metabolites and energy | 238/4634 | 490/18723 | 6.85e-31 | 1.07e-27 | 238 |
| GO:002290012 | Liver | Cirrhotic | electron transport chain | 111/4634 | 175/18723 | 1.94e-27 | 1.52e-24 | 111 |
| GO:190136111 | Liver | Cirrhotic | organic cyclic compound catabolic process | 213/4634 | 495/18723 | 1.58e-19 | 3.67e-17 | 213 |
| GO:001943911 | Liver | Cirrhotic | aromatic compound catabolic process | 202/4634 | 467/18723 | 6.93e-19 | 1.28e-16 | 202 |
| GO:004427011 | Liver | Cirrhotic | cellular nitrogen compound catabolic process | 195/4634 | 451/18723 | 2.99e-18 | 4.94e-16 | 195 |
| GO:004670011 | Liver | Cirrhotic | heterocycle catabolic process | 192/4634 | 445/18723 | 7.17e-18 | 1.12e-15 | 192 |
| GO:001605312 | Liver | Cirrhotic | organic acid biosynthetic process | 139/4634 | 316/18723 | 4.28e-14 | 3.83e-12 | 139 |
| GO:004639412 | Liver | Cirrhotic | carboxylic acid biosynthetic process | 137/4634 | 314/18723 | 1.40e-13 | 1.14e-11 | 137 |
| GO:000675312 | Liver | Cirrhotic | nucleoside phosphate metabolic process | 190/4634 | 497/18723 | 1.10e-11 | 6.96e-10 | 190 |
| GO:000911712 | Liver | Cirrhotic | nucleotide metabolic process | 187/4634 | 489/18723 | 1.55e-11 | 9.63e-10 | 187 |
| GO:004428211 | Liver | Cirrhotic | small molecule catabolic process | 151/4634 | 376/18723 | 2.20e-11 | 1.34e-09 | 151 |
| GO:001003812 | Liver | Cirrhotic | response to metal ion | 150/4634 | 373/18723 | 2.27e-11 | 1.37e-09 | 150 |
| GO:001605411 | Liver | Cirrhotic | organic acid catabolic process | 104/4634 | 240/18723 | 1.91e-10 | 9.53e-09 | 104 |
| GO:004639511 | Liver | Cirrhotic | carboxylic acid catabolic process | 102/4634 | 236/18723 | 3.41e-10 | 1.63e-08 | 102 |
| GO:19016051 | Liver | Cirrhotic | alpha-amino acid metabolic process | 82/4634 | 195/18723 | 7.72e-08 | 2.30e-06 | 82 |
| GO:00090631 | Liver | Cirrhotic | cellular amino acid catabolic process | 49/4634 | 110/18723 | 4.47e-06 | 7.42e-05 | 49 |
| GO:004668612 | Liver | Cirrhotic | response to cadmium ion | 34/4634 | 68/18723 | 6.04e-06 | 9.74e-05 | 34 |
| GO:000652011 | Liver | Cirrhotic | cellular amino acid metabolic process | 103/4634 | 284/18723 | 8.88e-06 | 1.30e-04 | 103 |
| GO:004364811 | Liver | Cirrhotic | dicarboxylic acid metabolic process | 43/4634 | 96/18723 | 1.42e-05 | 1.97e-04 | 43 |
| GO:00091654 | Liver | Cirrhotic | nucleotide biosynthetic process | 89/4634 | 254/18723 | 1.45e-04 | 1.40e-03 | 89 |
| Page: 1 2 3 4 |
| Pathway ID | Tissue | Disease Stage | Description | Gene Ratio | Bg Ratio | pvalue | p.adjust | qvalue | Count |
| hsa01240 | Liver | Cirrhotic | Biosynthesis of cofactors | 66/2530 | 153/8465 | 3.11e-04 | 1.99e-03 | 1.23e-03 | 66 |
| hsa003802 | Liver | Cirrhotic | Tryptophan metabolism | 22/2530 | 42/8465 | 1.85e-03 | 8.37e-03 | 5.16e-03 | 22 |
| hsa012401 | Liver | Cirrhotic | Biosynthesis of cofactors | 66/2530 | 153/8465 | 3.11e-04 | 1.99e-03 | 1.23e-03 | 66 |
| hsa0038011 | Liver | Cirrhotic | Tryptophan metabolism | 22/2530 | 42/8465 | 1.85e-03 | 8.37e-03 | 5.16e-03 | 22 |
| hsa012402 | Liver | HCC | Biosynthesis of cofactors | 103/4020 | 153/8465 | 4.67e-07 | 5.05e-06 | 2.81e-06 | 103 |
| hsa012403 | Liver | HCC | Biosynthesis of cofactors | 103/4020 | 153/8465 | 4.67e-07 | 5.05e-06 | 2.81e-06 | 103 |
| Page: 1 |
Top |
Cell-cell communication analysis |
| Identification of potential cell-cell interactions between two cell types and their ligand-receptor pairs for different disease states |
| Ligand | Receptor | LRpair | Pathway | Tissue | Disease Stage |
| Page: 1 |
Top |
Single-cell gene regulatory network inference analysis |
| Find out the significant the regulons (TFs) and the target genes of each regulon across cell types for different disease states |
| TF | Cell Type | Tissue | Disease Stage | Target Gene | RSS | Regulon Activity |
| ∗The dot plots of a searched regulon are shown for all cell subpopulations in each disease state of each tissue based on the regulon specific score inferred using pySCENIC and by calculating the average expression. |
| Page: 1 |
Top |
Somatic mutation of malignant transformation related genes |
| Annotation of somatic variants for genes involved in malignant transformation |
| Hugo Symbol | Variant Class | Variant Classification | dbSNP RS | HGVSc | HGVSp | HGVSp Short | SWISSPROT | BIOTYPE | SIFT | PolyPhen | Tumor Sample Barcode | Tissue | Histology | Sex | Age | Stage | Therapy Types | Drugs | Outcome |
| HAAO | SNV | Missense_Mutation | c.753N>G | p.Asp251Glu | p.D251E | P46952 | protein_coding | tolerated(0.09) | benign(0) | TCGA-E2-A1LA-01 | Breast | breast invasive carcinoma | Female | <65 | I/II | Hormone Therapy | arimidex | SD | |
| HAAO | SNV | Missense_Mutation | c.187N>C | p.Val63Leu | p.V63L | P46952 | protein_coding | tolerated(0.1) | benign(0.005) | TCGA-E2-A1LA-01 | Breast | breast invasive carcinoma | Female | <65 | I/II | Hormone Therapy | arimidex | SD | |
| HAAO | SNV | Missense_Mutation | c.313N>A | p.Glu105Lys | p.E105K | P46952 | protein_coding | deleterious(0) | probably_damaging(1) | TCGA-DR-A0ZM-01 | Cervix | cervical & endocervical cancer | Female | <65 | III/IV | Unspecific | Cisplatin | SD | |
| HAAO | SNV | Missense_Mutation | c.432N>G | p.Ile144Met | p.I144M | P46952 | protein_coding | deleterious(0.04) | possibly_damaging(0.747) | TCGA-EA-A6QX-01 | Cervix | cervical & endocervical cancer | Female | <65 | III/IV | Unknown | Unknown | SD | |
| HAAO | SNV | Missense_Mutation | c.775N>T | p.Gly259Trp | p.G259W | P46952 | protein_coding | deleterious(0) | probably_damaging(0.923) | TCGA-AA-3842-01 | Colorectum | colon adenocarcinoma | Male | <65 | III/IV | Chemotherapy | folinic | PD | |
| HAAO | SNV | Missense_Mutation | rs759103777 | c.298N>A | p.Val100Met | p.V100M | P46952 | protein_coding | tolerated(0.17) | benign(0.299) | TCGA-AA-A01R-01 | Colorectum | colon adenocarcinoma | Male | <65 | III/IV | Chemotherapy | 5-fluorouracil | PD |
| HAAO | SNV | Missense_Mutation | c.47N>A | p.Gly16Asp | p.G16D | P46952 | protein_coding | tolerated(0.4) | benign(0) | TCGA-AZ-4315-01 | Colorectum | colon adenocarcinoma | Male | <65 | I/II | Unknown | Unknown | SD | |
| HAAO | SNV | Missense_Mutation | rs202048095 | c.733N>T | p.Arg245Cys | p.R245C | P46952 | protein_coding | tolerated(0.06) | benign(0) | TCGA-G4-6302-01 | Colorectum | colon adenocarcinoma | Female | >=65 | I/II | Unknown | Unknown | SD |
| HAAO | SNV | Missense_Mutation | novel | c.359N>C | p.Val120Ala | p.V120A | P46952 | protein_coding | deleterious(0.02) | possibly_damaging(0.6) | TCGA-AJ-A3EL-01 | Endometrium | uterine corpus endometrioid carcinoma | Female | <65 | I/II | Unknown | Unknown | SD |
| HAAO | SNV | Missense_Mutation | rs138265146 | c.232N>T | p.Arg78Trp | p.R78W | P46952 | protein_coding | deleterious(0) | probably_damaging(0.992) | TCGA-AJ-A3EL-01 | Endometrium | uterine corpus endometrioid carcinoma | Female | <65 | I/II | Unknown | Unknown | SD |
| Page: 1 2 3 4 |
Top |
Related drugs of malignant transformation related genes |
| Identification of chemicals and drugs interact with genes involved in malignant transfromation |
| (DGIdb 4.0) |
| Entrez ID | Symbol | Category | Interaction Types | Drug Claim Name | Drug Name | PMIDs |
| Page: 1 |

Copyright 2023-Present -The University of Texas Health Science Center at Houston |