
|
|||||
|
 | |
| |
| |
| |
| |
| |
|
Gene: H6PD |
Gene summary for H6PD |
| Gene information | Species | Human | Gene symbol | H6PD | Gene ID | 9563 |
| Gene name | hexose-6-phosphate dehydrogenase/glucose 1-dehydrogenase | |
| Gene Alias | CORTRD1 | |
| Cytomap | 1p36.22 | |
| Gene Type | protein-coding | GO ID | GO:0005975 | UniProtAcc | R4GMU1 |
Top |
Malignant transformation analysis |
| Identification of the aberrant gene expression in precancerous and cancerous lesions by comparing the gene expression of stem-like cells in diseased tissues with normal stem cells |
| Entrez ID | Symbol | Replicates | Species | Organ | Tissue | Adj P-value | Log2FC | Malignancy |
| 9563 | H6PD | NAFLD1 | Human | Liver | NAFLD | 6.97e-09 | 7.38e-01 | -0.04 |
| 9563 | H6PD | S43 | Human | Liver | Cirrhotic | 1.91e-09 | 1.68e-01 | -0.0187 |
| 9563 | H6PD | HCC1_Meng | Human | Liver | HCC | 4.08e-26 | -1.69e-01 | 0.0246 |
| 9563 | H6PD | HCC2_Meng | Human | Liver | HCC | 2.67e-09 | -1.72e-01 | 0.0107 |
| 9563 | H6PD | cirrhotic3 | Human | Liver | Cirrhotic | 1.40e-05 | 1.59e-01 | 0.0215 |
| 9563 | H6PD | HCC1 | Human | Liver | HCC | 1.46e-07 | 3.53e+00 | 0.5336 |
| 9563 | H6PD | HCC2 | Human | Liver | HCC | 6.84e-06 | 2.75e+00 | 0.5341 |
| 9563 | H6PD | HCC5 | Human | Liver | HCC | 2.18e-02 | 2.70e+00 | 0.4932 |
| 9563 | H6PD | Pt13.a | Human | Liver | HCC | 3.02e-05 | -2.18e-01 | 0.021 |
| 9563 | H6PD | Pt13.b | Human | Liver | HCC | 2.39e-02 | -1.33e-01 | 0.0251 |
| 9563 | H6PD | Pt14.b | Human | Liver | HCC | 2.27e-03 | 1.43e-01 | 0.018 |
| 9563 | H6PD | S015 | Human | Liver | HCC | 1.13e-05 | 4.73e-01 | 0.2375 |
| 9563 | H6PD | S016 | Human | Liver | HCC | 3.99e-03 | 2.78e-01 | 0.2243 |
| 9563 | H6PD | S027 | Human | Liver | HCC | 2.28e-03 | 6.51e-01 | 0.2446 |
| 9563 | H6PD | S028 | Human | Liver | HCC | 6.91e-11 | 6.41e-01 | 0.2503 |
| 9563 | H6PD | S029 | Human | Liver | HCC | 6.18e-16 | 8.26e-01 | 0.2581 |
| 9563 | H6PD | Dong_P1 | Human | Prostate | Tumor | 5.49e-10 | 1.04e-01 | 0.035 |
| 9563 | H6PD | Dong_P3 | Human | Prostate | Tumor | 1.85e-06 | 1.47e-01 | 0.0278 |
| 9563 | H6PD | GSM5353215_PA_AUG_PB_1B_S2 | Human | Prostate | Tumor | 8.38e-03 | 5.91e-01 | 0.1557 |
| 9563 | H6PD | GSM5353216_PA_PB1A_Pool_1_3_S50_L002 | Human | Prostate | Tumor | 2.30e-02 | 5.44e-01 | 0.159 |
| Page: 1 2 3 |
| Tissue | Expression Dynamics | Abbreviation |
| Liver | 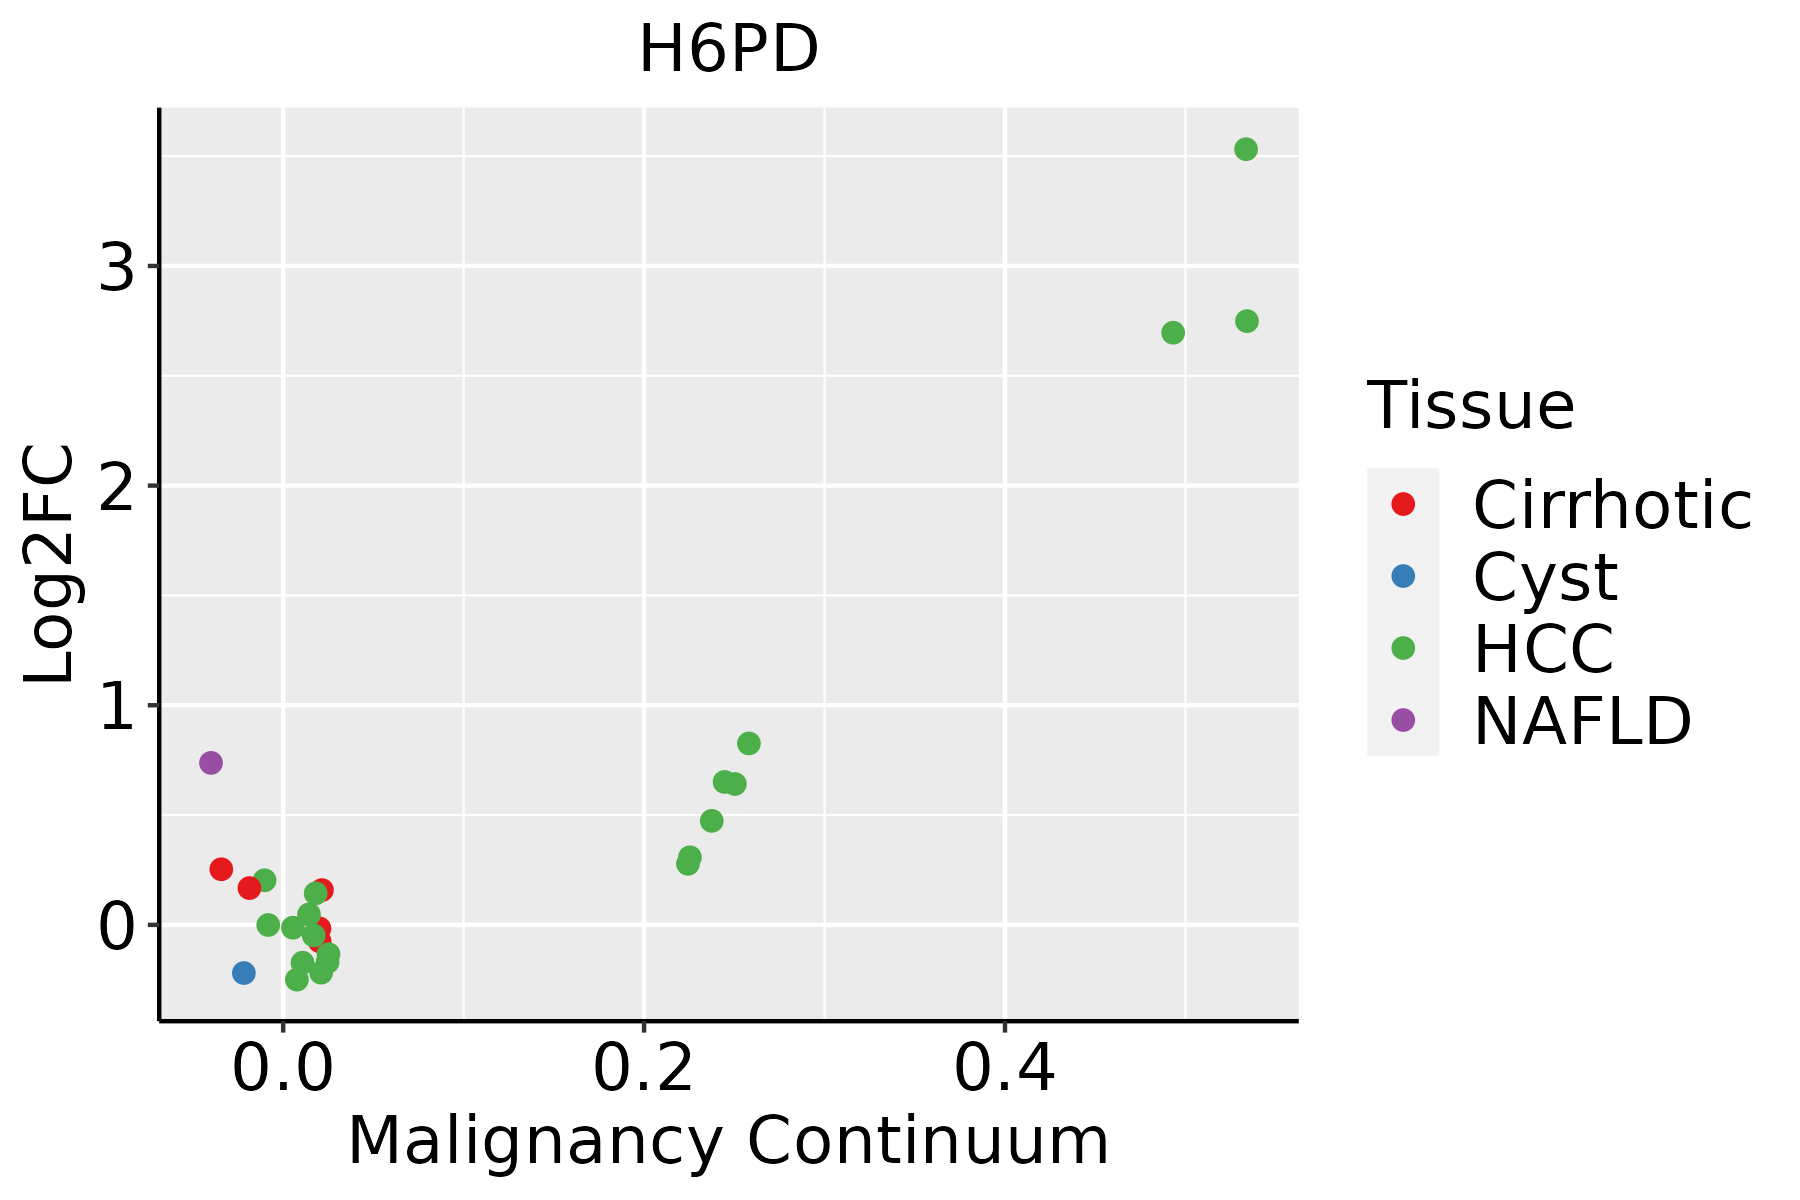 | HCC: Hepatocellular carcinoma |
| NAFLD: Non-alcoholic fatty liver disease | ||
| Prostate |  | BPH: Benign Prostatic Hyperplasia |
| Thyroid | 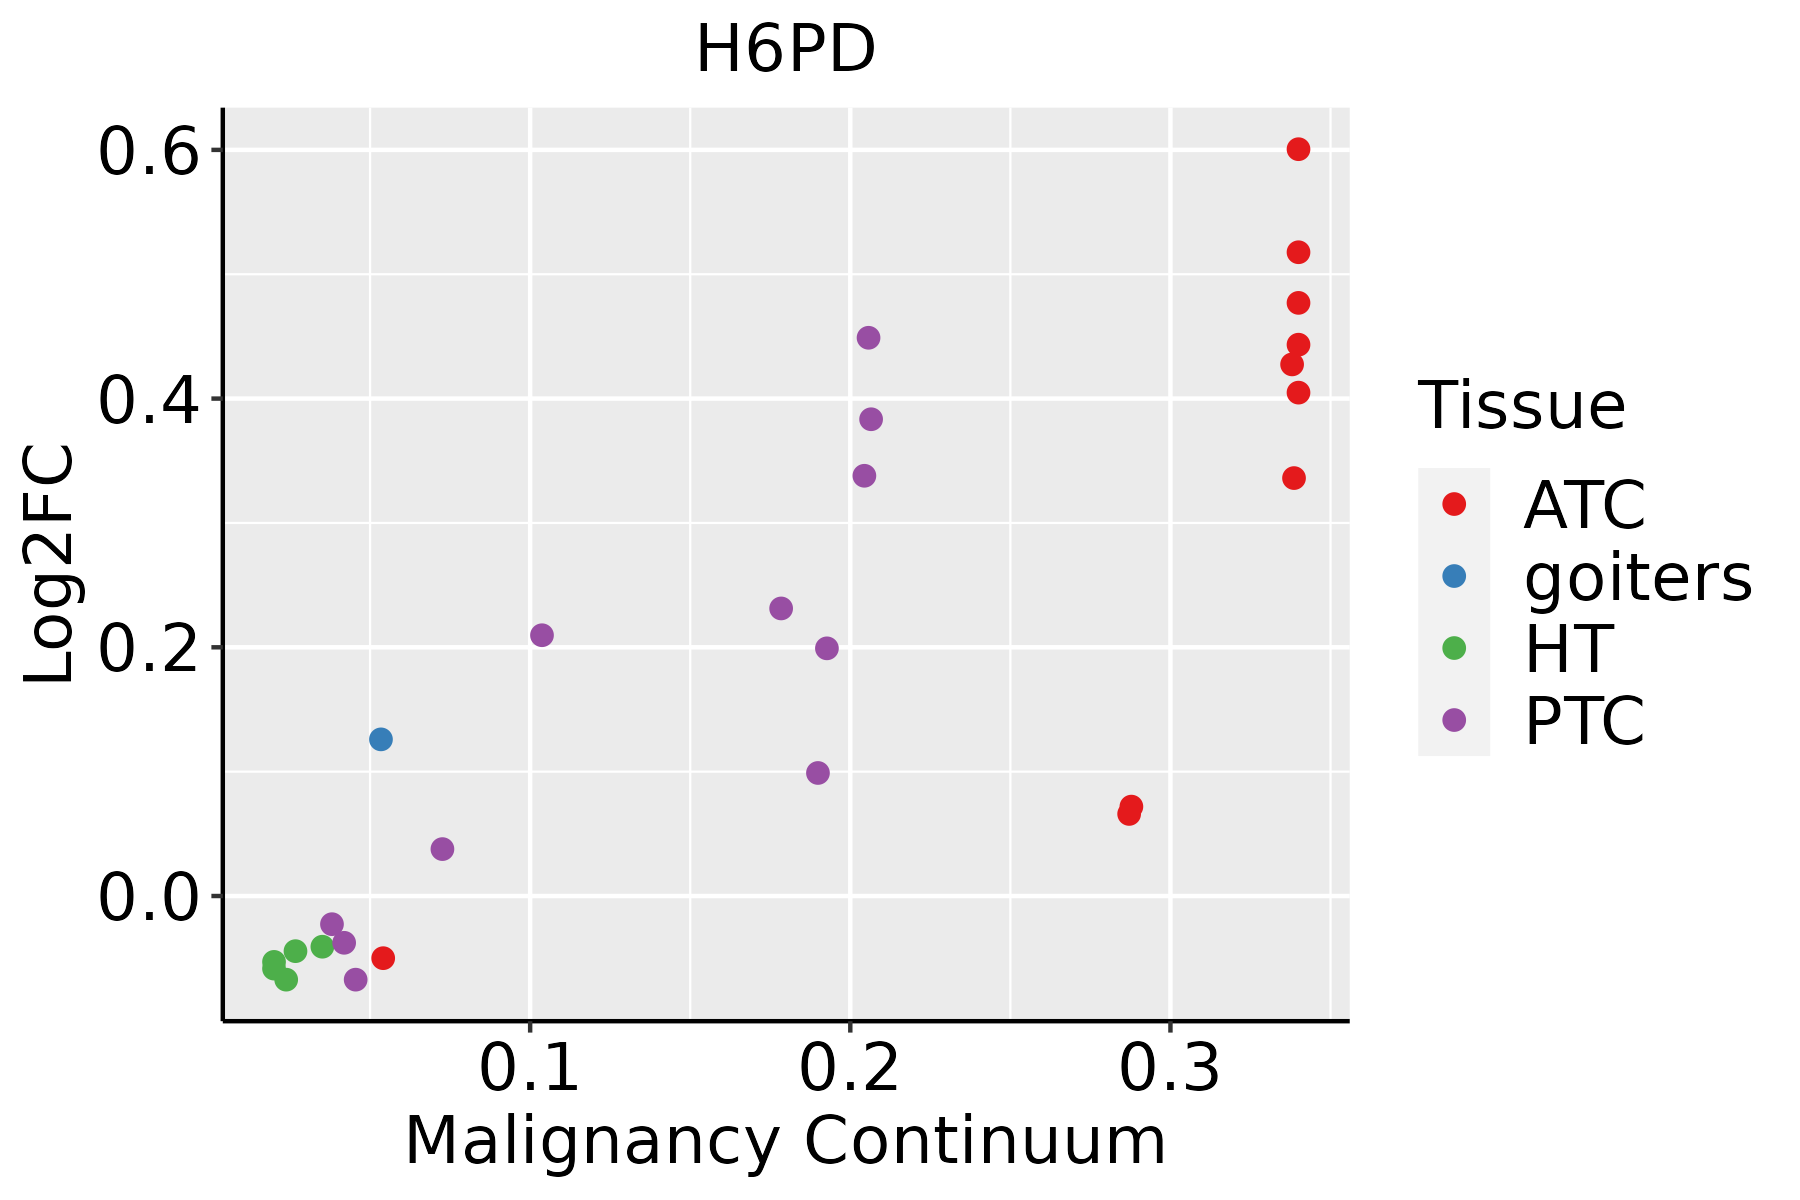 | ATC: Anaplastic thyroid cancer |
| HT: Hashimoto's thyroiditis | ||
| PTC: Papillary thyroid cancer |
| ∗log2FC in expression of this searched gene in stem-like cells from each diseased tissue sample relative to stem-like cells in normal samples in each tissue plotted against the malignancy continuum. Samples are colored based on if they are from different disease stage. |
Top |
Malignant transformation related pathway analysis |
| Find out the enriched GO biological processes and KEGG pathways involved in transition from healthy to precancer to cancer |
| Tissue | Disease Stage | Enriched GO biological Processes |
| Colorectum | AD |  |
| Colorectum | SER |  |
| Colorectum | MSS |  |
| Colorectum | MSI-H |  |
| Colorectum | FAP |  |
| ∗Top 15 enriched GO BP terms are showed in the bar plot of each disease state in each tissue. Each row represents a significant GO biological process which is colored according to the -log10(p.adjust). |
| Page: 1 2 3 4 5 6 7 8 9 |
| GO ID | Tissue | Disease Stage | Description | Gene Ratio | Bg Ratio | pvalue | p.adjust | Count |
| GO:00082023 | Liver | NAFLD | steroid metabolic process | 69/1882 | 319/18723 | 5.90e-10 | 1.28e-07 | 69 |
| GO:00059965 | Liver | NAFLD | monosaccharide metabolic process | 53/1882 | 257/18723 | 2.89e-07 | 1.92e-05 | 53 |
| GO:00620125 | Liver | NAFLD | regulation of small molecule metabolic process | 63/1882 | 334/18723 | 6.55e-07 | 3.79e-05 | 63 |
| GO:00060917 | Liver | NAFLD | generation of precursor metabolites and energy | 84/1882 | 490/18723 | 7.03e-07 | 3.95e-05 | 84 |
| GO:00193185 | Liver | NAFLD | hexose metabolic process | 49/1882 | 237/18723 | 7.41e-07 | 4.12e-05 | 49 |
| GO:00060065 | Liver | NAFLD | glucose metabolic process | 42/1882 | 196/18723 | 1.70e-06 | 7.47e-05 | 42 |
| GO:00192163 | Liver | NAFLD | regulation of lipid metabolic process | 61/1882 | 331/18723 | 2.18e-06 | 9.24e-05 | 61 |
| GO:00060666 | Liver | NAFLD | alcohol metabolic process | 62/1882 | 353/18723 | 9.01e-06 | 2.96e-04 | 62 |
| GO:00066943 | Liver | NAFLD | steroid biosynthetic process | 34/1882 | 173/18723 | 1.01e-04 | 2.02e-03 | 34 |
| GO:00192183 | Liver | NAFLD | regulation of steroid metabolic process | 22/1882 | 100/18723 | 3.22e-04 | 4.98e-03 | 22 |
| GO:00468903 | Liver | NAFLD | regulation of lipid biosynthetic process | 32/1882 | 171/18723 | 4.03e-04 | 5.99e-03 | 32 |
| GO:00973056 | Liver | NAFLD | response to alcohol | 42/1882 | 253/18723 | 7.91e-04 | 9.89e-03 | 42 |
| GO:01202545 | Liver | NAFLD | olefinic compound metabolic process | 28/1882 | 153/18723 | 1.28e-03 | 1.45e-02 | 28 |
| GO:00105653 | Liver | NAFLD | regulation of cellular ketone metabolic process | 25/1882 | 133/18723 | 1.54e-03 | 1.66e-02 | 25 |
| GO:00424452 | Liver | NAFLD | hormone metabolic process | 36/1882 | 218/18723 | 1.98e-03 | 1.98e-02 | 36 |
| GO:00421803 | Liver | NAFLD | cellular ketone metabolic process | 35/1882 | 211/18723 | 2.09e-03 | 2.06e-02 | 35 |
| GO:1901617 | Liver | NAFLD | organic hydroxy compound biosynthetic process | 37/1882 | 237/18723 | 4.58e-03 | 3.68e-02 | 37 |
| GO:000609112 | Liver | Cirrhotic | generation of precursor metabolites and energy | 238/4634 | 490/18723 | 6.85e-31 | 1.07e-27 | 238 |
| GO:000820211 | Liver | Cirrhotic | steroid metabolic process | 143/4634 | 319/18723 | 2.79e-15 | 3.18e-13 | 143 |
| GO:000606612 | Liver | Cirrhotic | alcohol metabolic process | 141/4634 | 353/18723 | 1.57e-10 | 8.03e-09 | 141 |
| Page: 1 2 3 4 5 |
| Pathway ID | Tissue | Disease Stage | Description | Gene Ratio | Bg Ratio | pvalue | p.adjust | qvalue | Count |
| hsa0120010 | Liver | NAFLD | Carbon metabolism | 26/1043 | 115/8465 | 1.39e-03 | 1.71e-02 | 1.38e-02 | 26 |
| hsa0120011 | Liver | NAFLD | Carbon metabolism | 26/1043 | 115/8465 | 1.39e-03 | 1.71e-02 | 1.38e-02 | 26 |
| hsa0120021 | Liver | Cirrhotic | Carbon metabolism | 64/2530 | 115/8465 | 6.37e-09 | 1.18e-07 | 7.26e-08 | 64 |
| hsa00030 | Liver | Cirrhotic | Pentose phosphate pathway | 16/2530 | 30/8465 | 6.04e-03 | 2.12e-02 | 1.30e-02 | 16 |
| hsa0120031 | Liver | Cirrhotic | Carbon metabolism | 64/2530 | 115/8465 | 6.37e-09 | 1.18e-07 | 7.26e-08 | 64 |
| hsa000301 | Liver | Cirrhotic | Pentose phosphate pathway | 16/2530 | 30/8465 | 6.04e-03 | 2.12e-02 | 1.30e-02 | 16 |
| hsa0120041 | Liver | HCC | Carbon metabolism | 89/4020 | 115/8465 | 3.92e-11 | 6.56e-10 | 3.65e-10 | 89 |
| hsa000302 | Liver | HCC | Pentose phosphate pathway | 21/4020 | 30/8465 | 1.06e-02 | 2.71e-02 | 1.51e-02 | 21 |
| hsa0120051 | Liver | HCC | Carbon metabolism | 89/4020 | 115/8465 | 3.92e-11 | 6.56e-10 | 3.65e-10 | 89 |
| hsa000303 | Liver | HCC | Pentose phosphate pathway | 21/4020 | 30/8465 | 1.06e-02 | 2.71e-02 | 1.51e-02 | 21 |
| Page: 1 |
Top |
Cell-cell communication analysis |
| Identification of potential cell-cell interactions between two cell types and their ligand-receptor pairs for different disease states |
| Ligand | Receptor | LRpair | Pathway | Tissue | Disease Stage |
| Page: 1 |
Top |
Single-cell gene regulatory network inference analysis |
| Find out the significant the regulons (TFs) and the target genes of each regulon across cell types for different disease states |
| TF | Cell Type | Tissue | Disease Stage | Target Gene | RSS | Regulon Activity |
| ∗The dot plots of a searched regulon are shown for all cell subpopulations in each disease state of each tissue based on the regulon specific score inferred using pySCENIC and by calculating the average expression. |
| Page: 1 |
Top |
Somatic mutation of malignant transformation related genes |
| Annotation of somatic variants for genes involved in malignant transformation |
| Hugo Symbol | Variant Class | Variant Classification | dbSNP RS | HGVSc | HGVSp | HGVSp Short | SWISSPROT | BIOTYPE | SIFT | PolyPhen | Tumor Sample Barcode | Tissue | Histology | Sex | Age | Stage | Therapy Types | Drugs | Outcome |
| H6PD | SNV | Missense_Mutation | c.827N>C | p.Gln276Pro | p.Q276P | protein_coding | deleterious(0) | probably_damaging(0.97) | TCGA-A8-A075-01 | Breast | breast invasive carcinoma | Female | <65 | I/II | Chemotherapy | epirubicin | CR | ||
| H6PD | insertion | In_Frame_Ins | novel | c.348_349insAGCCACCGCTACAGGGGATGCAGGGCAACCGTGAGA | p.Ser117_Gln118insHisArgTyrArgGlyCysArgAlaThrValArgSer | p.S117_Q118insHRYRGCRATVRS | protein_coding | TCGA-B6-A0RI-01 | Breast | breast invasive carcinoma | Female | <65 | III/IV | Unknown | Unknown | PD | |||
| H6PD | SNV | Missense_Mutation | rs200049650 | c.805G>A | p.Gly269Ser | p.G269S | protein_coding | deleterious(0) | probably_damaging(0.969) | TCGA-2W-A8YY-01 | Cervix | cervical & endocervical cancer | Female | <65 | I/II | Chemotherapy | cisplatin | CR | |
| H6PD | SNV | Missense_Mutation | novel | c.1185G>T | p.Lys395Asn | p.K395N | protein_coding | tolerated(0.51) | benign(0.088) | TCGA-2W-A8YY-01 | Cervix | cervical & endocervical cancer | Female | <65 | I/II | Chemotherapy | cisplatin | CR | |
| H6PD | SNV | Missense_Mutation | novel | c.1566G>C | p.Leu522Phe | p.L522F | protein_coding | deleterious(0) | probably_damaging(1) | TCGA-C5-A7XC-01 | Cervix | cervical & endocervical cancer | Female | <65 | I/II | Unknown | Unknown | SD | |
| H6PD | SNV | Missense_Mutation | rs565031451 | c.1747G>A | p.Glu583Lys | p.E583K | protein_coding | tolerated(0.25) | benign(0.157) | TCGA-FU-A3TQ-01 | Cervix | cervical & endocervical cancer | Female | <65 | III/IV | Unknown | Unknown | SD | |
| H6PD | SNV | Missense_Mutation | rs759193407 | c.775N>A | p.Glu259Lys | p.E259K | protein_coding | tolerated(1) | benign(0.018) | TCGA-MA-AA41-01 | Cervix | cervical & endocervical cancer | Female | <65 | I/II | Unknown | Unknown | SD | |
| H6PD | SNV | Missense_Mutation | novel | c.950N>T | p.Gly317Val | p.G317V | protein_coding | tolerated(0.16) | benign(0.339) | TCGA-VS-A9UQ-01 | Cervix | cervical & endocervical cancer | Female | <65 | I/II | Unknown | Unknown | PD | |
| H6PD | SNV | Missense_Mutation | rs149081812 | c.817N>A | p.Asp273Asn | p.D273N | protein_coding | deleterious(0) | probably_damaging(0.947) | TCGA-AA-3877-01 | Colorectum | colon adenocarcinoma | Female | >=65 | I/II | Unknown | Unknown | SD | |
| H6PD | SNV | Missense_Mutation | rs371234309 | c.1396N>T | p.Arg466Trp | p.R466W | protein_coding | deleterious(0.01) | benign(0.029) | TCGA-AA-3947-01 | Colorectum | colon adenocarcinoma | Female | <65 | I/II | Unknown | Unknown | SD |
| Page: 1 2 3 4 5 6 7 |
Top |
Related drugs of malignant transformation related genes |
| Identification of chemicals and drugs interact with genes involved in malignant transfromation |
| (DGIdb 4.0) |
| Entrez ID | Symbol | Category | Interaction Types | Drug Claim Name | Drug Name | PMIDs |
| Page: 1 |

Copyright 2023-Present -The University of Texas Health Science Center at Houston |