
|
|||||
|
 | |
| |
| |
| |
| |
| |
|
Gene: H3F3A |
Gene summary for H3F3A |
| Gene information | Species | Human | Gene symbol | H3F3A | Gene ID | 3020 |
| Gene name | H3.3 histone A | |
| Gene Alias | H3-3B | |
| Cytomap | 1q42.12 | |
| Gene Type | protein-coding | GO ID | GO:0001558 | UniProtAcc | B2R4P9 |
Top |
Malignant transformation analysis |
| Identification of the aberrant gene expression in precancerous and cancerous lesions by comparing the gene expression of stem-like cells in diseased tissues with normal stem cells |
| Entrez ID | Symbol | Replicates | Species | Organ | Tissue | Adj P-value | Log2FC | Malignancy |
| 3020 | H3F3A | GSM4909281 | Human | Breast | IDC | 2.86e-43 | 3.59e-01 | 0.21 |
| 3020 | H3F3A | GSM4909282 | Human | Breast | IDC | 1.42e-72 | 4.48e-01 | -0.0288 |
| 3020 | H3F3A | GSM4909285 | Human | Breast | IDC | 5.47e-139 | 6.42e-01 | 0.21 |
| 3020 | H3F3A | GSM4909286 | Human | Breast | IDC | 3.32e-17 | 2.76e-01 | 0.1081 |
| 3020 | H3F3A | GSM4909287 | Human | Breast | IDC | 3.52e-32 | 2.03e-01 | 0.2057 |
| 3020 | H3F3A | GSM4909288 | Human | Breast | IDC | 1.87e-14 | 3.19e-01 | 0.0988 |
| 3020 | H3F3A | GSM4909289 | Human | Breast | IDC | 9.58e-10 | 3.28e-01 | 0.1064 |
| 3020 | H3F3A | GSM4909290 | Human | Breast | IDC | 1.76e-28 | 3.24e-01 | 0.2096 |
| 3020 | H3F3A | GSM4909293 | Human | Breast | IDC | 5.23e-105 | 5.88e-01 | 0.1581 |
| 3020 | H3F3A | GSM4909294 | Human | Breast | IDC | 1.68e-66 | 4.27e-01 | 0.2022 |
| 3020 | H3F3A | GSM4909295 | Human | Breast | IDC | 1.32e-07 | 1.47e-01 | 0.0898 |
| 3020 | H3F3A | GSM4909296 | Human | Breast | IDC | 6.28e-24 | 2.31e-01 | 0.1524 |
| 3020 | H3F3A | GSM4909297 | Human | Breast | IDC | 2.08e-35 | 1.53e-01 | 0.1517 |
| 3020 | H3F3A | GSM4909298 | Human | Breast | IDC | 5.66e-50 | 3.92e-01 | 0.1551 |
| 3020 | H3F3A | GSM4909301 | Human | Breast | IDC | 9.87e-43 | 3.76e-01 | 0.1577 |
| 3020 | H3F3A | GSM4909302 | Human | Breast | IDC | 2.55e-23 | 2.08e-01 | 0.1545 |
| 3020 | H3F3A | GSM4909303 | Human | Breast | IDC | 1.26e-06 | 2.81e-01 | 0.0438 |
| 3020 | H3F3A | GSM4909304 | Human | Breast | IDC | 1.08e-03 | 1.64e-01 | 0.1636 |
| 3020 | H3F3A | GSM4909305 | Human | Breast | IDC | 6.15e-05 | 1.92e-01 | 0.0436 |
| 3020 | H3F3A | GSM4909306 | Human | Breast | IDC | 2.06e-26 | 3.10e-01 | 0.1564 |
| Page: 1 2 3 4 5 6 7 8 9 10 11 12 13 14 15 16 17 18 19 |
| Tissue | Expression Dynamics | Abbreviation |
| Breast | 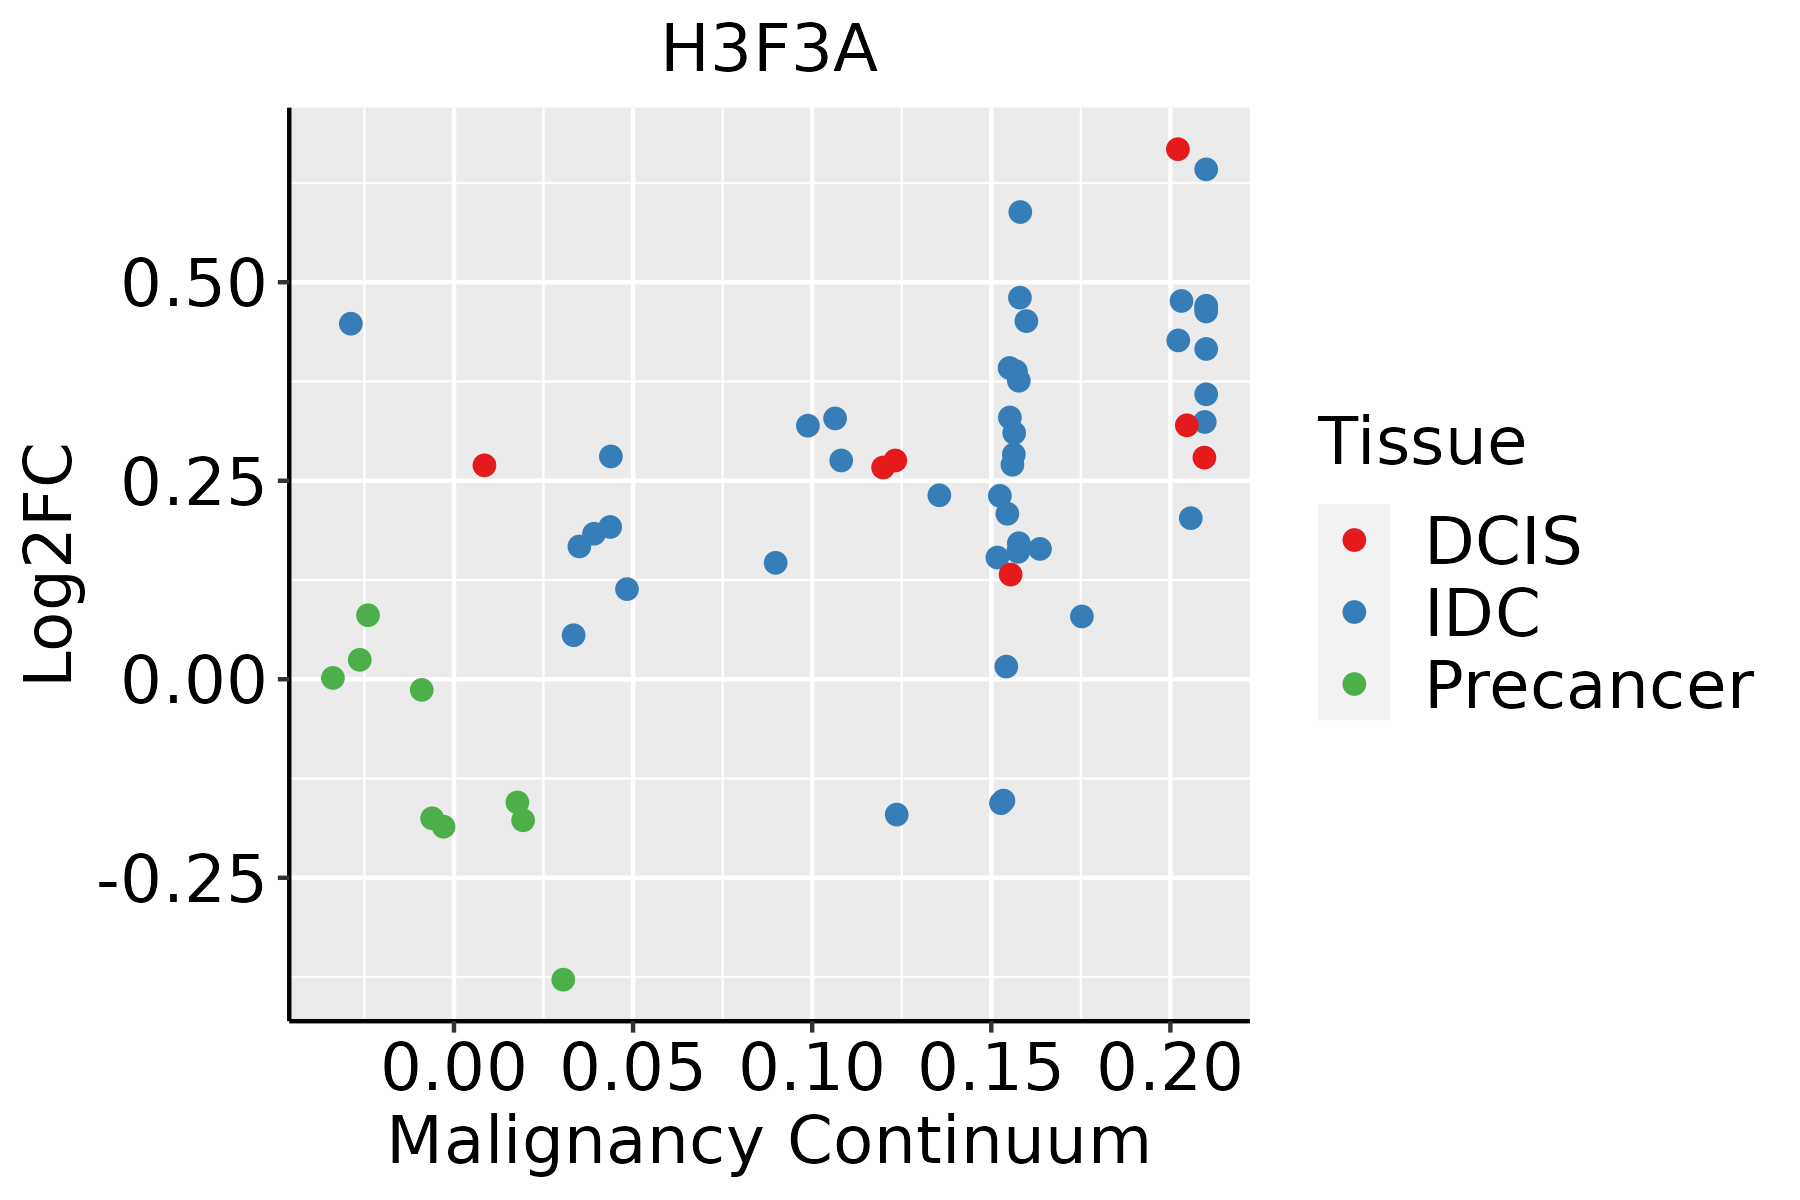 | IDC: Invasive ductal carcinoma |
| DCIS: Ductal carcinoma in situ | ||
| Precancer(BRCA1-mut): Precancerous lesion from BRCA1 mutation carriers | ||
| Cervix | 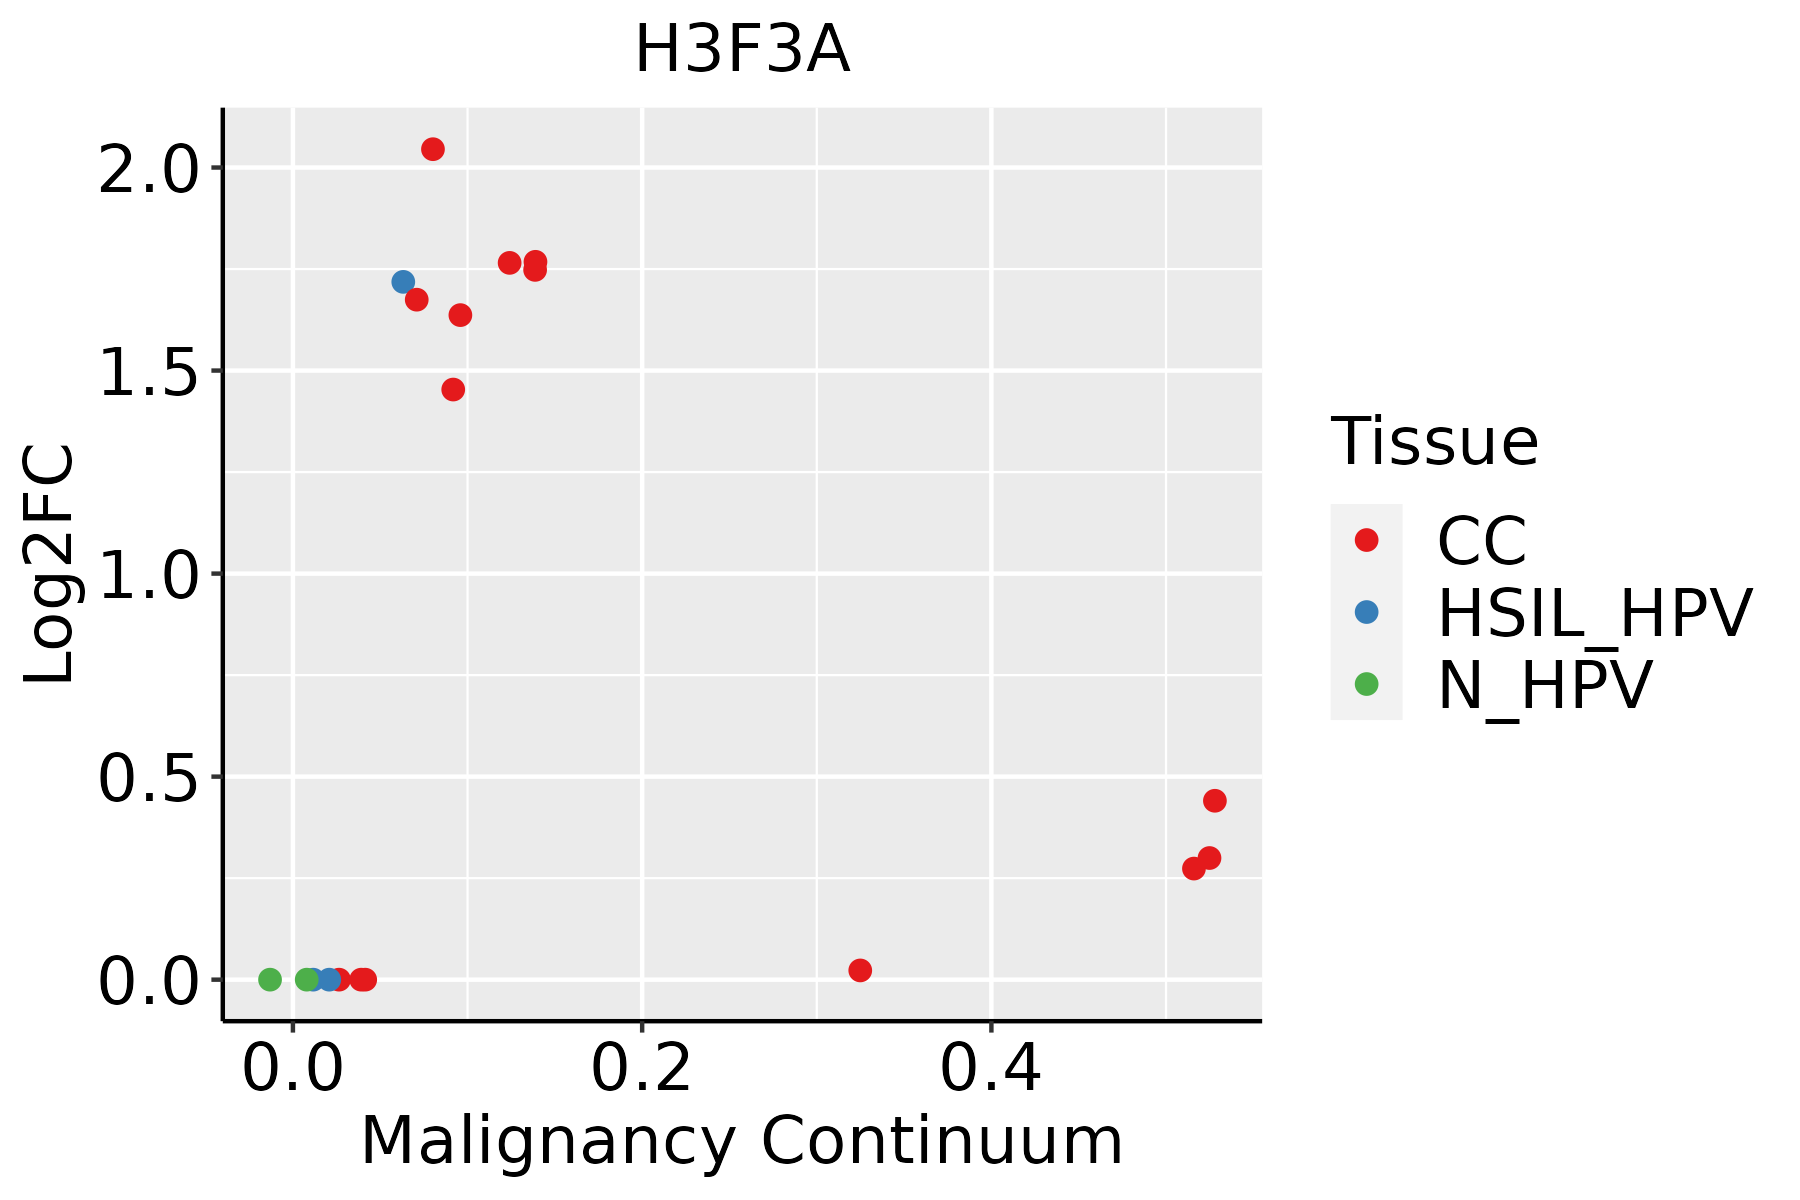 | CC: Cervix cancer |
| HSIL_HPV: HPV-infected high-grade squamous intraepithelial lesions | ||
| N_HPV: HPV-infected normal cervix | ||
| Colorectum (GSE201348) |  | FAP: Familial adenomatous polyposis |
| CRC: Colorectal cancer | ||
| Colorectum (HTA11) |  | AD: Adenomas |
| SER: Sessile serrated lesions | ||
| MSI-H: Microsatellite-high colorectal cancer | ||
| MSS: Microsatellite stable colorectal cancer | ||
| Endometrium | 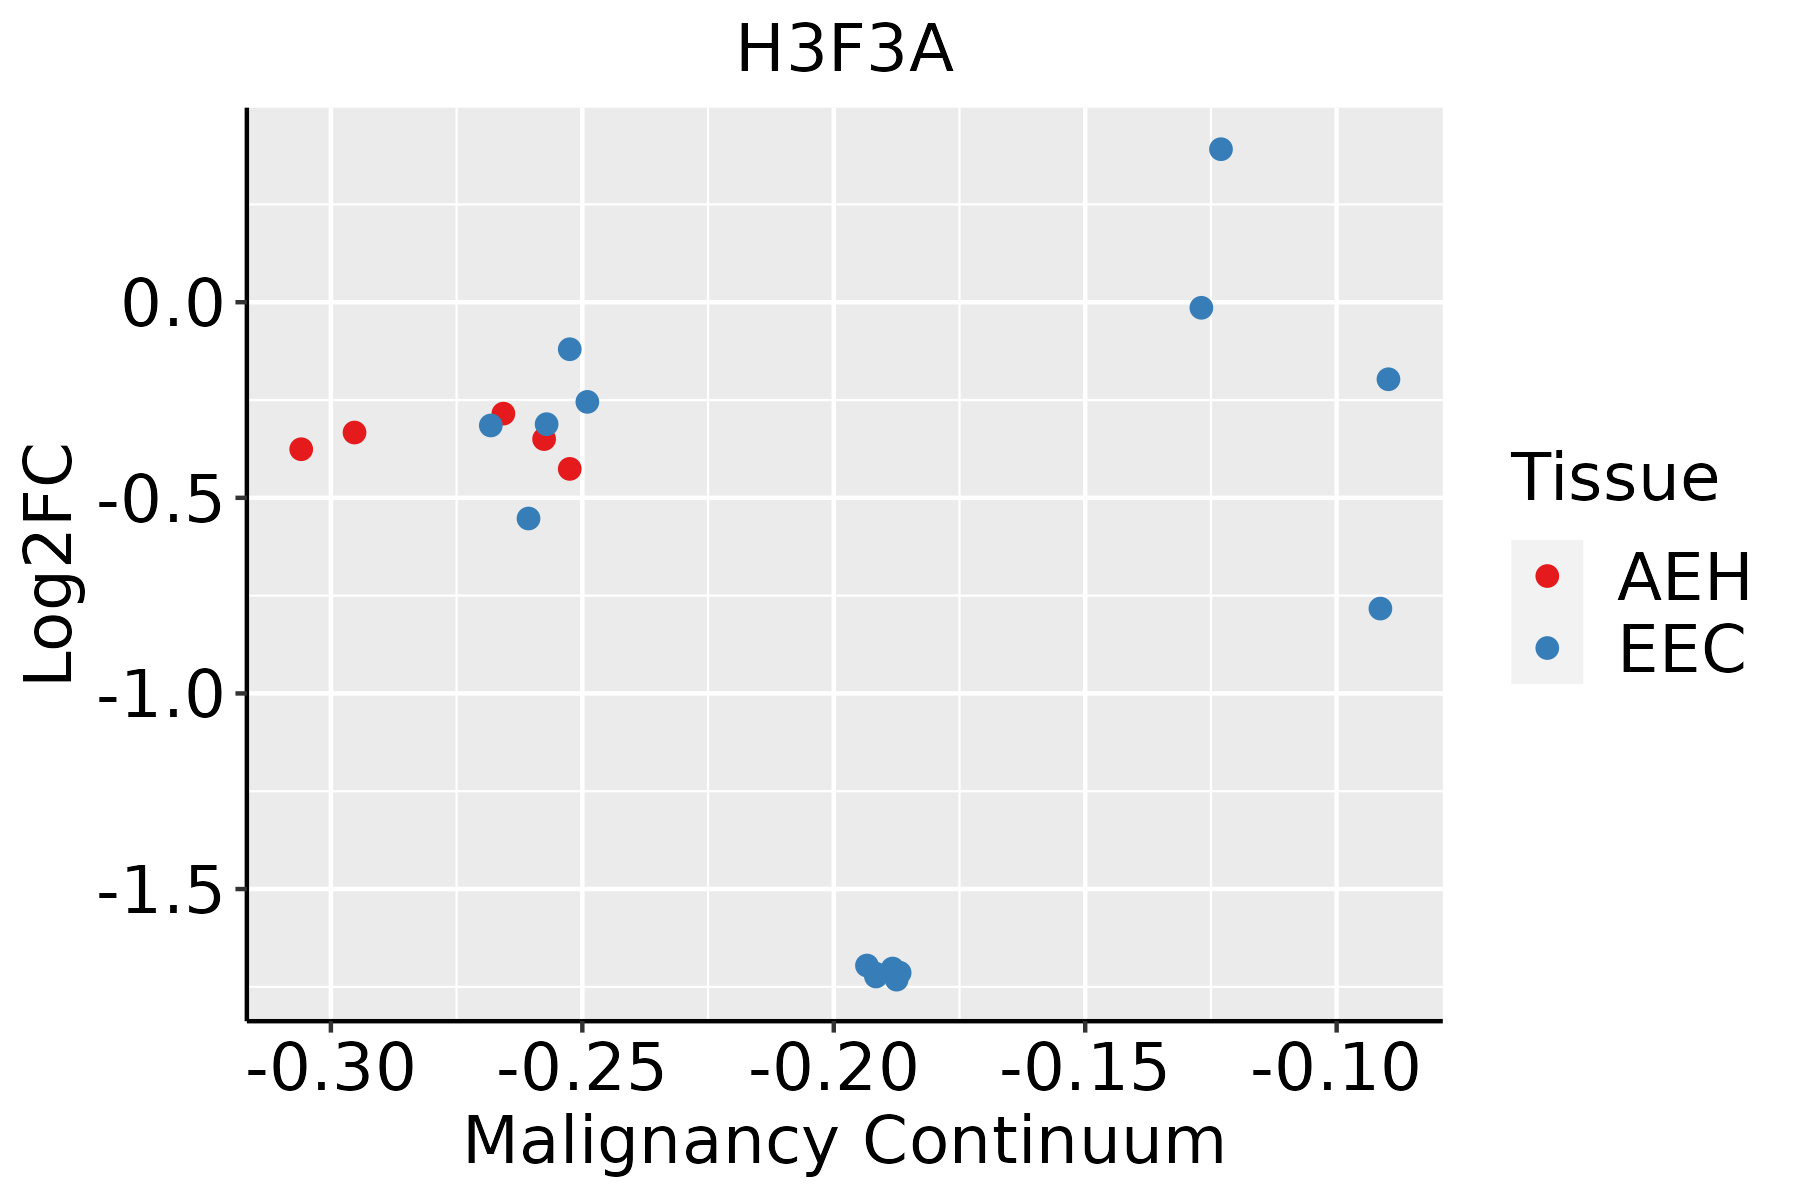 | AEH: Atypical endometrial hyperplasia |
| EEC: Endometrioid Cancer | ||
| Esophagus |  | ESCC: Esophageal squamous cell carcinoma |
| HGIN: High-grade intraepithelial neoplasias | ||
| LGIN: Low-grade intraepithelial neoplasias | ||
| GC | 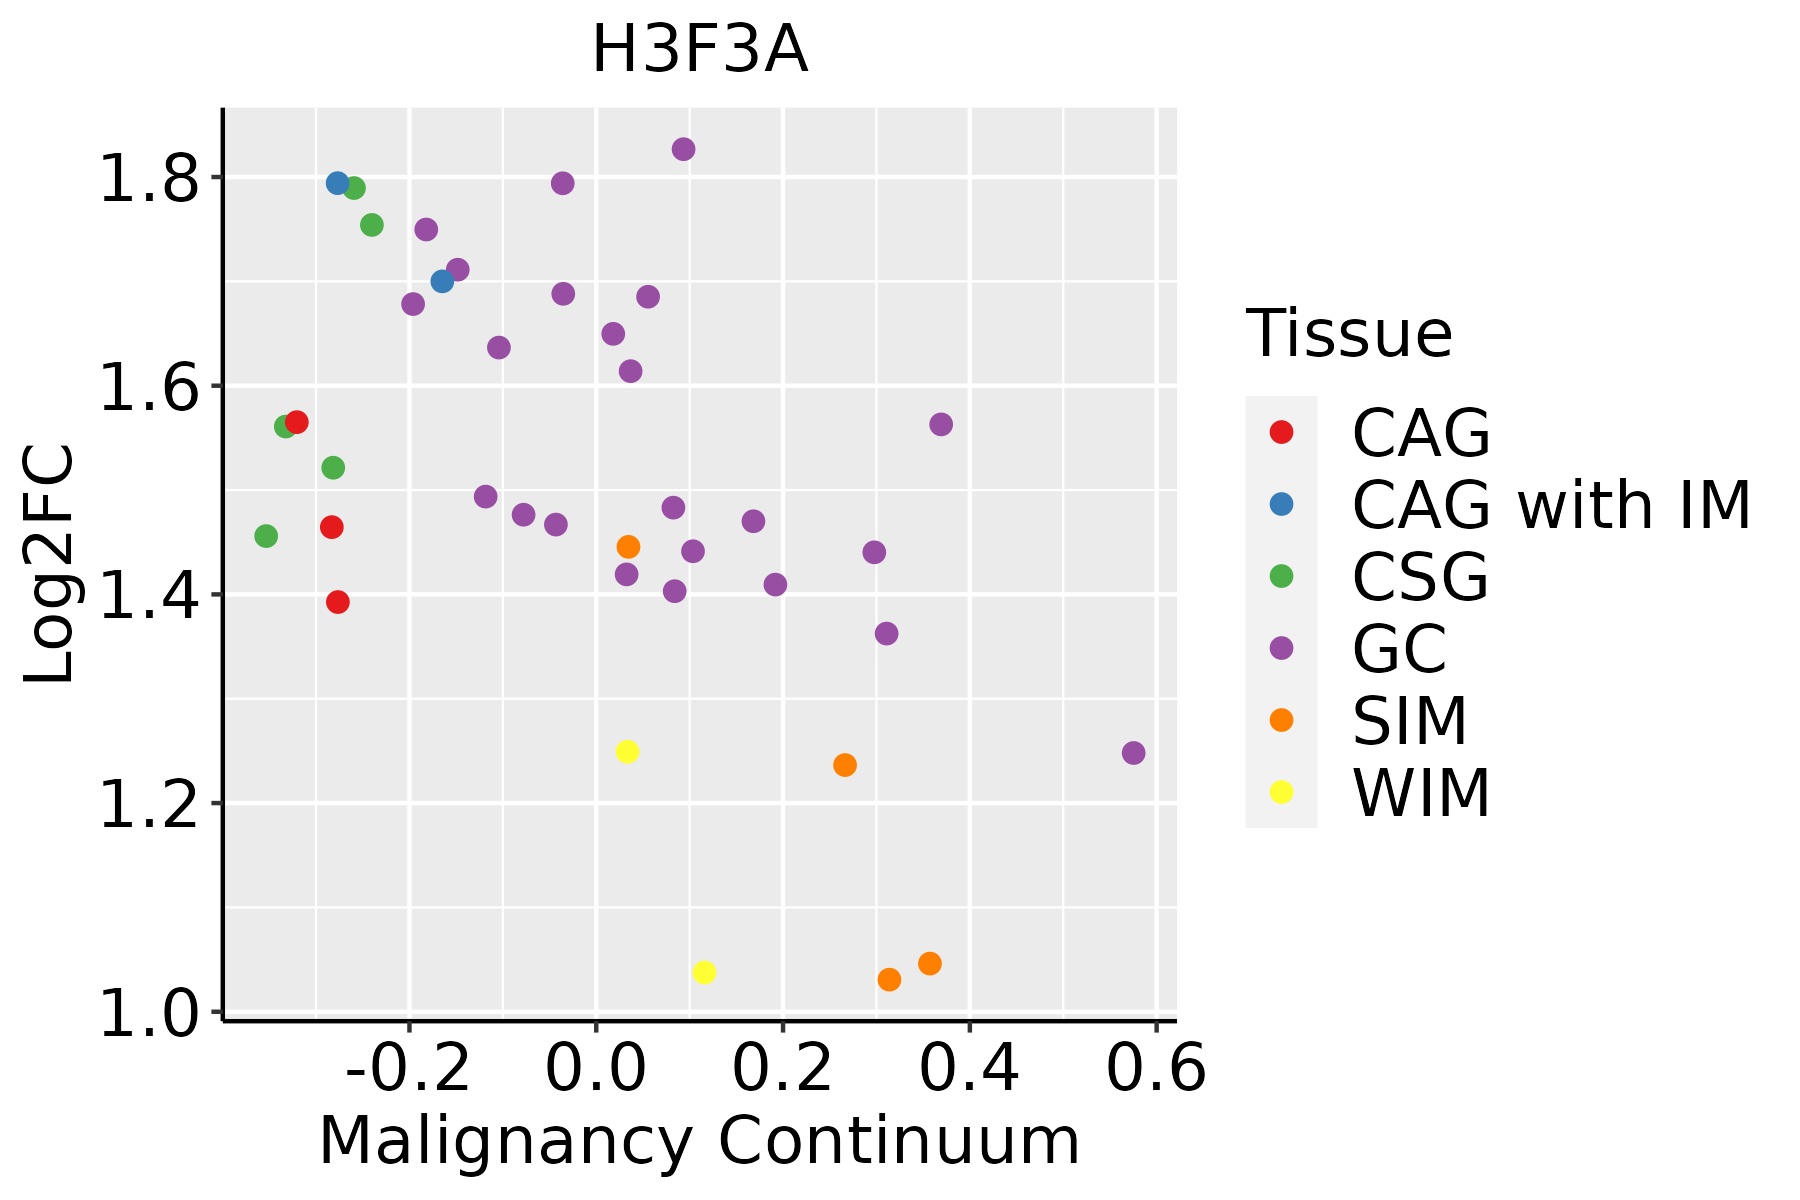 | CAG: Chronic atrophic gastritis |
| CAG with IM: Chronic atrophic gastritis with intestinal metaplasia | ||
| CSG: Chronic superficial gastritis | ||
| GC: Gastric cancer | ||
| SIM: Severe intestinal metaplasia | ||
| WIM: Wild intestinal metaplasia | ||
| Liver | 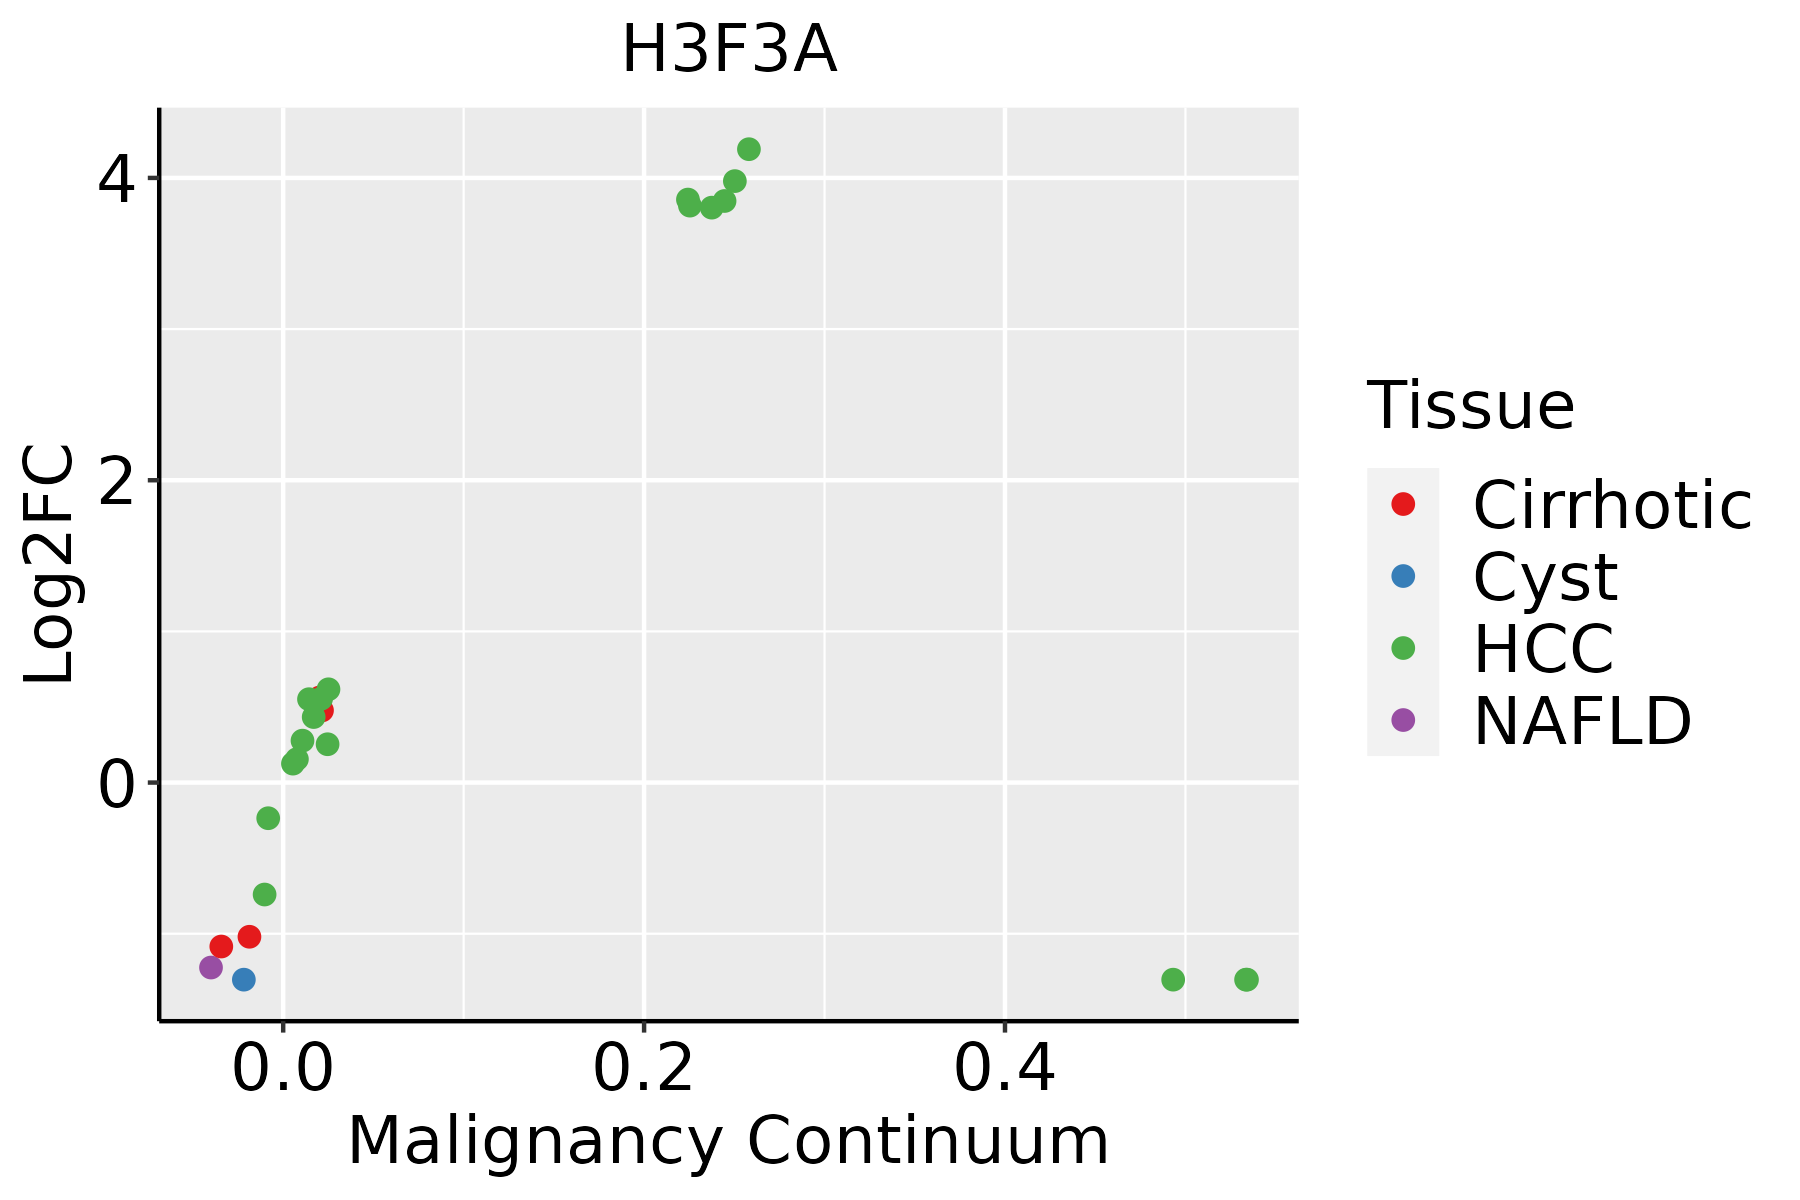 | HCC: Hepatocellular carcinoma |
| NAFLD: Non-alcoholic fatty liver disease | ||
| Lung | 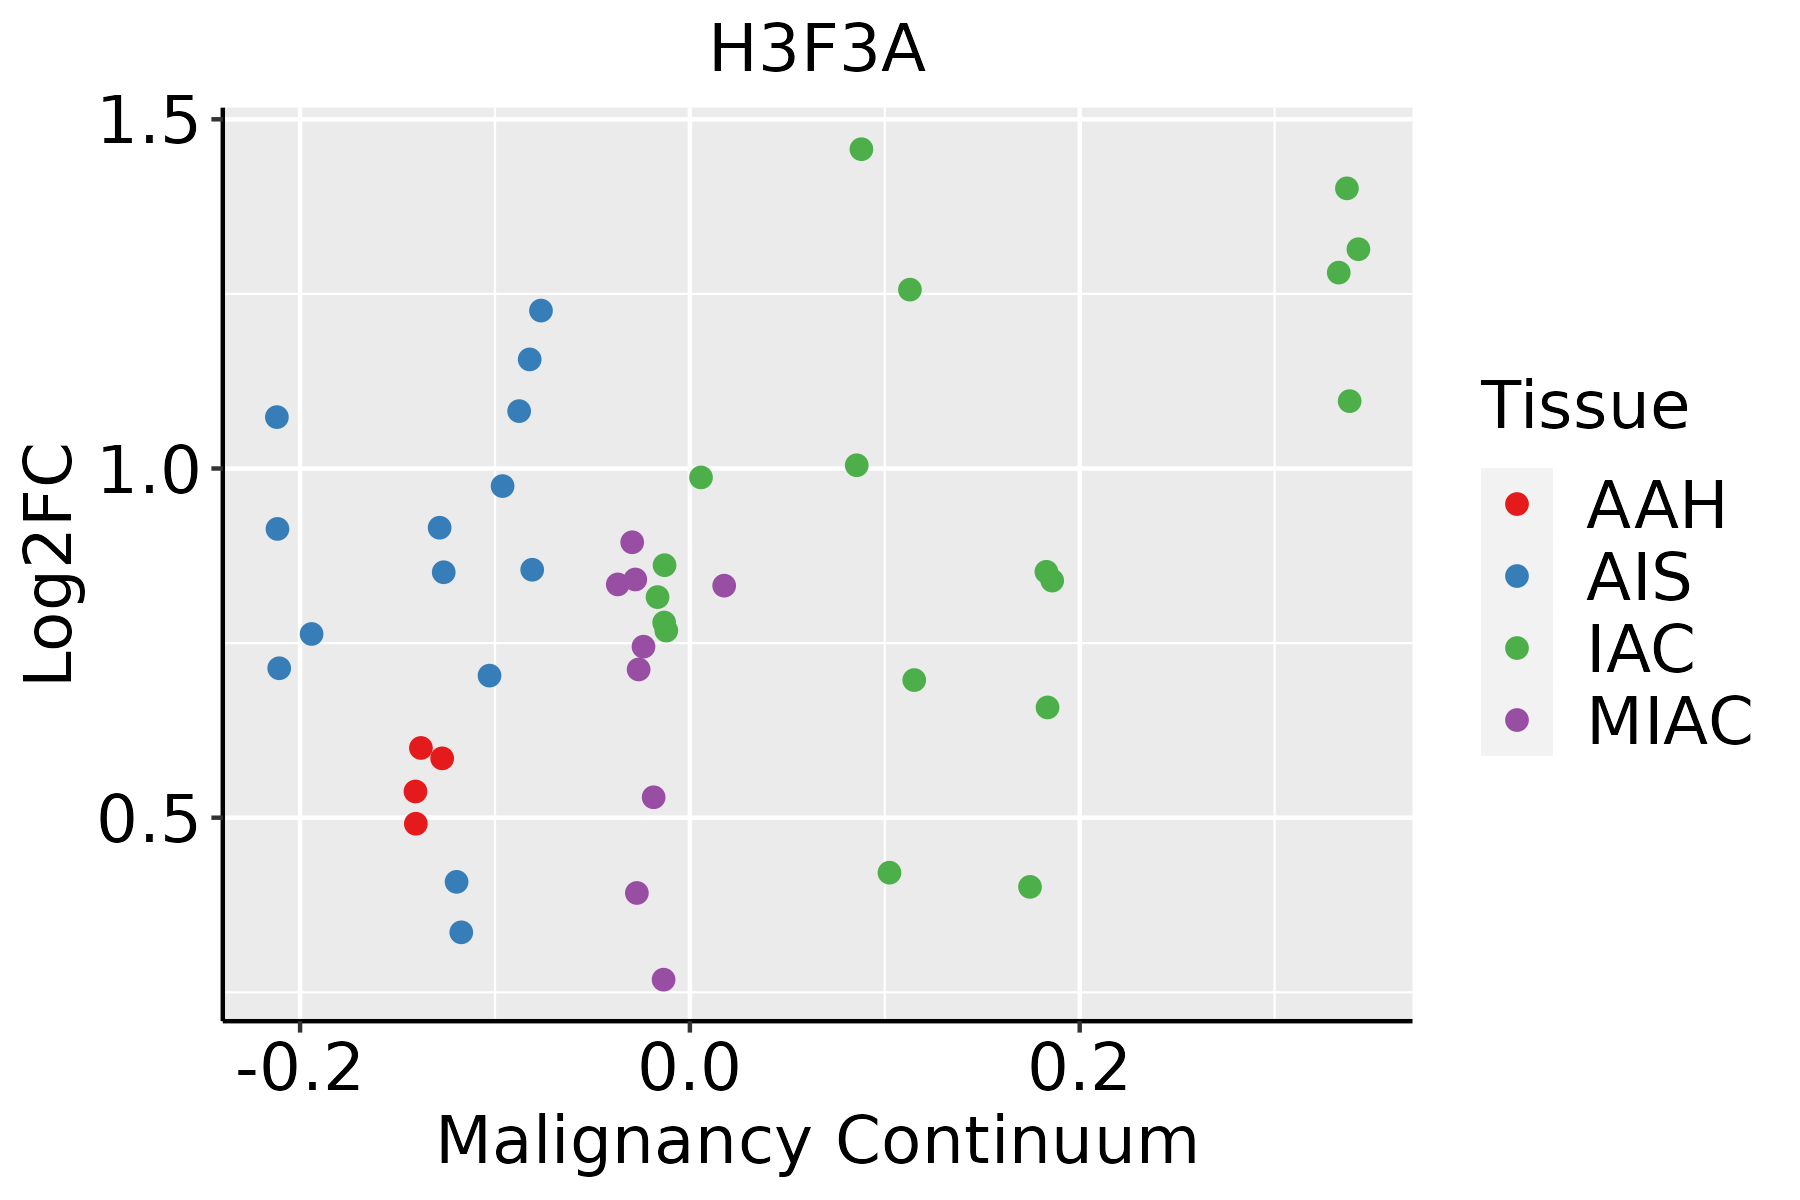 | AAH: Atypical adenomatous hyperplasia |
| AIS: Adenocarcinoma in situ | ||
| IAC: Invasive lung adenocarcinoma | ||
| MIA: Minimally invasive adenocarcinoma | ||
| Oral Cavity | 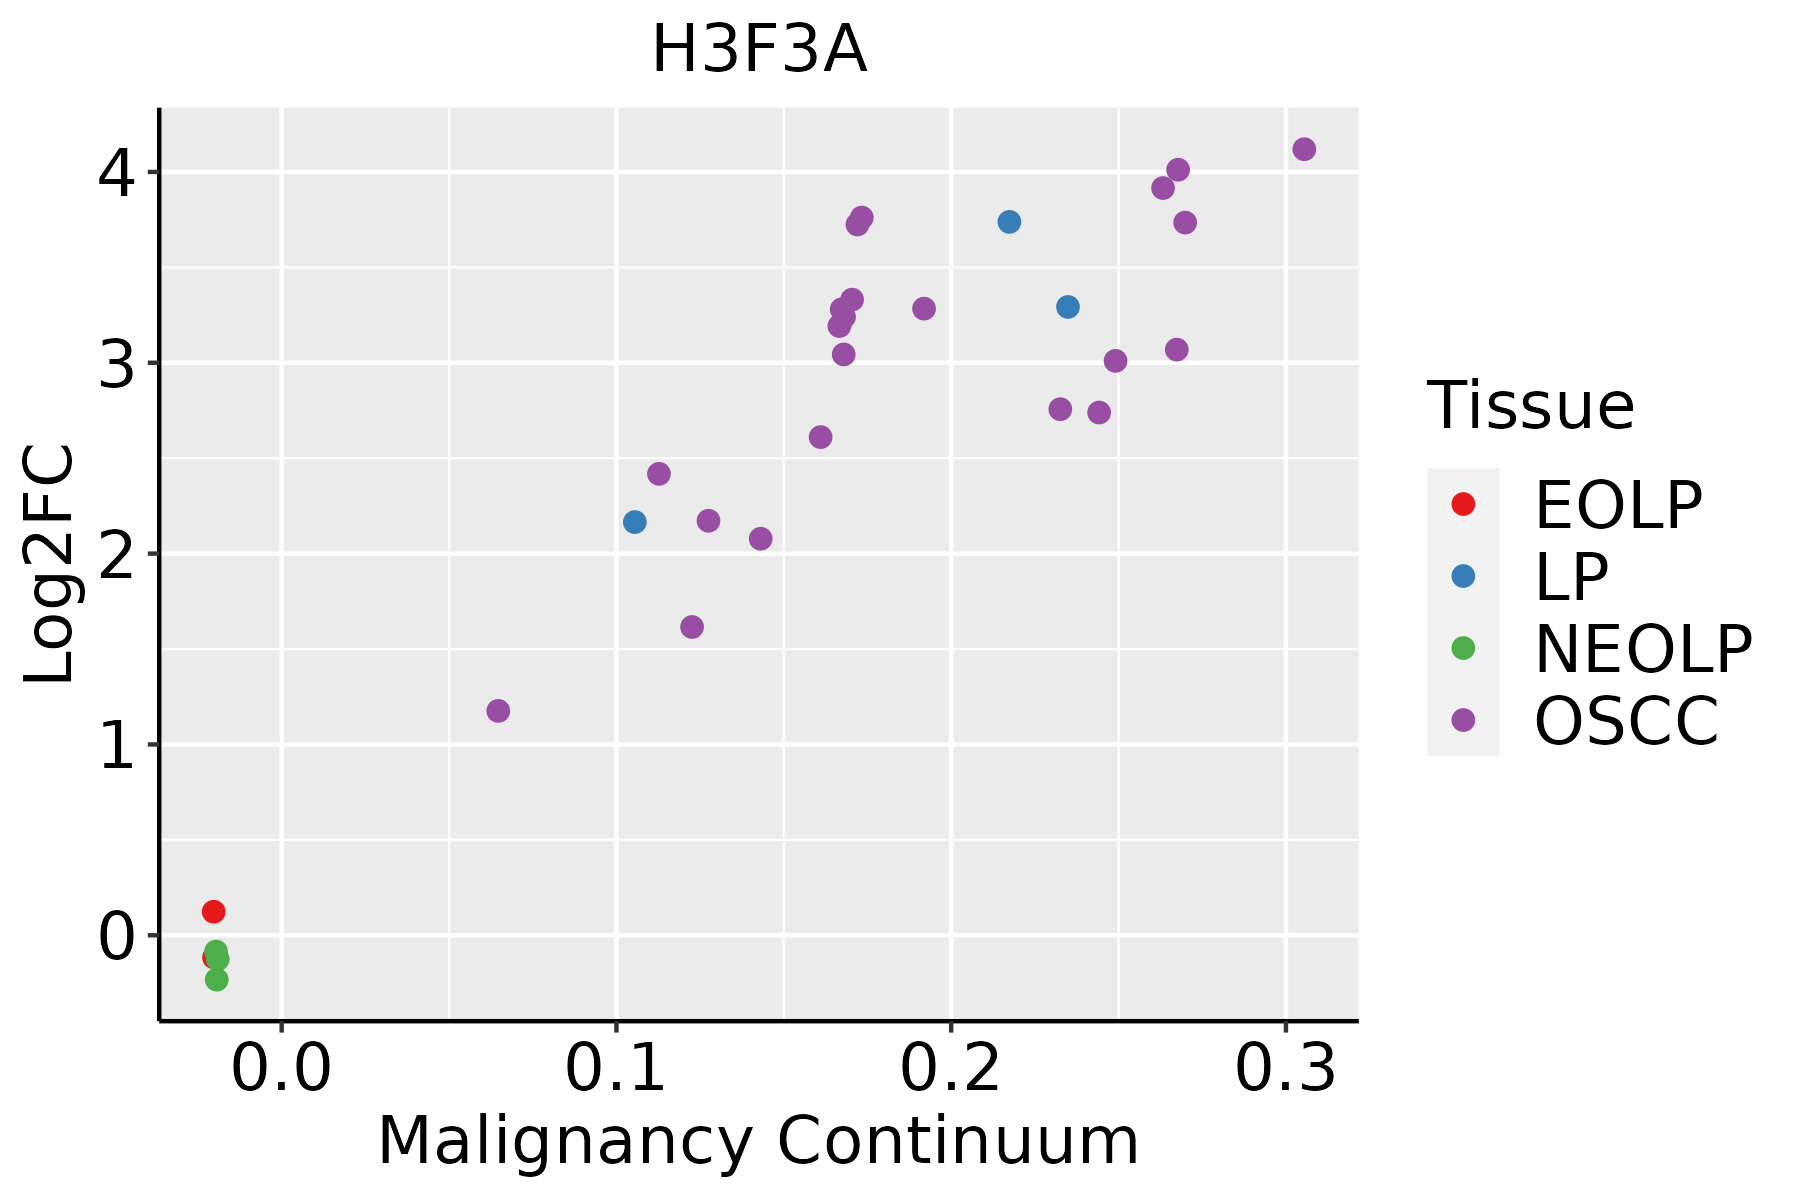 | EOLP: Erosive Oral lichen planus |
| LP: leukoplakia | ||
| NEOLP: Non-erosive oral lichen planus | ||
| OSCC: Oral squamous cell carcinoma | ||
| Prostate | 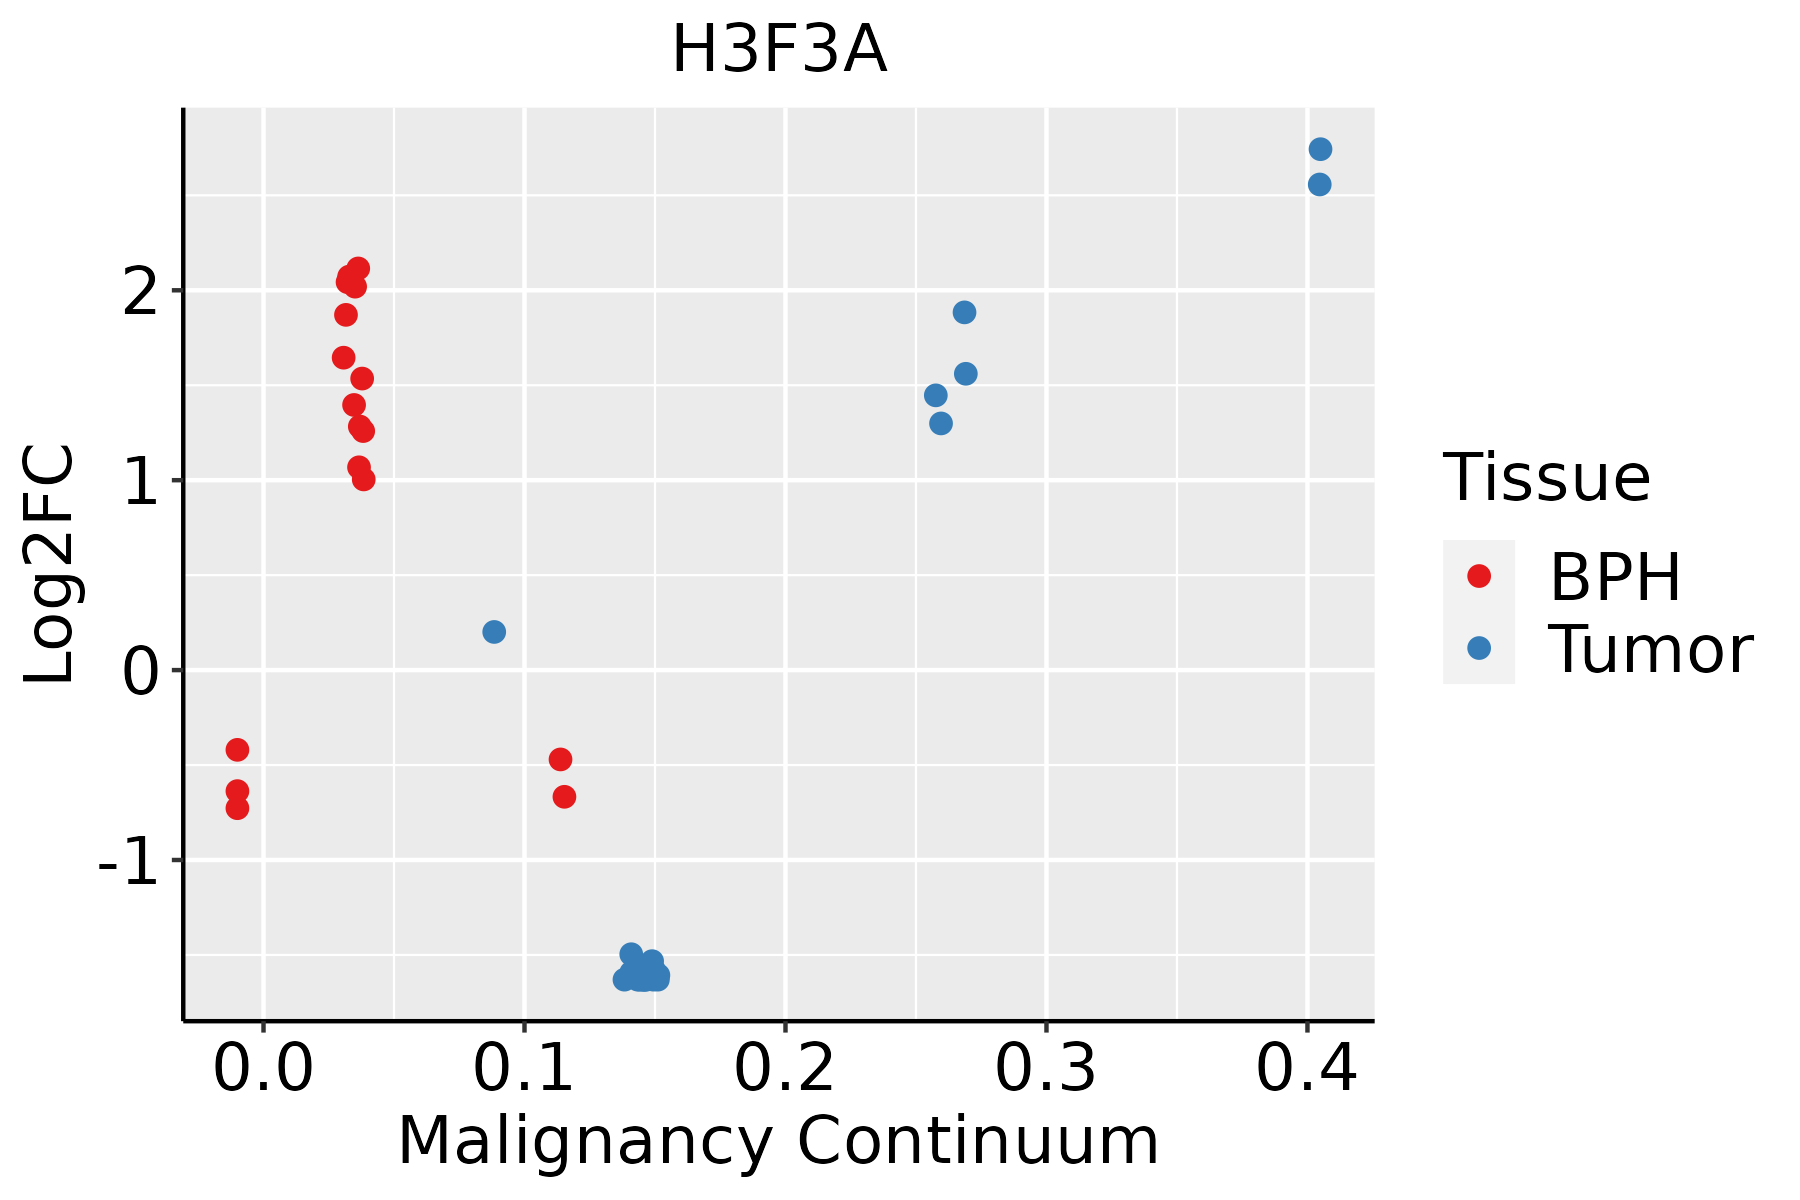 | BPH: Benign Prostatic Hyperplasia |
| Skin |  | AK: Actinic keratosis |
| cSCC: Cutaneous squamous cell carcinoma | ||
| SCCIS:squamous cell carcinoma in situ | ||
| Thyroid | 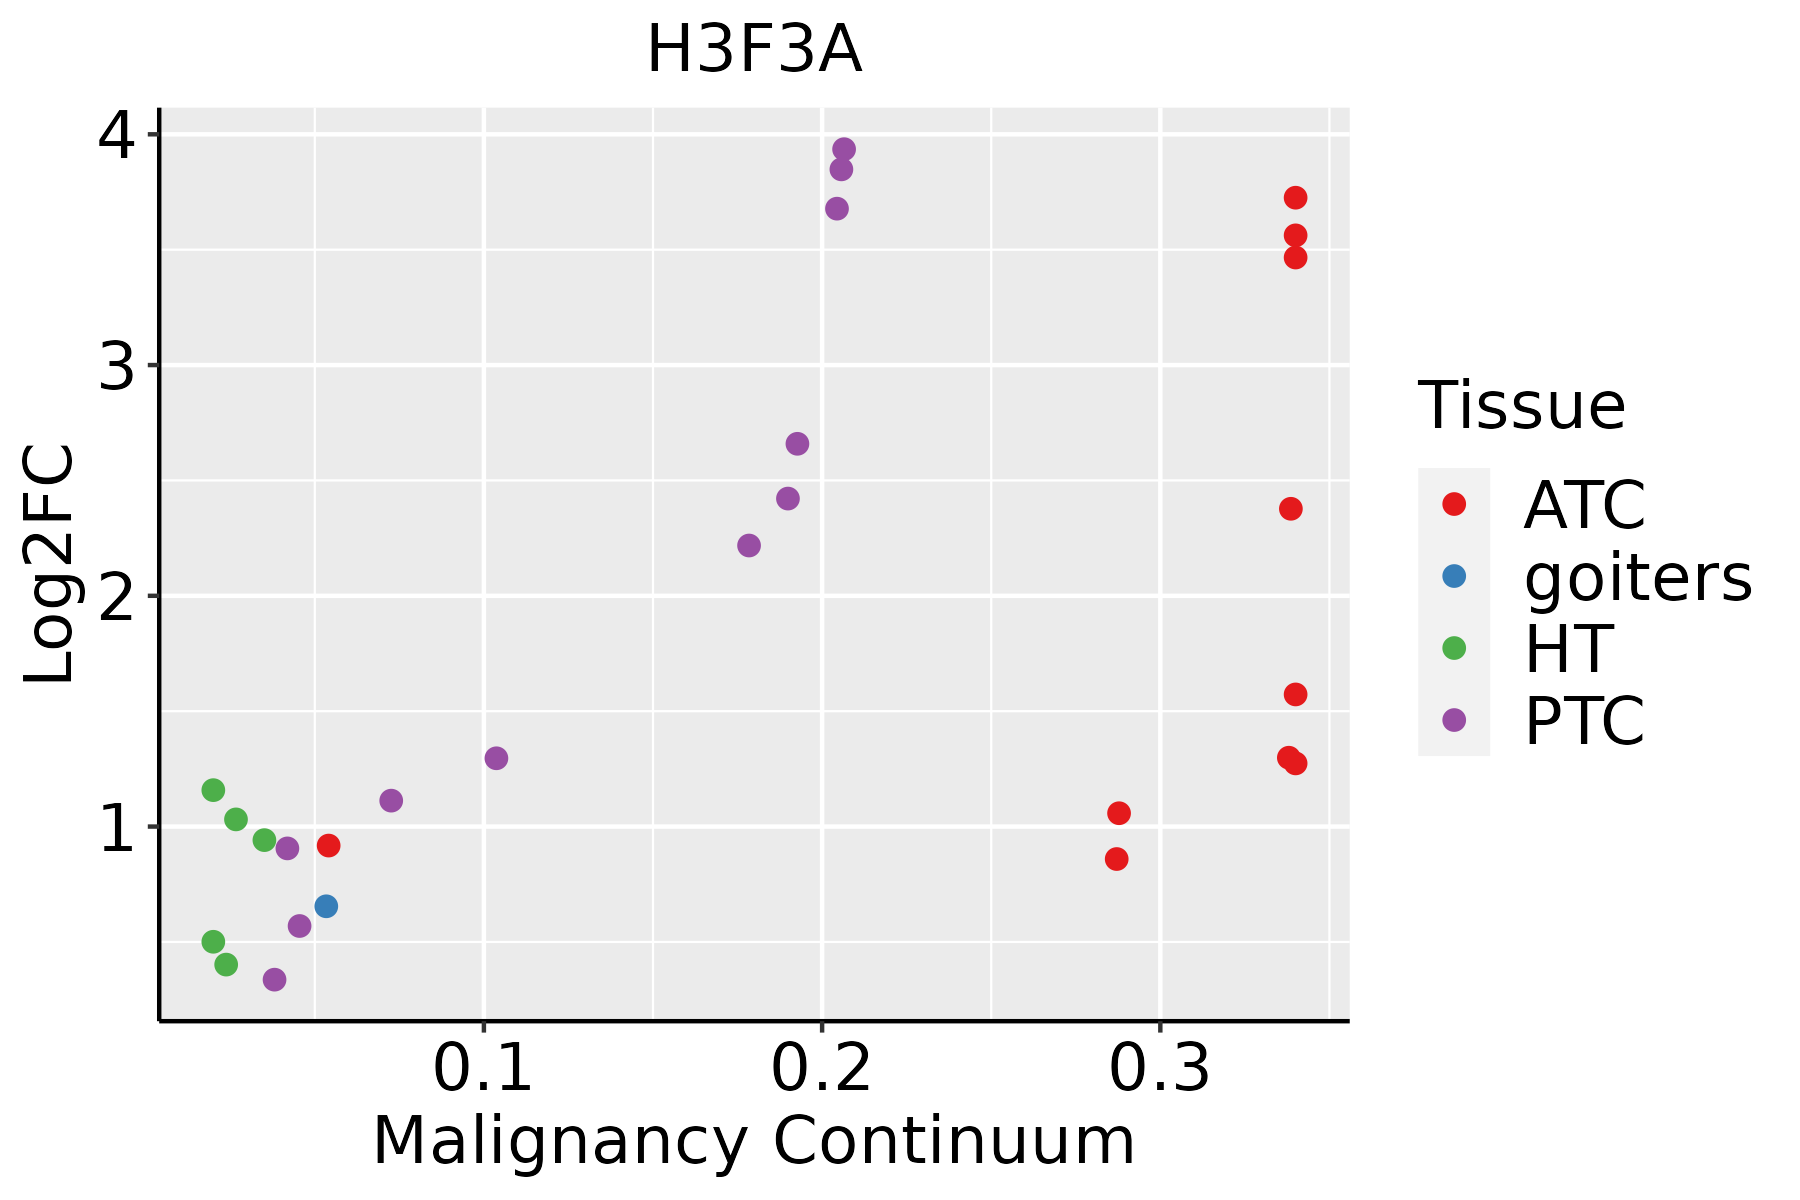 | ATC: Anaplastic thyroid cancer |
| HT: Hashimoto's thyroiditis | ||
| PTC: Papillary thyroid cancer |
| ∗log2FC in expression of this searched gene in stem-like cells from each diseased tissue sample relative to stem-like cells in normal samples in each tissue plotted against the malignancy continuum. Samples are colored based on if they are from different disease stage. |
Top |
Malignant transformation related pathway analysis |
| Find out the enriched GO biological processes and KEGG pathways involved in transition from healthy to precancer to cancer |
| Tissue | Disease Stage | Enriched GO biological Processes |
| Colorectum | AD |  |
| Colorectum | SER |  |
| Colorectum | MSS |  |
| Colorectum | MSI-H |  |
| Colorectum | FAP |  |
| ∗Top 15 enriched GO BP terms are showed in the bar plot of each disease state in each tissue. Each row represents a significant GO biological process which is colored according to the -log10(p.adjust). |
| Page: 1 2 3 4 5 6 7 8 9 |
| GO ID | Tissue | Disease Stage | Description | Gene Ratio | Bg Ratio | pvalue | p.adjust | Count |
| Page: 1 |
| Pathway ID | Tissue | Disease Stage | Description | Gene Ratio | Bg Ratio | pvalue | p.adjust | qvalue | Count |
| hsa0513120 | Cervix | CC | Shigellosis | 69/1267 | 247/8465 | 7.64e-08 | 1.03e-06 | 6.10e-07 | 69 |
| hsa05131110 | Cervix | CC | Shigellosis | 69/1267 | 247/8465 | 7.64e-08 | 1.03e-06 | 6.10e-07 | 69 |
| hsa05322 | Cervix | HSIL_HPV | Systemic lupus erythematosus | 19/459 | 137/8465 | 1.40e-04 | 1.74e-03 | 1.40e-03 | 19 |
| hsa0513125 | Cervix | HSIL_HPV | Shigellosis | 27/459 | 247/8465 | 3.78e-04 | 3.49e-03 | 2.82e-03 | 27 |
| hsa053221 | Cervix | HSIL_HPV | Systemic lupus erythematosus | 19/459 | 137/8465 | 1.40e-04 | 1.74e-03 | 1.40e-03 | 19 |
| hsa0513135 | Cervix | HSIL_HPV | Shigellosis | 27/459 | 247/8465 | 3.78e-04 | 3.49e-03 | 2.82e-03 | 27 |
| hsa05131 | Colorectum | AD | Shigellosis | 109/2092 | 247/8465 | 1.09e-11 | 2.44e-10 | 1.55e-10 | 109 |
| hsa051311 | Colorectum | AD | Shigellosis | 109/2092 | 247/8465 | 1.09e-11 | 2.44e-10 | 1.55e-10 | 109 |
| hsa051312 | Colorectum | SER | Shigellosis | 87/1580 | 247/8465 | 3.07e-10 | 7.27e-09 | 5.28e-09 | 87 |
| hsa051313 | Colorectum | SER | Shigellosis | 87/1580 | 247/8465 | 3.07e-10 | 7.27e-09 | 5.28e-09 | 87 |
| Page: 1 |
Top |
Cell-cell communication analysis |
| Identification of potential cell-cell interactions between two cell types and their ligand-receptor pairs for different disease states |
| Ligand | Receptor | LRpair | Pathway | Tissue | Disease Stage |
| Page: 1 |
Top |
Single-cell gene regulatory network inference analysis |
| Find out the significant the regulons (TFs) and the target genes of each regulon across cell types for different disease states |
| TF | Cell Type | Tissue | Disease Stage | Target Gene | RSS | Regulon Activity |
| ∗The dot plots of a searched regulon are shown for all cell subpopulations in each disease state of each tissue based on the regulon specific score inferred using pySCENIC and by calculating the average expression. |
| Page: 1 |
Top |
Somatic mutation of malignant transformation related genes |
| Annotation of somatic variants for genes involved in malignant transformation |
| Hugo Symbol | Variant Class | Variant Classification | dbSNP RS | HGVSc | HGVSp | HGVSp Short | SWISSPROT | BIOTYPE | SIFT | PolyPhen | Tumor Sample Barcode | Tissue | Histology | Sex | Age | Stage | Therapy Types | Drugs | Outcome |
| H3F3A | SNV | Missense_Mutation | c.307G>T | p.Gly103Cys | p.G103C | P84243 | protein_coding | deleterious_low_confidence(0.01) | probably_damaging(0.949) | TCGA-A2-A25A-01 | Breast | breast invasive carcinoma | Female | <65 | I/II | Unspecific | Cytoxan | SD | |
| H3F3A | SNV | Missense_Mutation | novel | c.25C>G | p.Arg9Gly | p.R9G | P84243 | protein_coding | deleterious_low_confidence(0.05) | benign(0.001) | TCGA-E2-A573-01 | Breast | breast invasive carcinoma | Female | <65 | I/II | Chemotherapy | taxotere | CR |
| H3F3A | SNV | Missense_Mutation | c.7N>G | p.Arg3Gly | p.R3G | P84243 | protein_coding | tolerated_low_confidence(0.06) | benign(0) | TCGA-E9-A1R3-01 | Breast | breast invasive carcinoma | Female | >=65 | III/IV | Chemotherapy | methotrexate | SD | |
| H3F3A | SNV | Missense_Mutation | c.7C>T | p.Arg3Cys | p.R3C | P84243 | protein_coding | deleterious_low_confidence(0.01) | benign(0.001) | TCGA-C5-A1M6-01 | Cervix | cervical & endocervical cancer | Female | <65 | I/II | Chemotherapy | cisplatin | PD | |
| H3F3A | SNV | Missense_Mutation | novel | c.8G>C | p.Arg3Pro | p.R3P | P84243 | protein_coding | deleterious_low_confidence(0.03) | benign(0) | TCGA-DS-A1OB-01 | Cervix | cervical & endocervical cancer | Female | <65 | I/II | Chemotherapy | carboplatin | PD |
| H3F3A | SNV | Missense_Mutation | c.14N>T | p.Lys5Met | p.K5M | P84243 | protein_coding | deleterious_low_confidence(0) | benign(0.271) | TCGA-EK-A2RB-01 | Cervix | cervical & endocervical cancer | Female | <65 | I/II | Unknown | Unknown | SD | |
| H3F3A | SNV | Missense_Mutation | novel | c.274G>T | p.Ala92Ser | p.A92S | P84243 | protein_coding | deleterious_low_confidence(0) | benign(0.284) | TCGA-ZJ-A8QR-01 | Cervix | cervical & endocervical cancer | Female | <65 | I/II | Unknown | Unknown | SD |
| H3F3A | SNV | Missense_Mutation | c.385N>T | p.Arg129Cys | p.R129C | P84243 | protein_coding | tolerated_low_confidence(0.09) | benign(0.001) | TCGA-AJ-A3EL-01 | Endometrium | uterine corpus endometrioid carcinoma | Female | <65 | I/II | Unknown | Unknown | SD | |
| H3F3A | SNV | Missense_Mutation | c.389G>A | p.Arg130His | p.R130H | P84243 | protein_coding | tolerated_low_confidence(0.08) | benign(0.001) | TCGA-AP-A056-01 | Endometrium | uterine corpus endometrioid carcinoma | Female | <65 | I/II | Unknown | Unknown | SD | |
| H3F3A | SNV | Missense_Mutation | c.245N>T | p.Asp82Val | p.D82V | P84243 | protein_coding | deleterious_low_confidence(0) | possibly_damaging(0.858) | TCGA-AP-A0LM-01 | Endometrium | uterine corpus endometrioid carcinoma | Female | <65 | III/IV | Chemotherapy | cisplatin | SD |
| Page: 1 2 3 |
Top |
Related drugs of malignant transformation related genes |
| Identification of chemicals and drugs interact with genes involved in malignant transfromation |
| (DGIdb 4.0) |
| Entrez ID | Symbol | Category | Interaction Types | Drug Claim Name | Drug Name | PMIDs |
| Page: 1 |

Copyright 2023-Present -The University of Texas Health Science Center at Houston |