
|
|||||
|
 | |
| |
| |
| |
| |
| |
|
Gene: H2AFX |
Gene summary for H2AFX |
| Gene information | Species | Human | Gene symbol | H2AFX | Gene ID | 3014 |
| Gene name | H2A.X variant histone | |
| Gene Alias | H2A.X | |
| Cytomap | 11q23.3 | |
| Gene Type | protein-coding | GO ID | GO:0000003 | UniProtAcc | P16104 |
Top |
Malignant transformation analysis |
| Identification of the aberrant gene expression in precancerous and cancerous lesions by comparing the gene expression of stem-like cells in diseased tissues with normal stem cells |
| Entrez ID | Symbol | Replicates | Species | Organ | Tissue | Adj P-value | Log2FC | Malignancy |
| 3014 | H2AFX | CCI_2 | Human | Cervix | CC | 1.28e-03 | 3.35e-01 | 0.5249 |
| 3014 | H2AFX | Tumor | Human | Cervix | CC | 3.12e-19 | 3.60e-01 | 0.1241 |
| 3014 | H2AFX | sample1 | Human | Cervix | CC | 3.80e-11 | 3.98e-01 | 0.0959 |
| 3014 | H2AFX | sample3 | Human | Cervix | CC | 2.75e-23 | 3.87e-01 | 0.1387 |
| 3014 | H2AFX | H2 | Human | Cervix | HSIL_HPV | 8.81e-06 | 1.83e-01 | 0.0632 |
| 3014 | H2AFX | L1 | Human | Cervix | CC | 6.94e-04 | 2.39e-01 | 0.0802 |
| 3014 | H2AFX | T1 | Human | Cervix | CC | 7.83e-20 | 4.65e-01 | 0.0918 |
| 3014 | H2AFX | T2 | Human | Cervix | CC | 2.79e-15 | 5.94e-01 | 0.0709 |
| 3014 | H2AFX | T3 | Human | Cervix | CC | 4.88e-24 | 4.31e-01 | 0.1389 |
| 3014 | H2AFX | LZE4T | Human | Esophagus | ESCC | 9.41e-10 | 4.35e-01 | 0.0811 |
| 3014 | H2AFX | LZE7T | Human | Esophagus | ESCC | 5.34e-05 | -3.68e-02 | 0.0667 |
| 3014 | H2AFX | LZE20T | Human | Esophagus | ESCC | 4.87e-12 | 5.96e-01 | 0.0662 |
| 3014 | H2AFX | LZE22D1 | Human | Esophagus | HGIN | 6.59e-09 | 1.36e+00 | 0.0595 |
| 3014 | H2AFX | LZE22T | Human | Esophagus | ESCC | 1.27e-28 | 3.27e+00 | 0.068 |
| 3014 | H2AFX | LZE24T | Human | Esophagus | ESCC | 3.53e-25 | 1.02e+00 | 0.0596 |
| 3014 | H2AFX | LZE22D3 | Human | Esophagus | HGIN | 9.00e-03 | 1.45e+00 | 0.0653 |
| 3014 | H2AFX | LZE21T | Human | Esophagus | ESCC | 1.76e-03 | 9.26e-01 | 0.0655 |
| 3014 | H2AFX | LZE6T | Human | Esophagus | ESCC | 4.06e-03 | -9.29e-02 | 0.0845 |
| 3014 | H2AFX | P1T-E | Human | Esophagus | ESCC | 3.17e-13 | 1.07e+00 | 0.0875 |
| 3014 | H2AFX | P2T-E | Human | Esophagus | ESCC | 1.28e-33 | 1.12e+00 | 0.1177 |
| Page: 1 2 3 4 5 6 |
| Tissue | Expression Dynamics | Abbreviation |
| Cervix |  | CC: Cervix cancer |
| HSIL_HPV: HPV-infected high-grade squamous intraepithelial lesions | ||
| N_HPV: HPV-infected normal cervix | ||
| Esophagus | 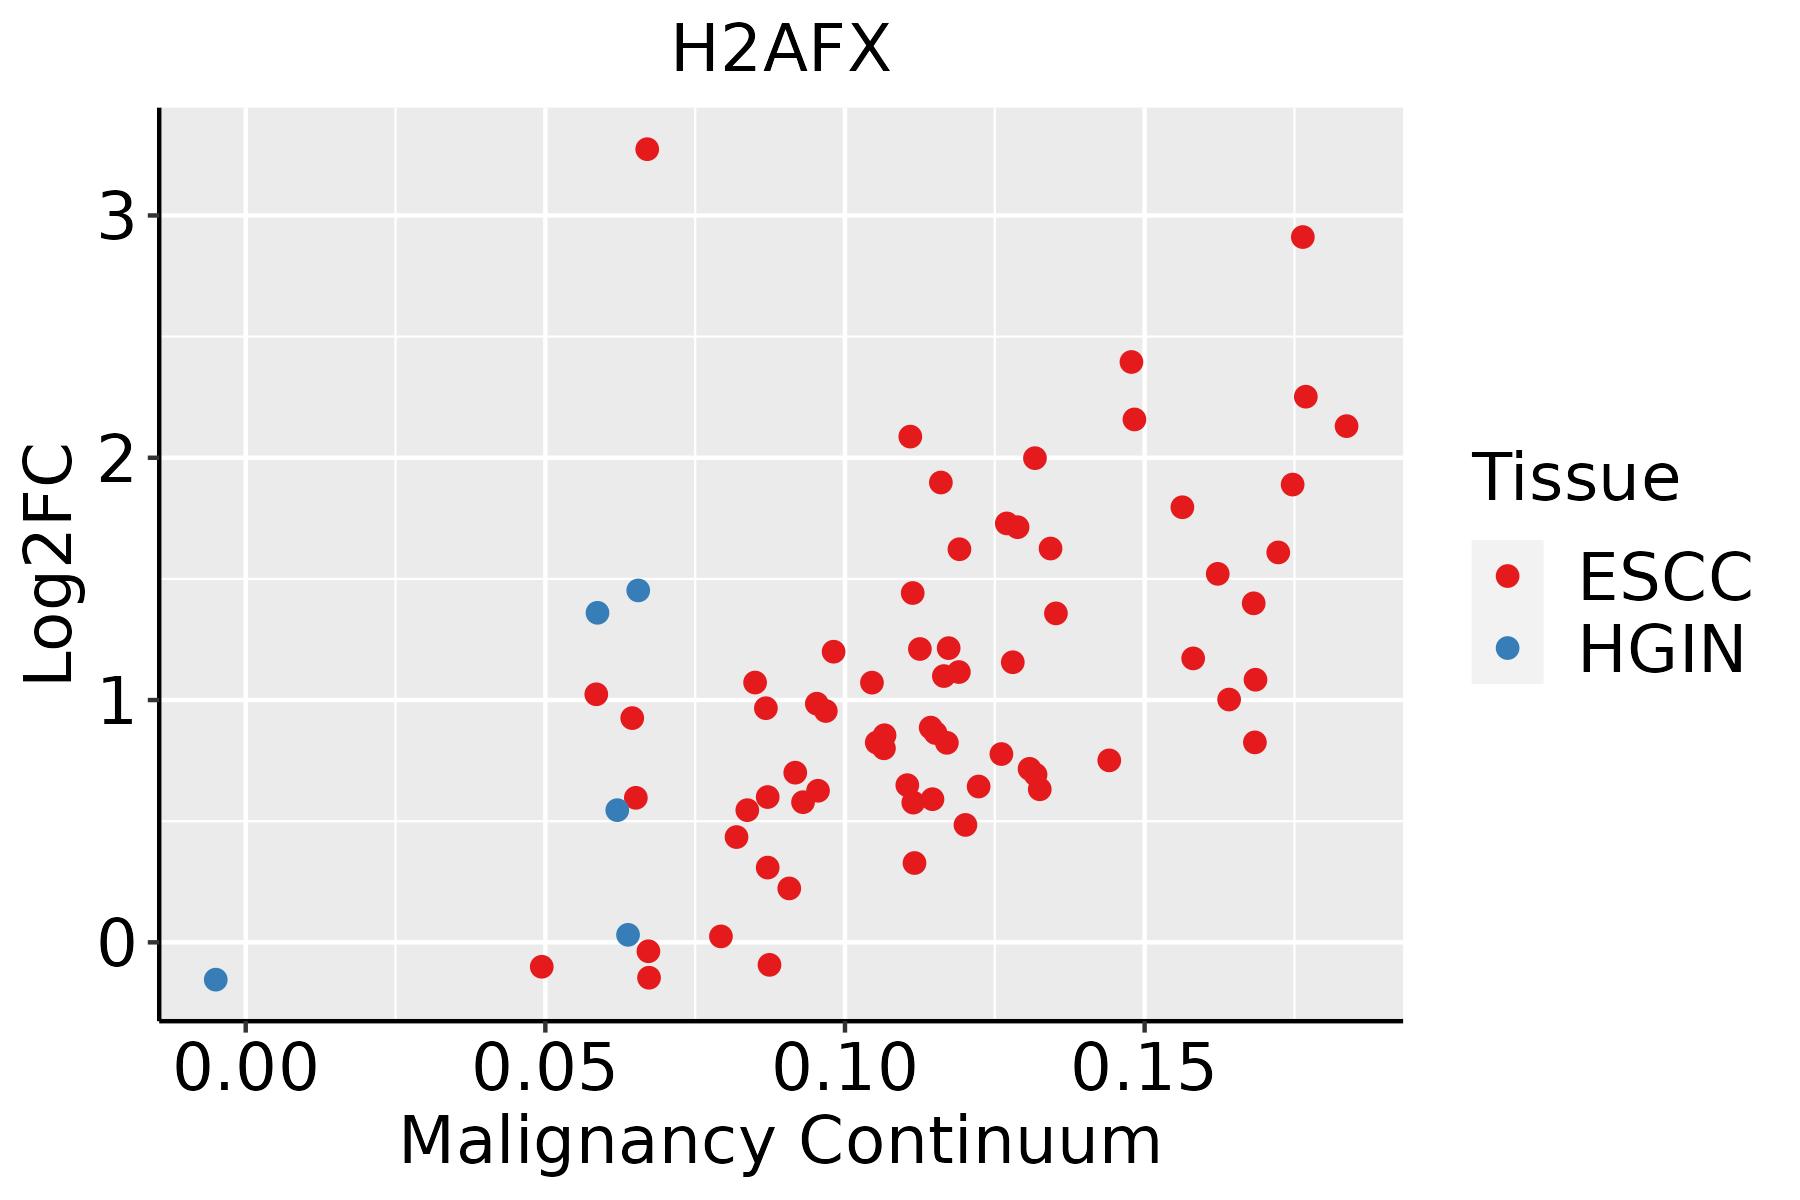 | ESCC: Esophageal squamous cell carcinoma |
| HGIN: High-grade intraepithelial neoplasias | ||
| LGIN: Low-grade intraepithelial neoplasias | ||
| Liver | 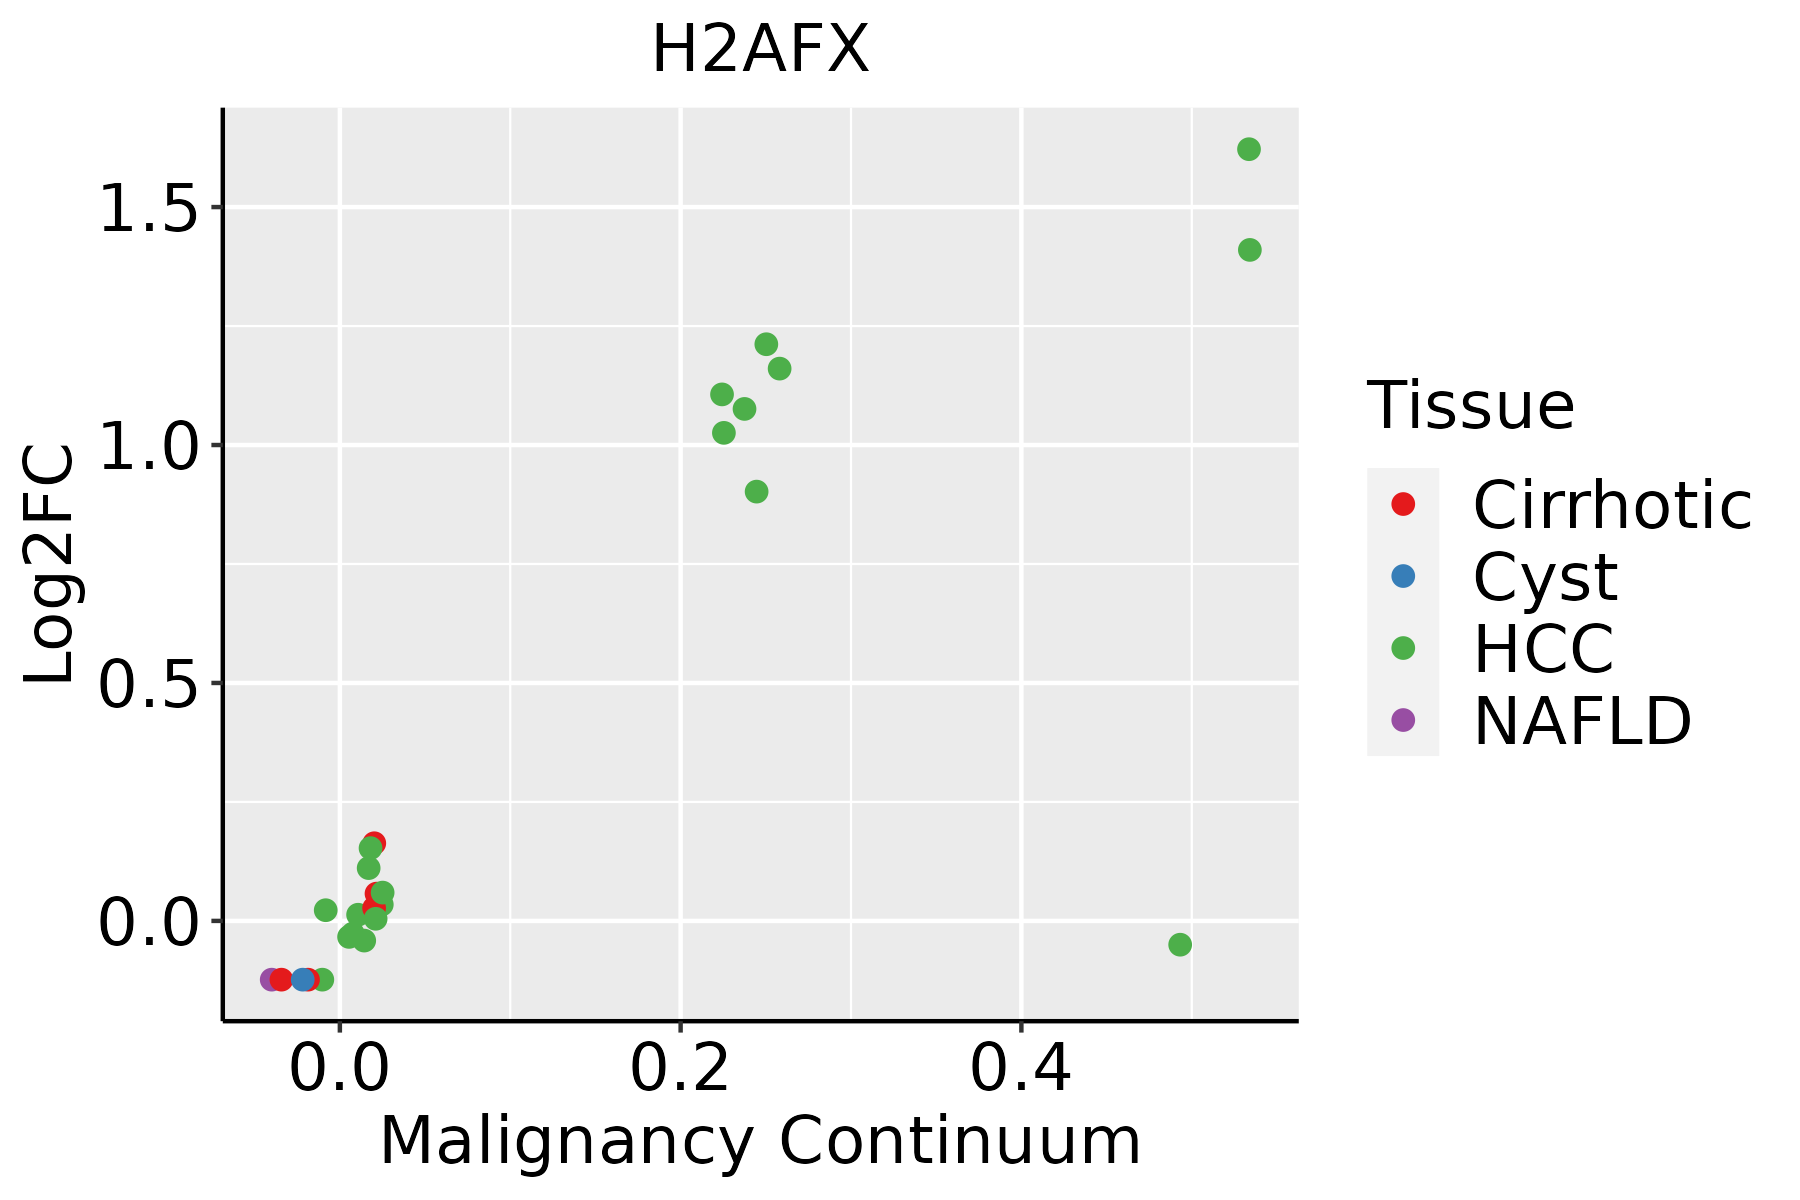 | HCC: Hepatocellular carcinoma |
| NAFLD: Non-alcoholic fatty liver disease | ||
| Oral Cavity | 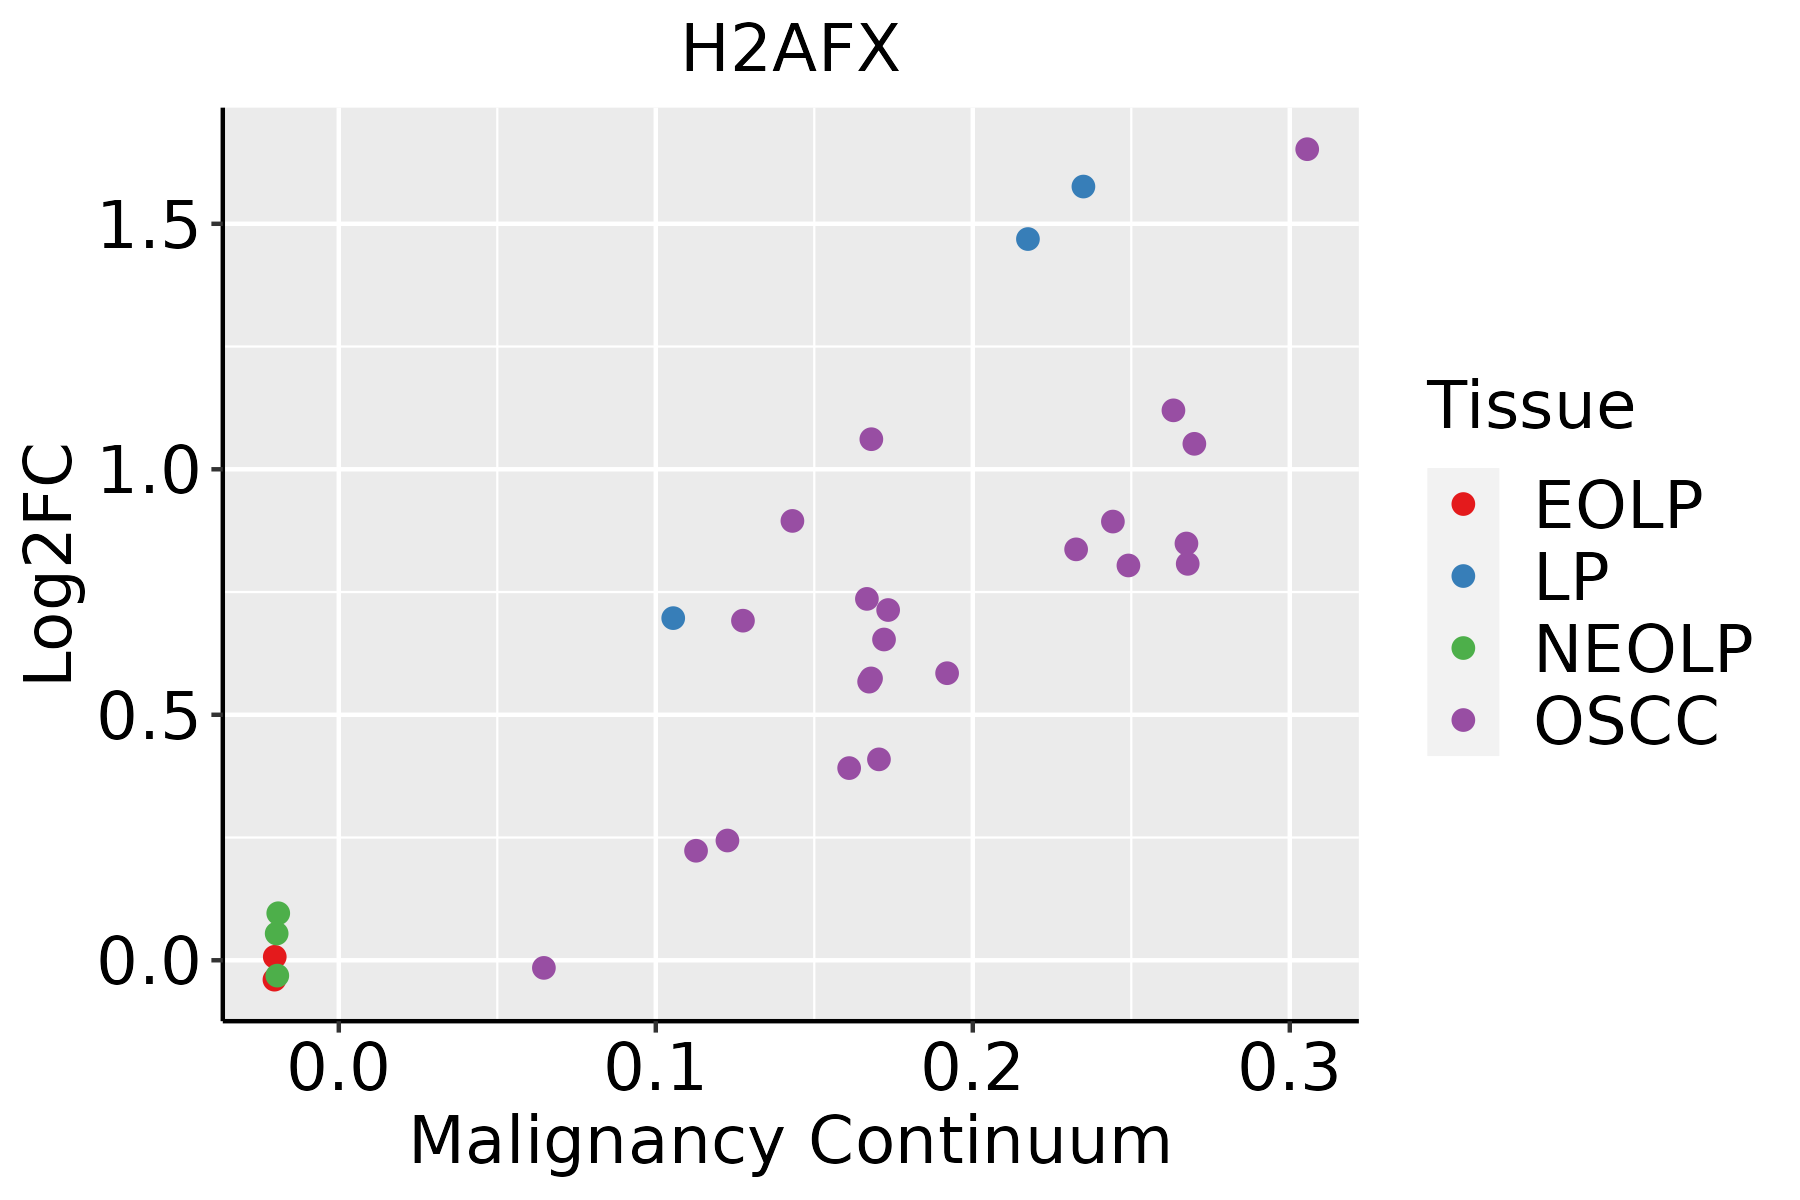 | EOLP: Erosive Oral lichen planus |
| LP: leukoplakia | ||
| NEOLP: Non-erosive oral lichen planus | ||
| OSCC: Oral squamous cell carcinoma | ||
| Prostate | 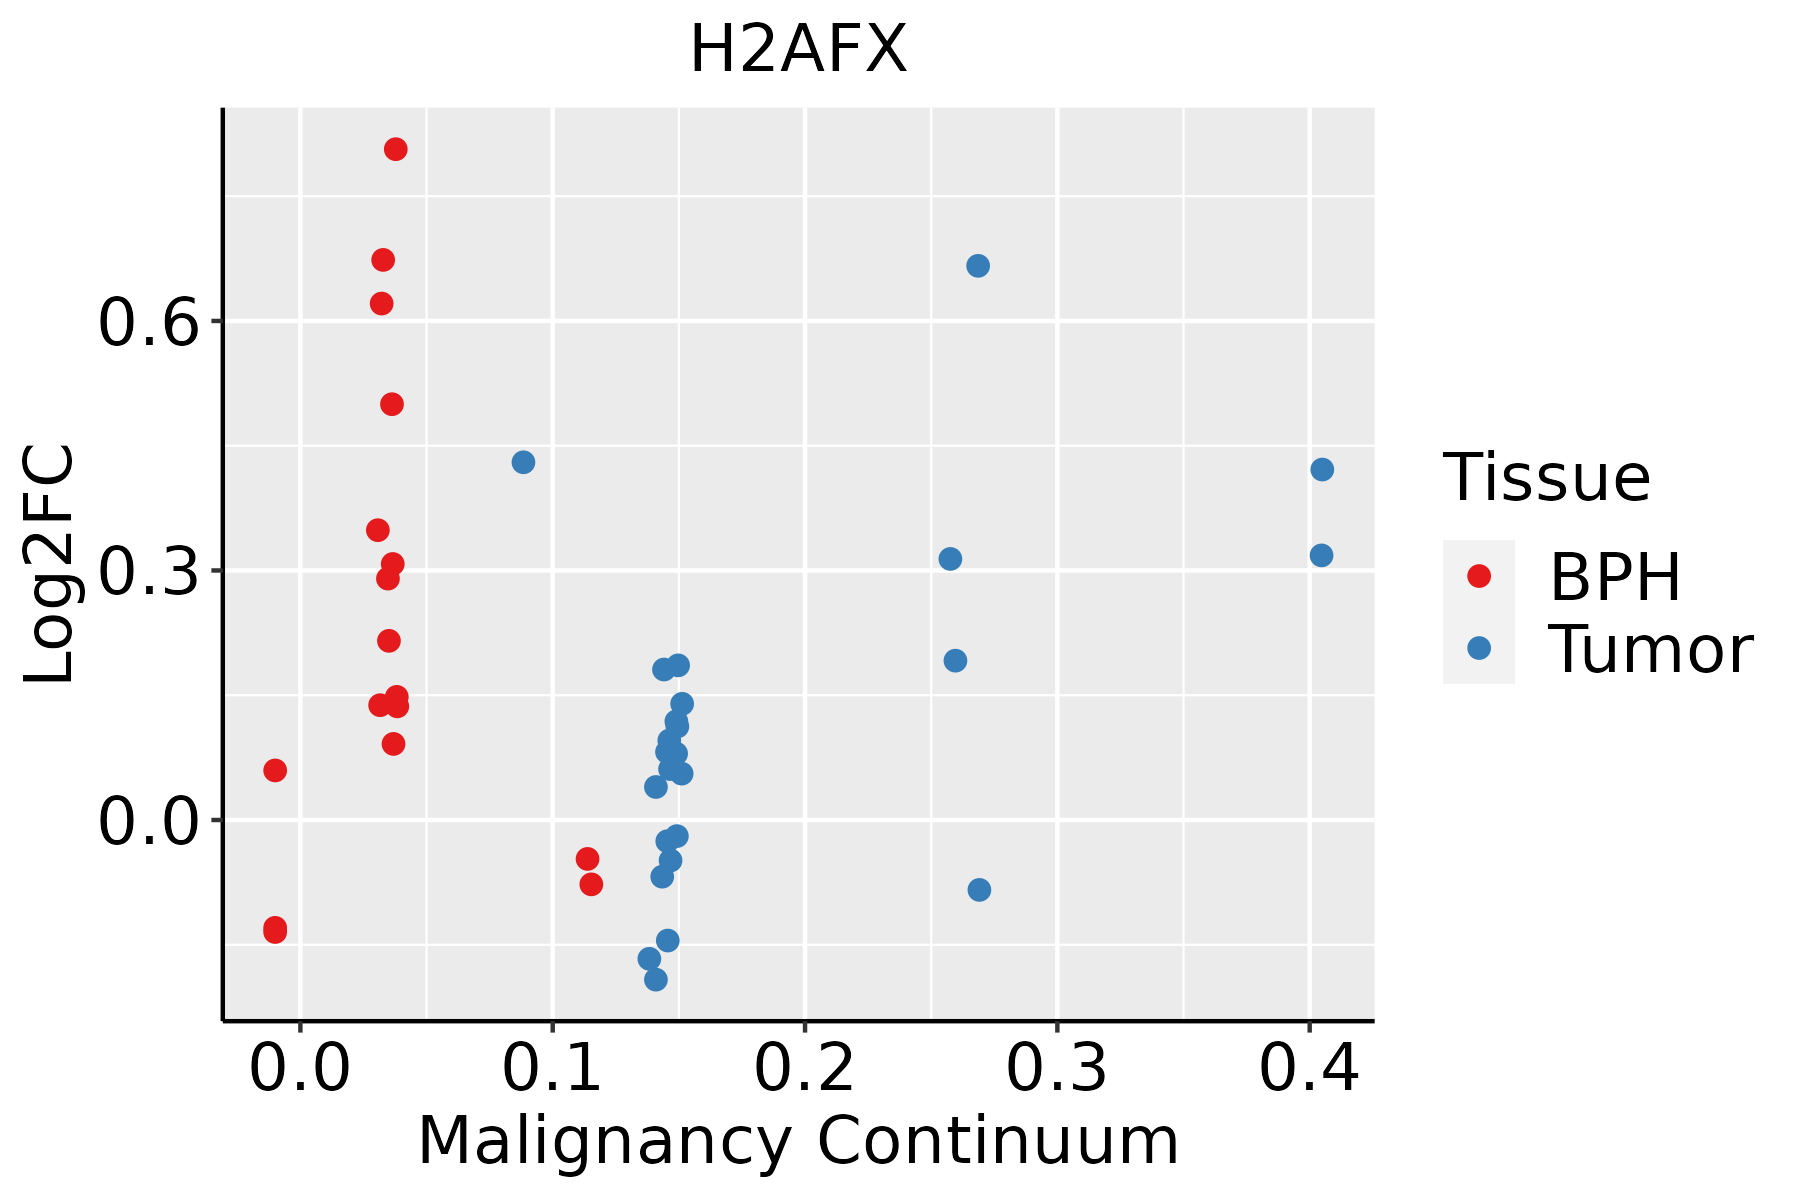 | BPH: Benign Prostatic Hyperplasia |
| Skin | 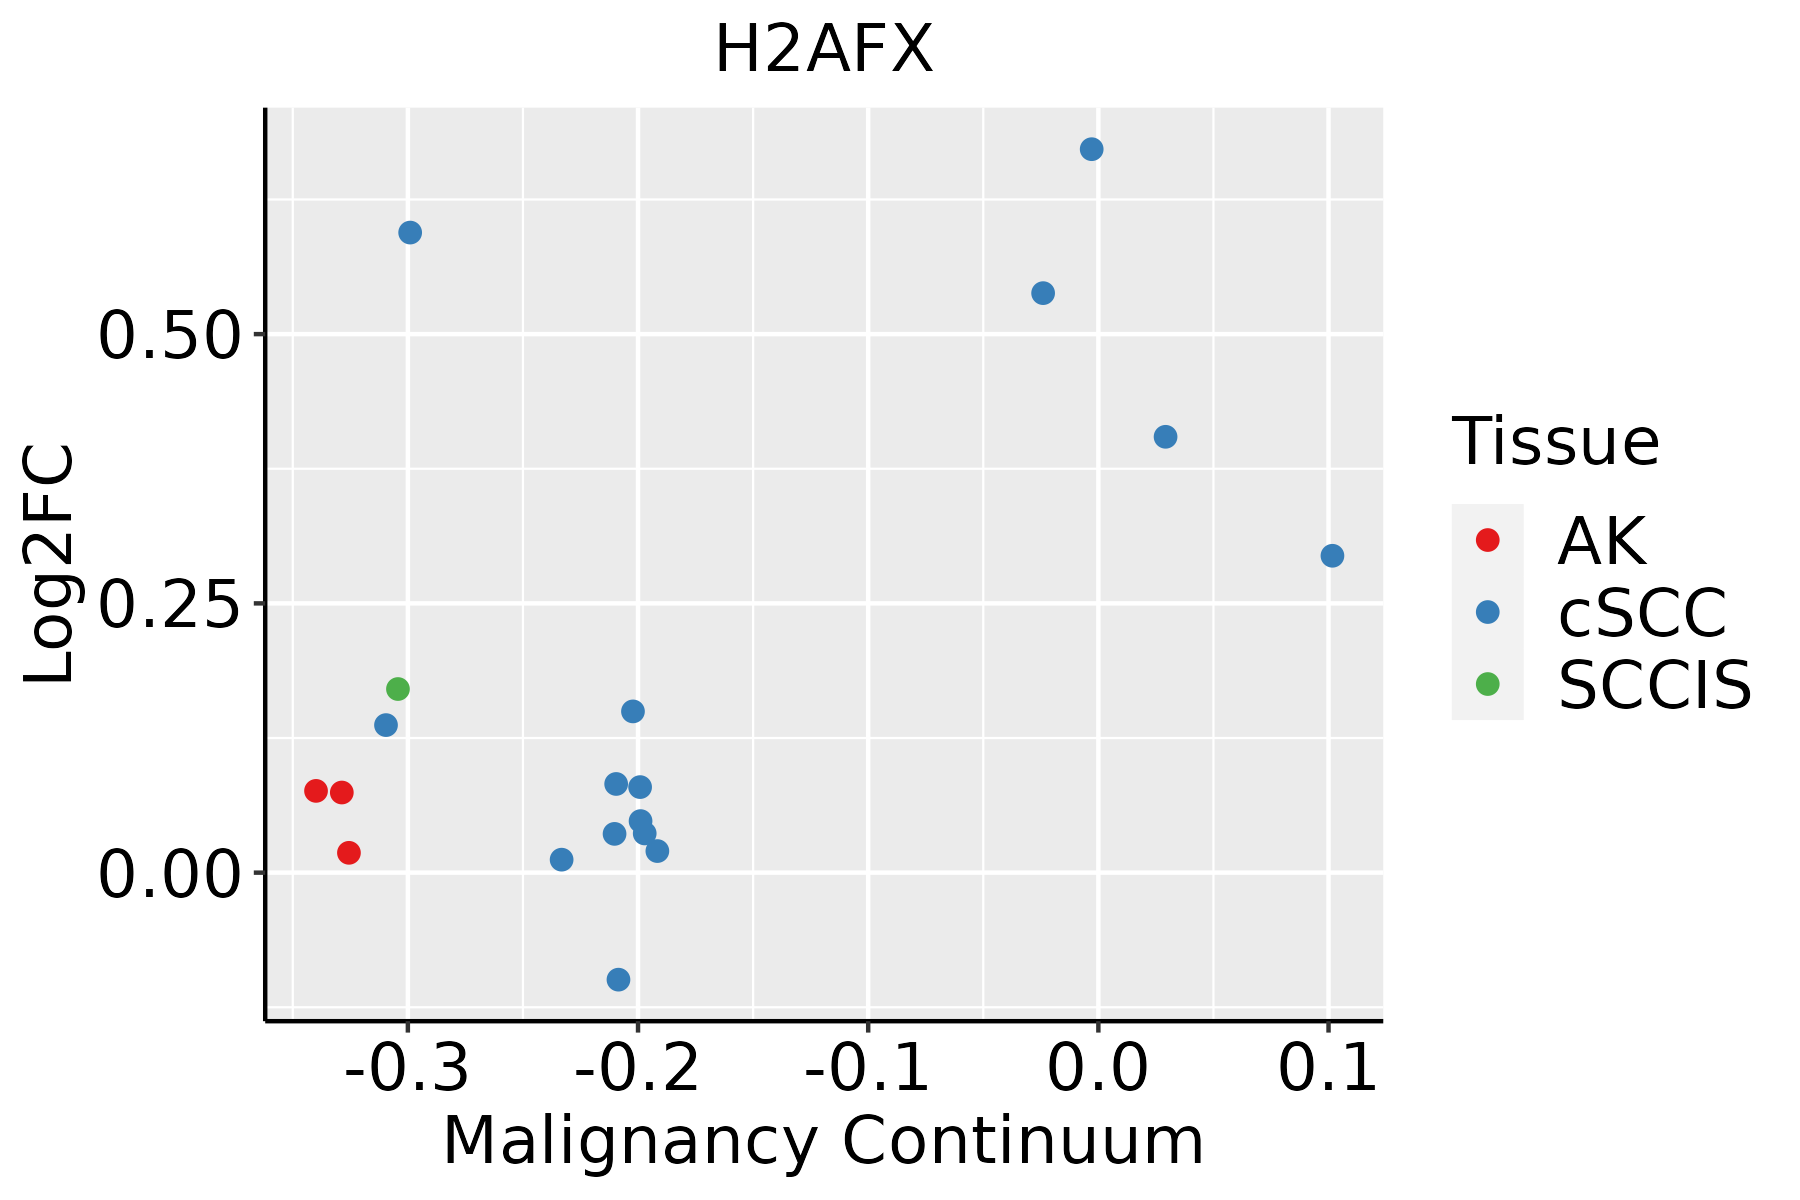 | AK: Actinic keratosis |
| cSCC: Cutaneous squamous cell carcinoma | ||
| SCCIS:squamous cell carcinoma in situ |
| ∗log2FC in expression of this searched gene in stem-like cells from each diseased tissue sample relative to stem-like cells in normal samples in each tissue plotted against the malignancy continuum. Samples are colored based on if they are from different disease stage. |
Top |
Malignant transformation related pathway analysis |
| Find out the enriched GO biological processes and KEGG pathways involved in transition from healthy to precancer to cancer |
| Tissue | Disease Stage | Enriched GO biological Processes |
| Colorectum | AD |  |
| Colorectum | SER |  |
| Colorectum | MSS |  |
| Colorectum | MSI-H |  |
| Colorectum | FAP |  |
| ∗Top 15 enriched GO BP terms are showed in the bar plot of each disease state in each tissue. Each row represents a significant GO biological process which is colored according to the -log10(p.adjust). |
| Page: 1 2 3 4 5 6 7 8 9 |
| GO ID | Tissue | Disease Stage | Description | Gene Ratio | Bg Ratio | pvalue | p.adjust | Count |
| Page: 1 |
| Pathway ID | Tissue | Disease Stage | Description | Gene Ratio | Bg Ratio | pvalue | p.adjust | qvalue | Count |
| Page: 1 |
Top |
Cell-cell communication analysis |
| Identification of potential cell-cell interactions between two cell types and their ligand-receptor pairs for different disease states |
| Ligand | Receptor | LRpair | Pathway | Tissue | Disease Stage |
| Page: 1 |
Top |
Single-cell gene regulatory network inference analysis |
| Find out the significant the regulons (TFs) and the target genes of each regulon across cell types for different disease states |
| TF | Cell Type | Tissue | Disease Stage | Target Gene | RSS | Regulon Activity |
| ∗The dot plots of a searched regulon are shown for all cell subpopulations in each disease state of each tissue based on the regulon specific score inferred using pySCENIC and by calculating the average expression. |
| Page: 1 |
Top |
Somatic mutation of malignant transformation related genes |
| Annotation of somatic variants for genes involved in malignant transformation |
| Hugo Symbol | Variant Class | Variant Classification | dbSNP RS | HGVSc | HGVSp | HGVSp Short | SWISSPROT | BIOTYPE | SIFT | PolyPhen | Tumor Sample Barcode | Tissue | Histology | Sex | Age | Stage | Therapy Types | Drugs | Outcome |
| H2AFX | SNV | Missense_Mutation | novel | c.402G>C | p.Lys134Asn | p.K134N | P16104 | protein_coding | deleterious_low_confidence(0.04) | benign(0.05) | TCGA-C5-A1M7-01 | Cervix | cervical & endocervical cancer | Female | <65 | I/II | Unknown | Unknown | SD |
| H2AFX | SNV | Missense_Mutation | novel | c.184G>A | p.Glu62Lys | p.E62K | P16104 | protein_coding | deleterious_low_confidence(0) | probably_damaging(1) | TCGA-C5-A2LY-01 | Cervix | cervical & endocervical cancer | Female | <65 | I/II | Chemotherapy | cisplatin | SD |
| H2AFX | SNV | Missense_Mutation | c.233N>C | p.Arg78Pro | p.R78P | P16104 | protein_coding | deleterious_low_confidence(0.04) | possibly_damaging(0.826) | TCGA-EA-A43B-01 | Cervix | cervical & endocervical cancer | Female | <65 | I/II | Chemotherapy | cisplatin | CR | |
| H2AFX | SNV | Missense_Mutation | novel | c.161N>T | p.Ala54Val | p.A54V | P16104 | protein_coding | deleterious_low_confidence(0) | possibly_damaging(0.755) | TCGA-AA-A010-01 | Colorectum | colon adenocarcinoma | Female | <65 | I/II | Chemotherapy | folinic | CR |
| H2AFX | SNV | Missense_Mutation | c.248N>G | p.His83Arg | p.H83R | P16104 | protein_coding | deleterious_low_confidence(0) | probably_damaging(0.932) | TCGA-CK-5916-01 | Colorectum | colon adenocarcinoma | Female | >=65 | I/II | Unknown | Unknown | PD | |
| H2AFX | SNV | Missense_Mutation | c.353C>T | p.Pro118Leu | p.P118L | P16104 | protein_coding | deleterious_low_confidence(0.01) | probably_damaging(0.96) | TCGA-F4-6806-01 | Colorectum | colon adenocarcinoma | Female | <65 | I/II | Chemotherapy | irinotecan | PD | |
| H2AFX | SNV | Missense_Mutation | c.407C>T | p.Ala136Val | p.A136V | P16104 | protein_coding | tolerated_low_confidence(0.28) | benign(0.05) | TCGA-AX-A0J1-01 | Endometrium | uterine corpus endometrioid carcinoma | Female | >=65 | I/II | Unknown | Unknown | SD | |
| H2AFX | SNV | Missense_Mutation | rs752137831 | c.310N>A | p.Ala104Thr | p.A104T | P16104 | protein_coding | deleterious_low_confidence(0.02) | probably_damaging(0.944) | TCGA-AX-A2HG-01 | Endometrium | uterine corpus endometrioid carcinoma | Female | <65 | I/II | Unknown | Unknown | SD |
| H2AFX | SNV | Missense_Mutation | c.412N>A | p.Gln138Lys | p.Q138K | P16104 | protein_coding | tolerated_low_confidence(0.86) | benign(0) | TCGA-50-6590-01 | Lung | lung adenocarcinoma | Female | >=65 | I/II | Chemotherapy | paclitaxel | CR | |
| H2AFX | SNV | Missense_Mutation | c.311N>A | p.Ala104Asp | p.A104D | P16104 | protein_coding | deleterious_low_confidence(0) | possibly_damaging(0.529) | TCGA-55-A490-01 | Lung | lung adenocarcinoma | Male | >=65 | I/II | Chemotherapy | carboplatin | SD |
| Page: 1 2 |
Top |
Related drugs of malignant transformation related genes |
| Identification of chemicals and drugs interact with genes involved in malignant transfromation |
| (DGIdb 4.0) |
| Entrez ID | Symbol | Category | Interaction Types | Drug Claim Name | Drug Name | PMIDs |
| Page: 1 |

Copyright 2023-Present -The University of Texas Health Science Center at Houston |