
|
|||||
|
 | |
| |
| |
| |
| |
| |
|
Gene: H1FX |
Gene summary for H1FX |
| Gene information | Species | Human | Gene symbol | H1FX | Gene ID | 8971 |
| Gene name | H1.10 linker histone | |
| Gene Alias | H1.10 | |
| Cytomap | 3q21.3 | |
| Gene Type | protein-coding | GO ID | GO:0000018 | UniProtAcc | Q92522 |
Top |
Malignant transformation analysis |
| Identification of the aberrant gene expression in precancerous and cancerous lesions by comparing the gene expression of stem-like cells in diseased tissues with normal stem cells |
| Entrez ID | Symbol | Replicates | Species | Organ | Tissue | Adj P-value | Log2FC | Malignancy |
| 8971 | H1FX | GSM4909282 | Human | Breast | IDC | 8.41e-15 | 4.21e-01 | -0.0288 |
| 8971 | H1FX | GSM4909285 | Human | Breast | IDC | 4.71e-11 | -4.95e-01 | 0.21 |
| 8971 | H1FX | GSM4909287 | Human | Breast | IDC | 6.91e-14 | 4.96e-01 | 0.2057 |
| 8971 | H1FX | GSM4909293 | Human | Breast | IDC | 4.03e-24 | 4.95e-01 | 0.1581 |
| 8971 | H1FX | GSM4909296 | Human | Breast | IDC | 1.22e-09 | -4.64e-01 | 0.1524 |
| 8971 | H1FX | GSM4909297 | Human | Breast | IDC | 1.94e-22 | -5.48e-01 | 0.1517 |
| 8971 | H1FX | GSM4909298 | Human | Breast | IDC | 1.25e-10 | 3.86e-01 | 0.1551 |
| 8971 | H1FX | GSM4909301 | Human | Breast | IDC | 6.20e-03 | -3.78e-01 | 0.1577 |
| 8971 | H1FX | GSM4909308 | Human | Breast | IDC | 8.49e-04 | -3.72e-01 | 0.158 |
| 8971 | H1FX | GSM4909309 | Human | Breast | IDC | 1.10e-02 | -3.28e-01 | 0.0483 |
| 8971 | H1FX | GSM4909311 | Human | Breast | IDC | 3.73e-28 | -4.61e-01 | 0.1534 |
| 8971 | H1FX | GSM4909312 | Human | Breast | IDC | 5.82e-14 | -4.88e-01 | 0.1552 |
| 8971 | H1FX | GSM4909313 | Human | Breast | IDC | 4.99e-05 | -3.89e-01 | 0.0391 |
| 8971 | H1FX | GSM4909318 | Human | Breast | IDC | 1.91e-17 | 8.47e-01 | 0.2031 |
| 8971 | H1FX | GSM4909319 | Human | Breast | IDC | 4.24e-31 | -2.72e-01 | 0.1563 |
| 8971 | H1FX | GSM4909321 | Human | Breast | IDC | 2.50e-36 | 6.21e-01 | 0.1559 |
| 8971 | H1FX | brca1 | Human | Breast | Precancer | 3.06e-11 | 2.80e-01 | -0.0338 |
| 8971 | H1FX | brca3 | Human | Breast | Precancer | 2.38e-03 | 2.21e-01 | -0.0263 |
| 8971 | H1FX | M2 | Human | Breast | IDC | 1.50e-03 | 3.80e-01 | 0.21 |
| 8971 | H1FX | NCCBC14 | Human | Breast | DCIS | 1.39e-04 | -2.88e-02 | 0.2021 |
| Page: 1 2 3 4 5 6 7 8 9 10 11 12 |
| Tissue | Expression Dynamics | Abbreviation |
| Breast | 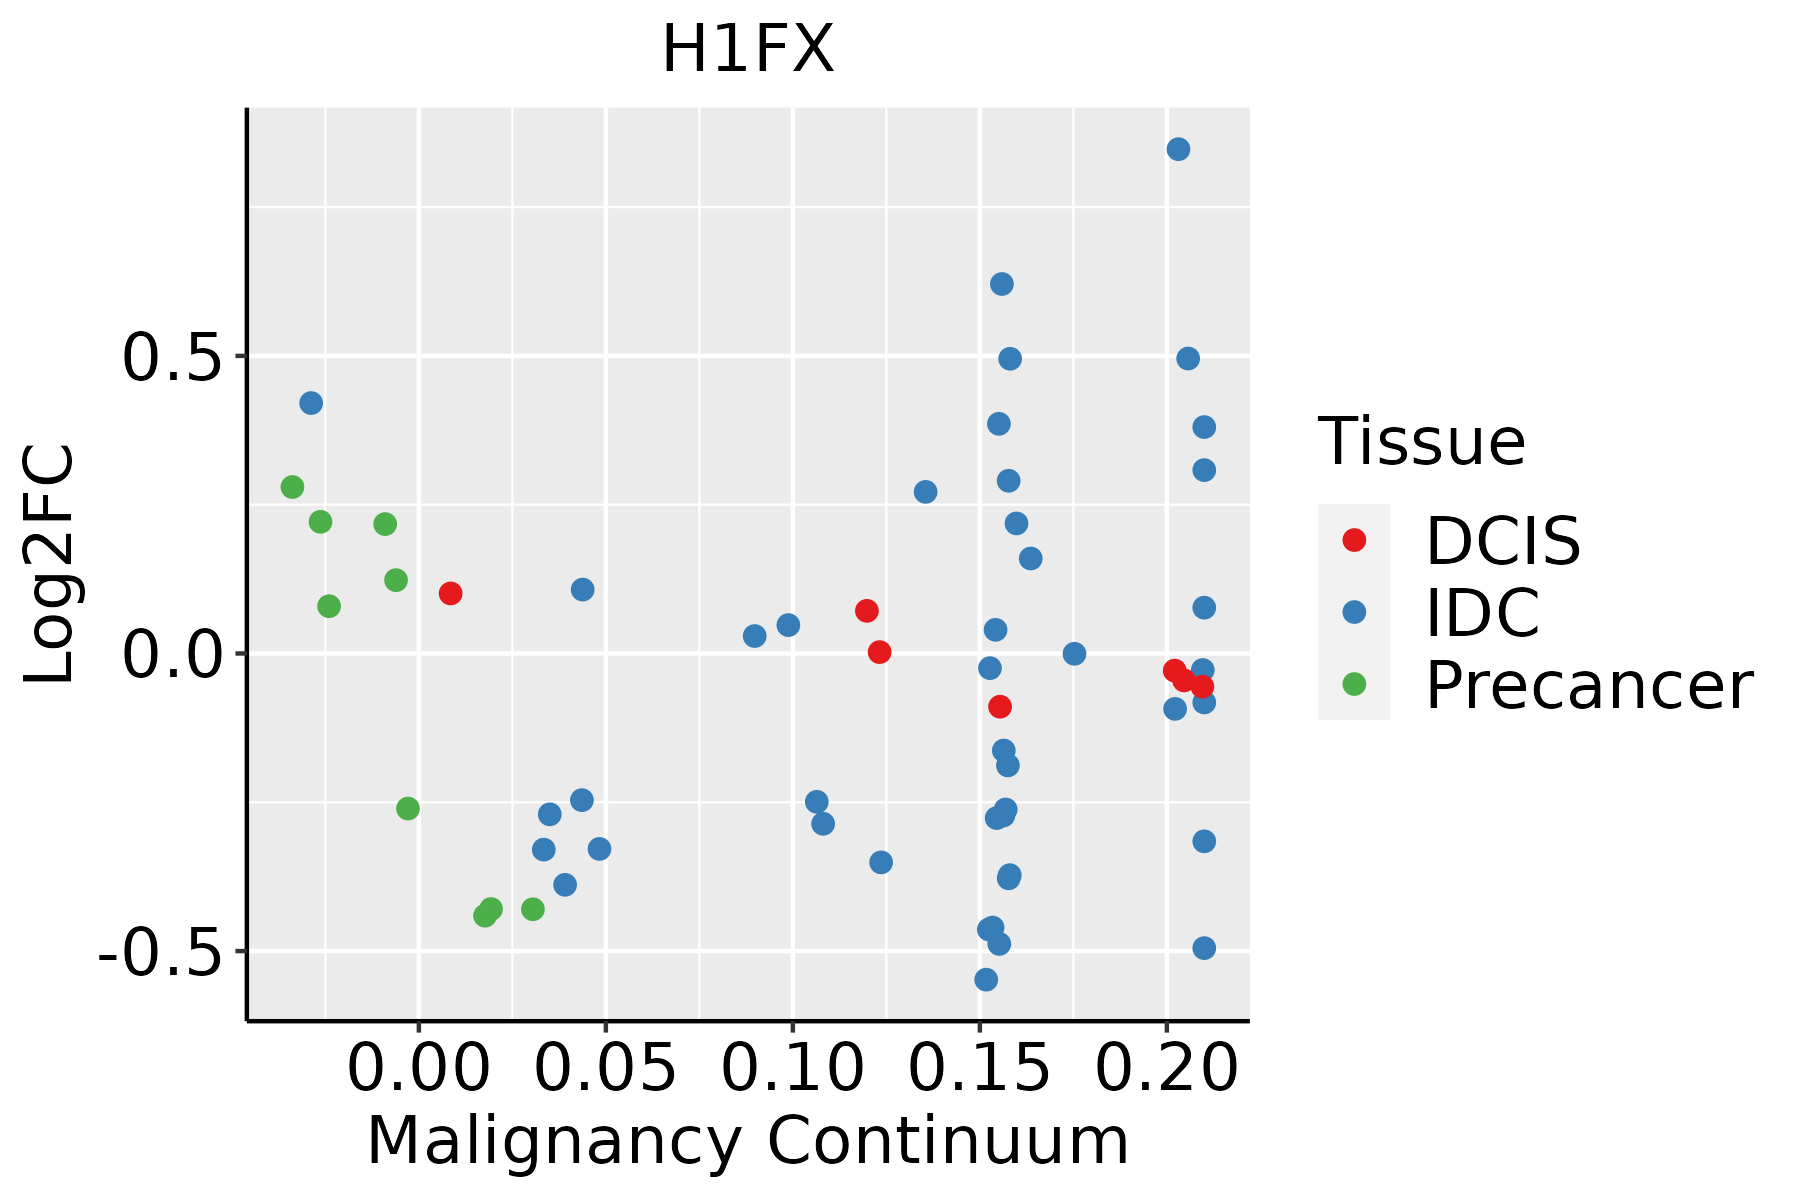 | IDC: Invasive ductal carcinoma |
| DCIS: Ductal carcinoma in situ | ||
| Precancer(BRCA1-mut): Precancerous lesion from BRCA1 mutation carriers | ||
| Cervix | 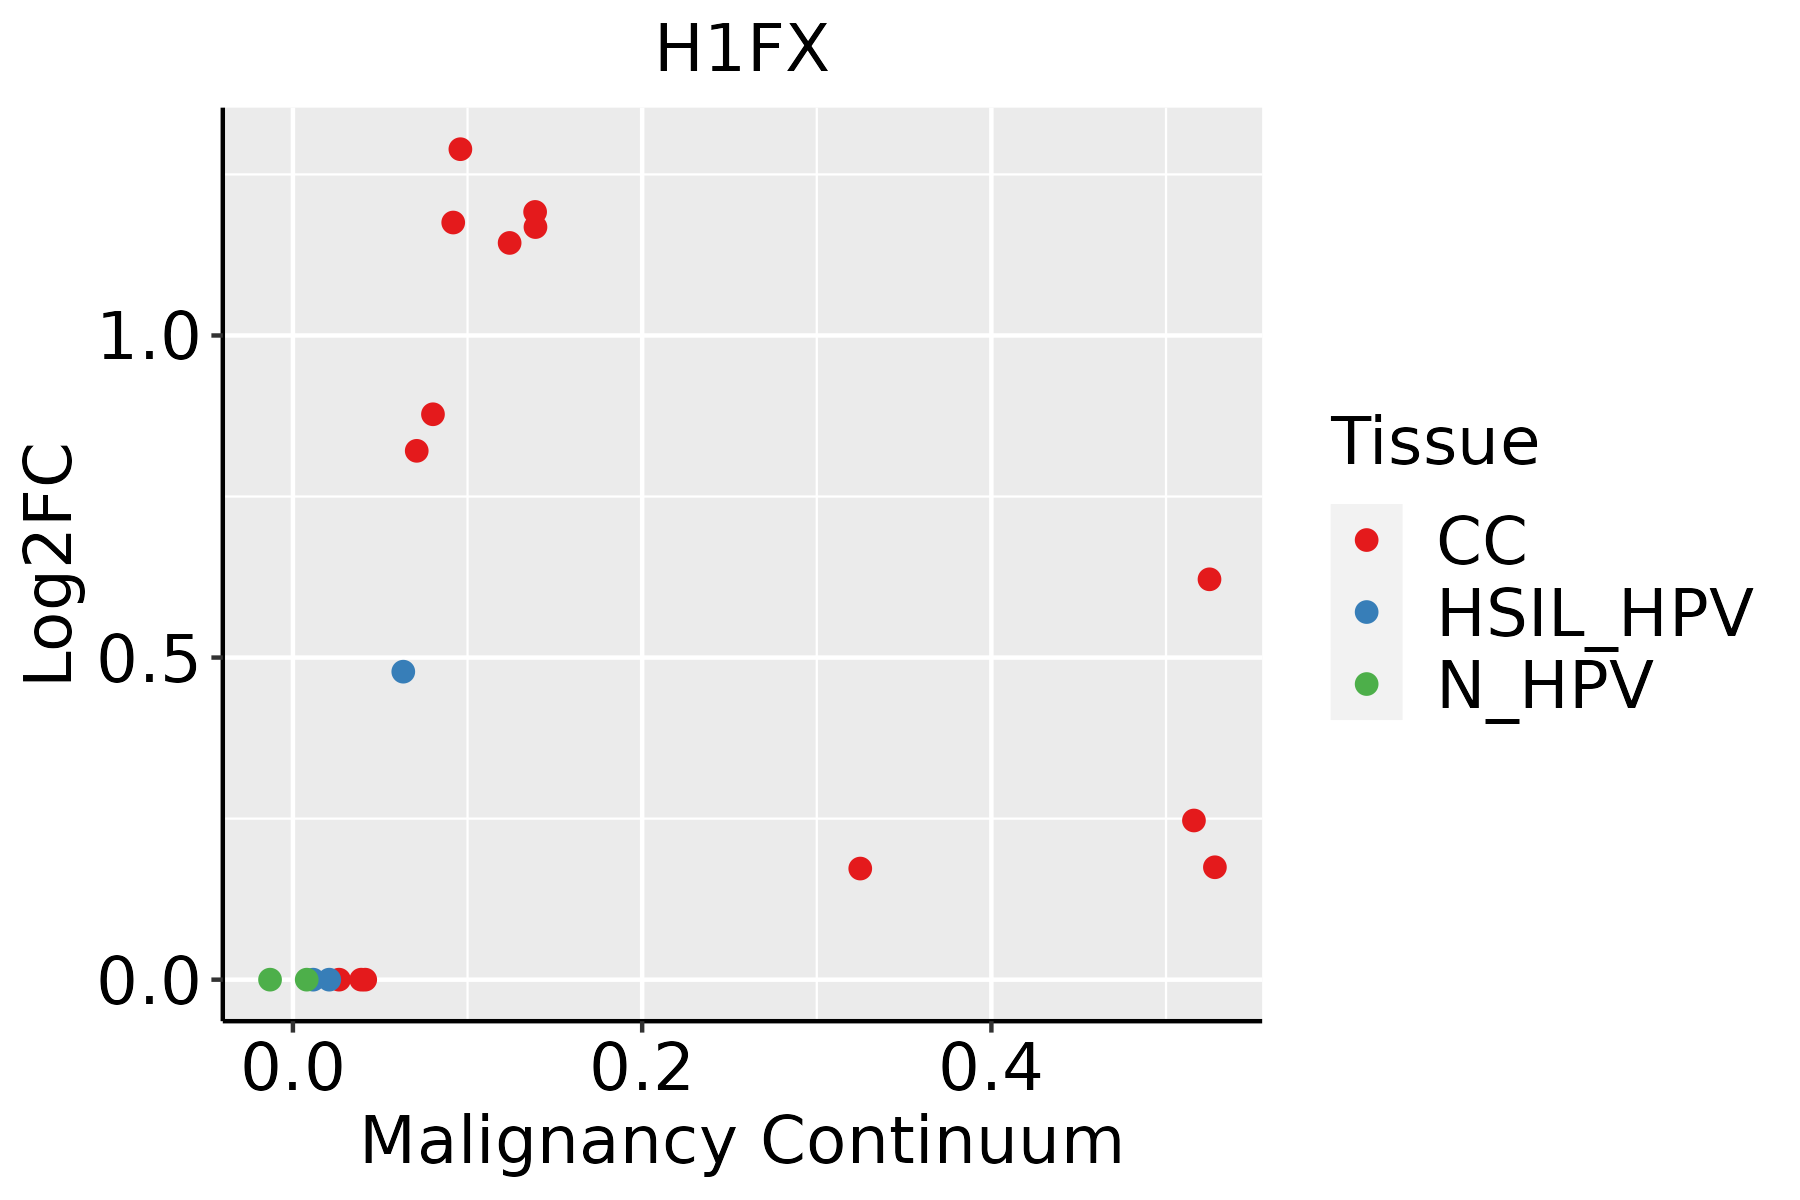 | CC: Cervix cancer |
| HSIL_HPV: HPV-infected high-grade squamous intraepithelial lesions | ||
| N_HPV: HPV-infected normal cervix | ||
| Endometrium | 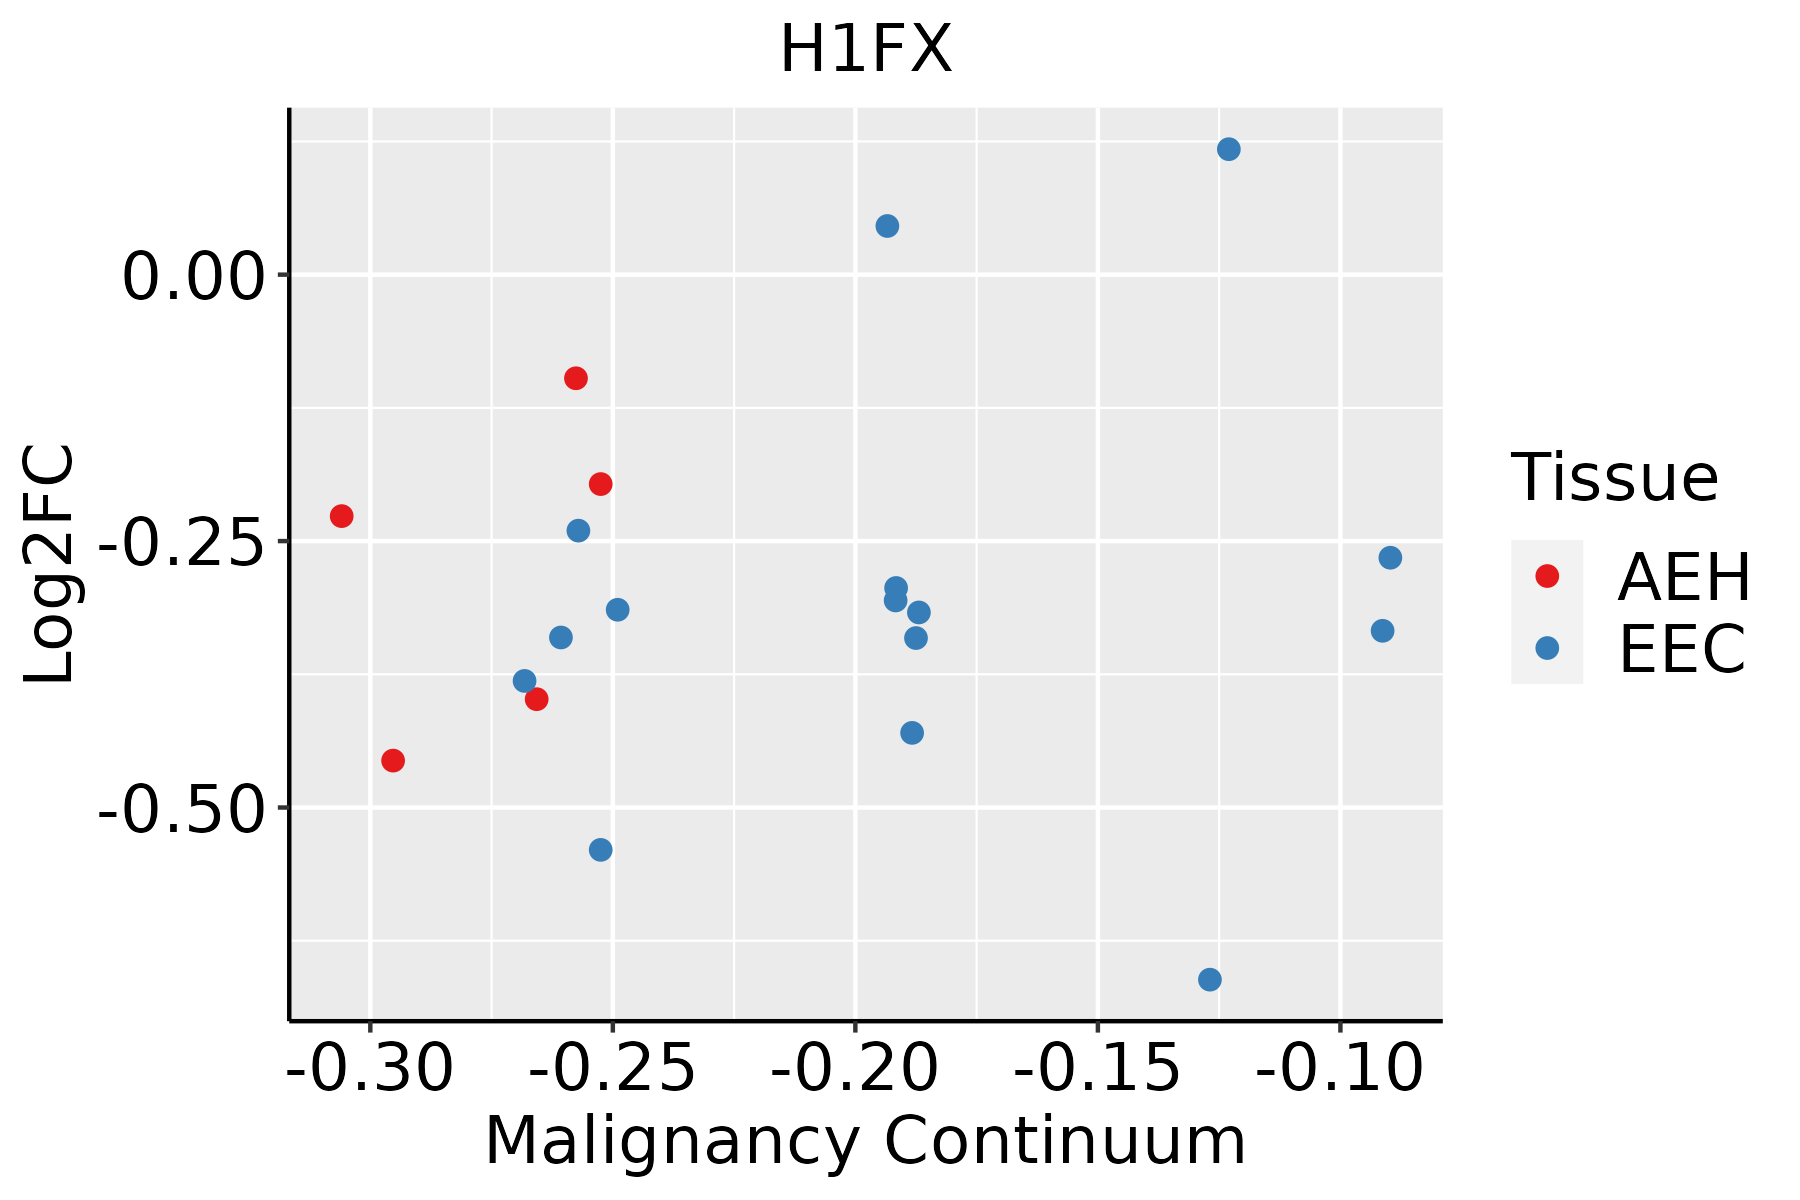 | AEH: Atypical endometrial hyperplasia |
| EEC: Endometrioid Cancer | ||
| Esophagus | 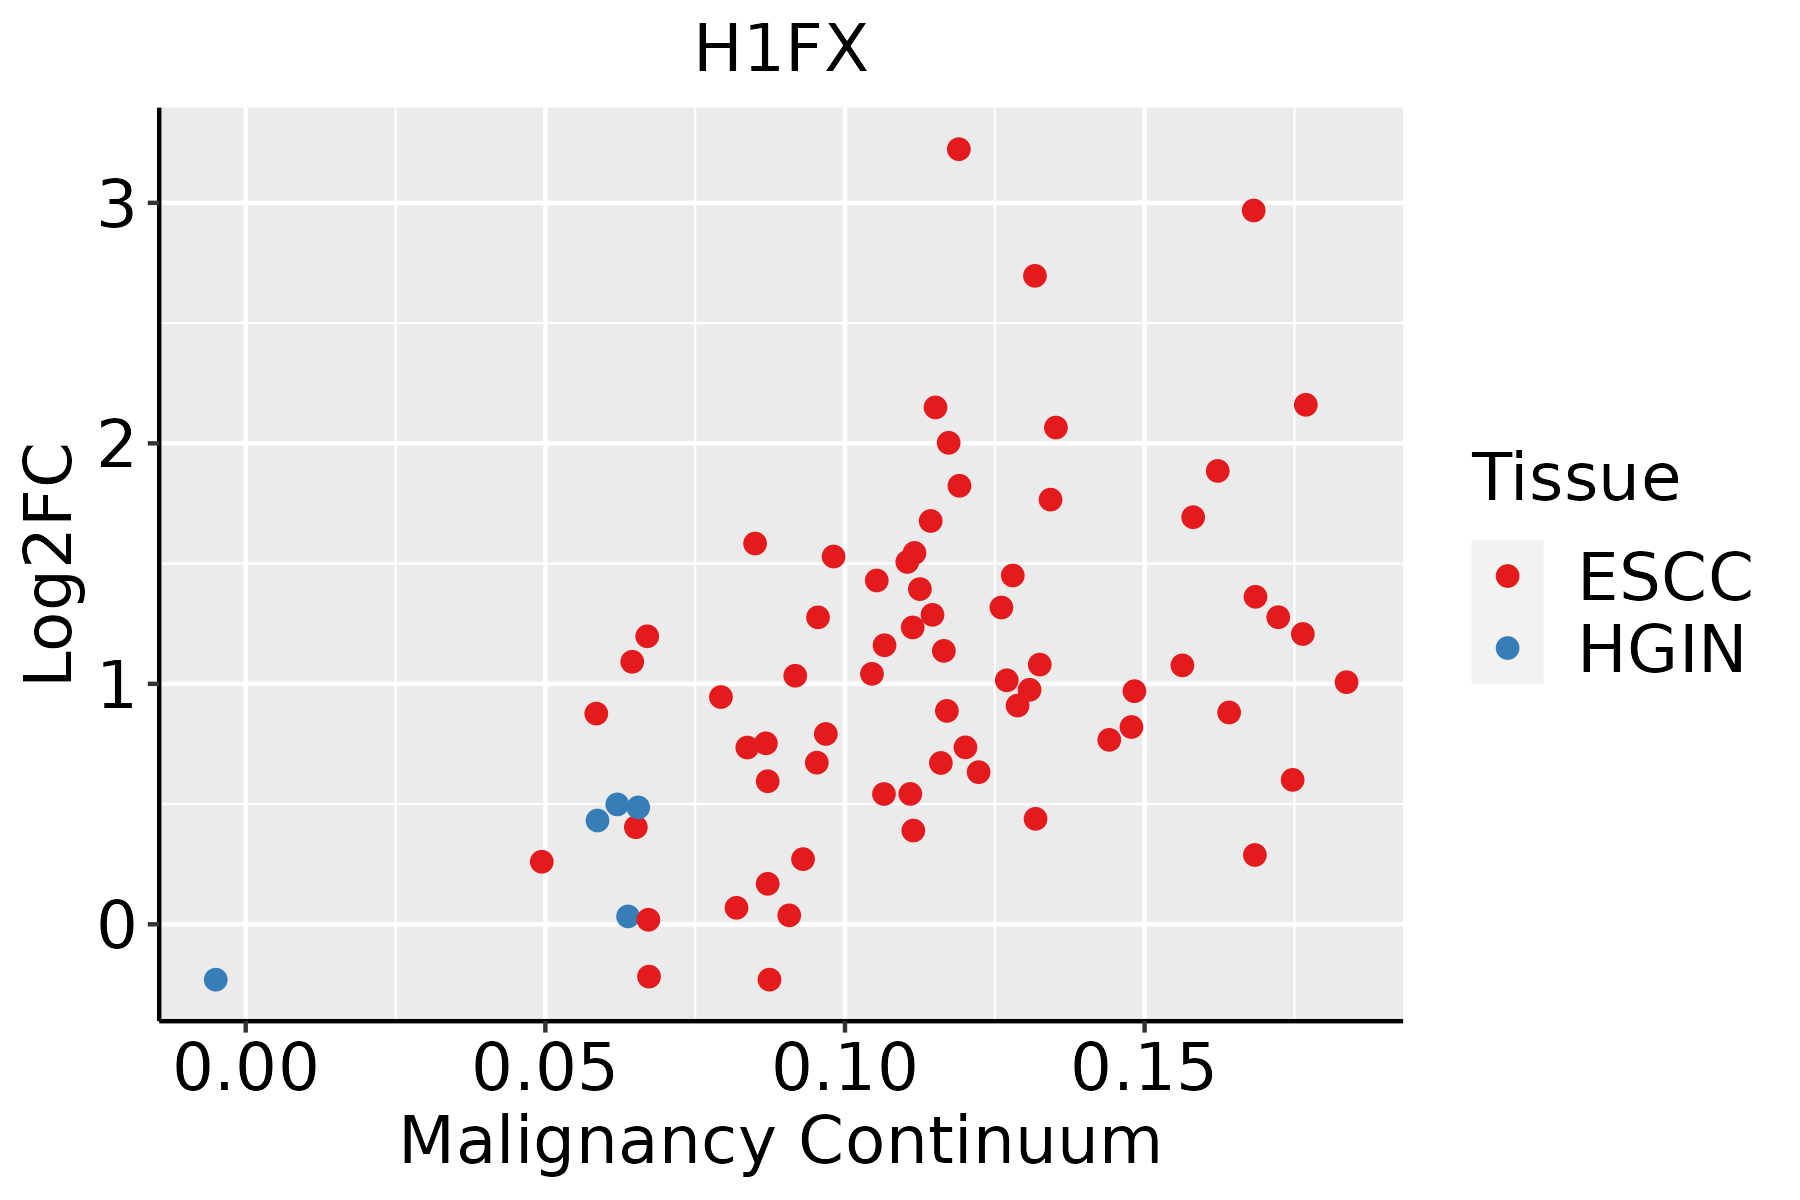 | ESCC: Esophageal squamous cell carcinoma |
| HGIN: High-grade intraepithelial neoplasias | ||
| LGIN: Low-grade intraepithelial neoplasias | ||
| GC | 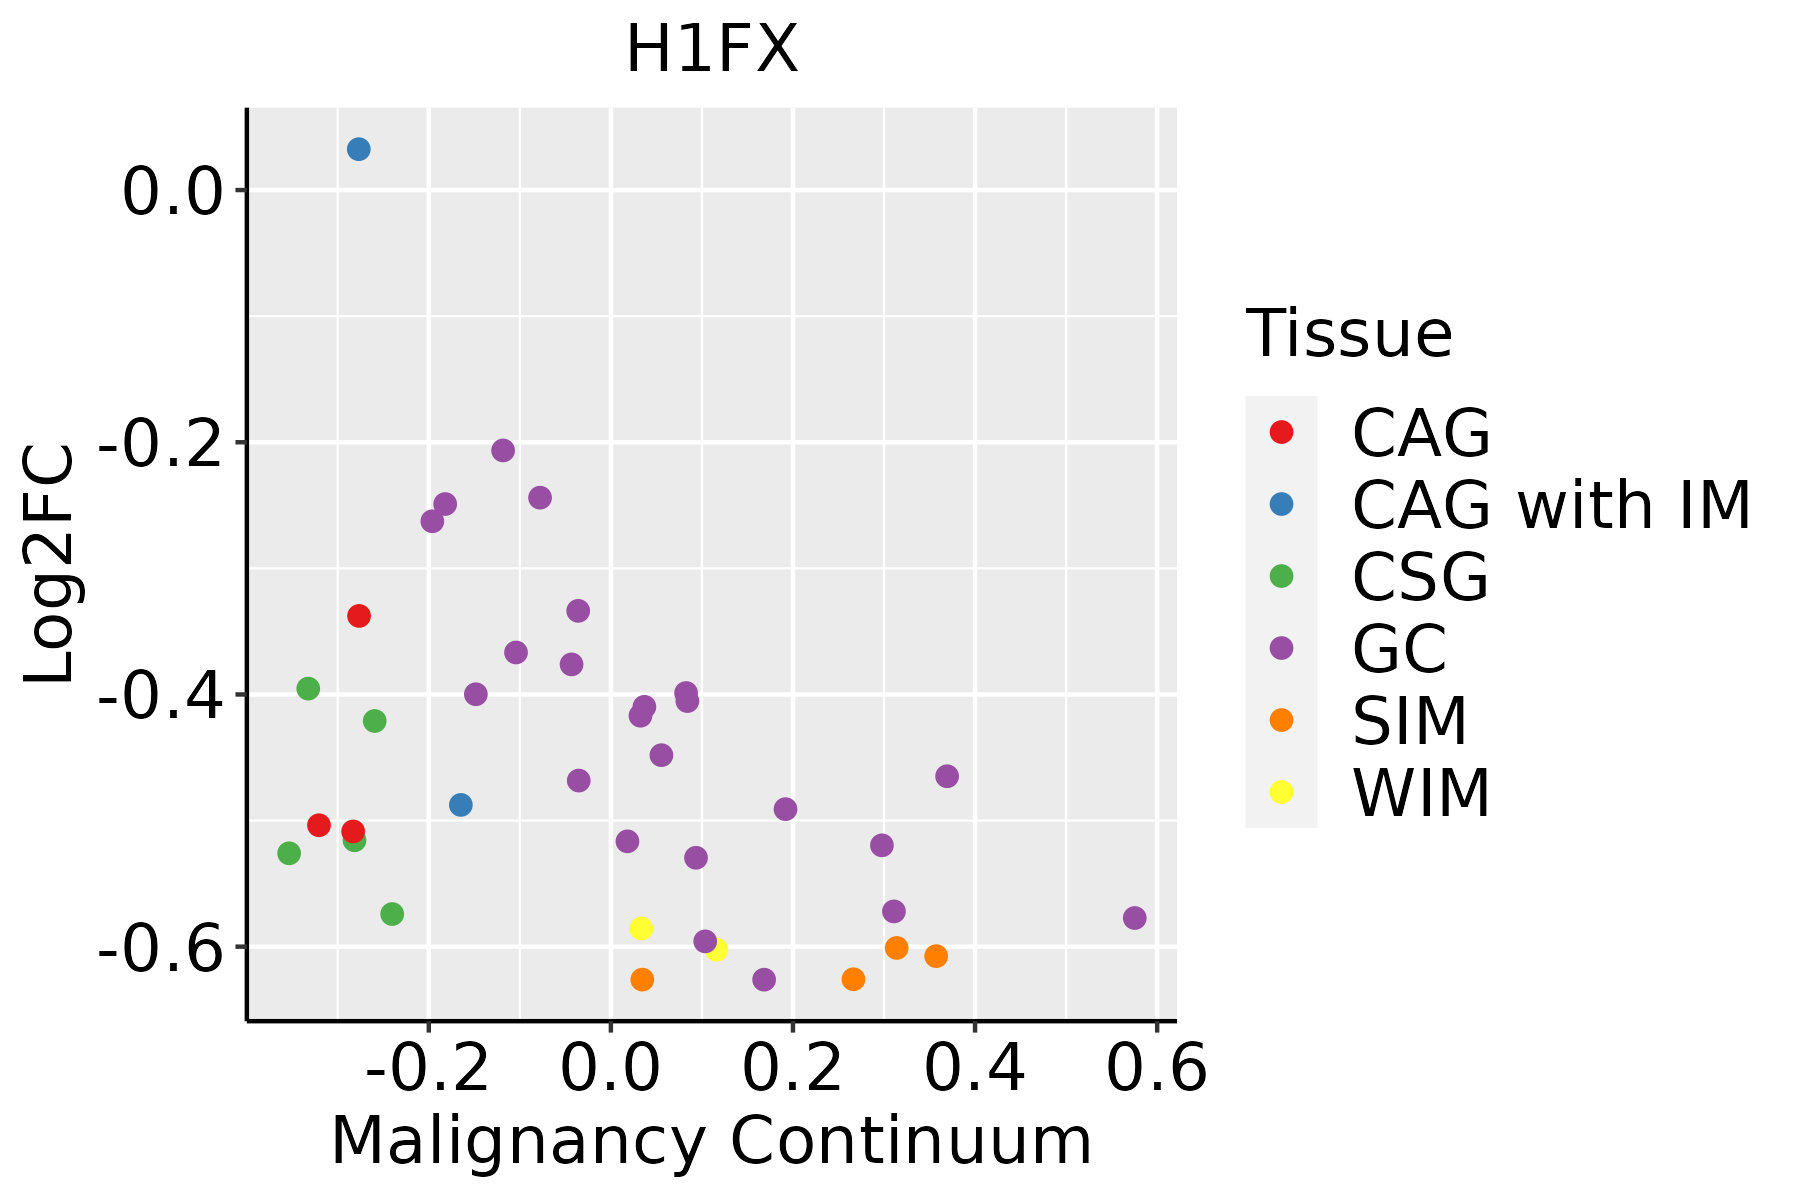 | CAG: Chronic atrophic gastritis |
| CAG with IM: Chronic atrophic gastritis with intestinal metaplasia | ||
| CSG: Chronic superficial gastritis | ||
| GC: Gastric cancer | ||
| SIM: Severe intestinal metaplasia | ||
| WIM: Wild intestinal metaplasia | ||
| Liver |  | HCC: Hepatocellular carcinoma |
| NAFLD: Non-alcoholic fatty liver disease | ||
| Oral Cavity | 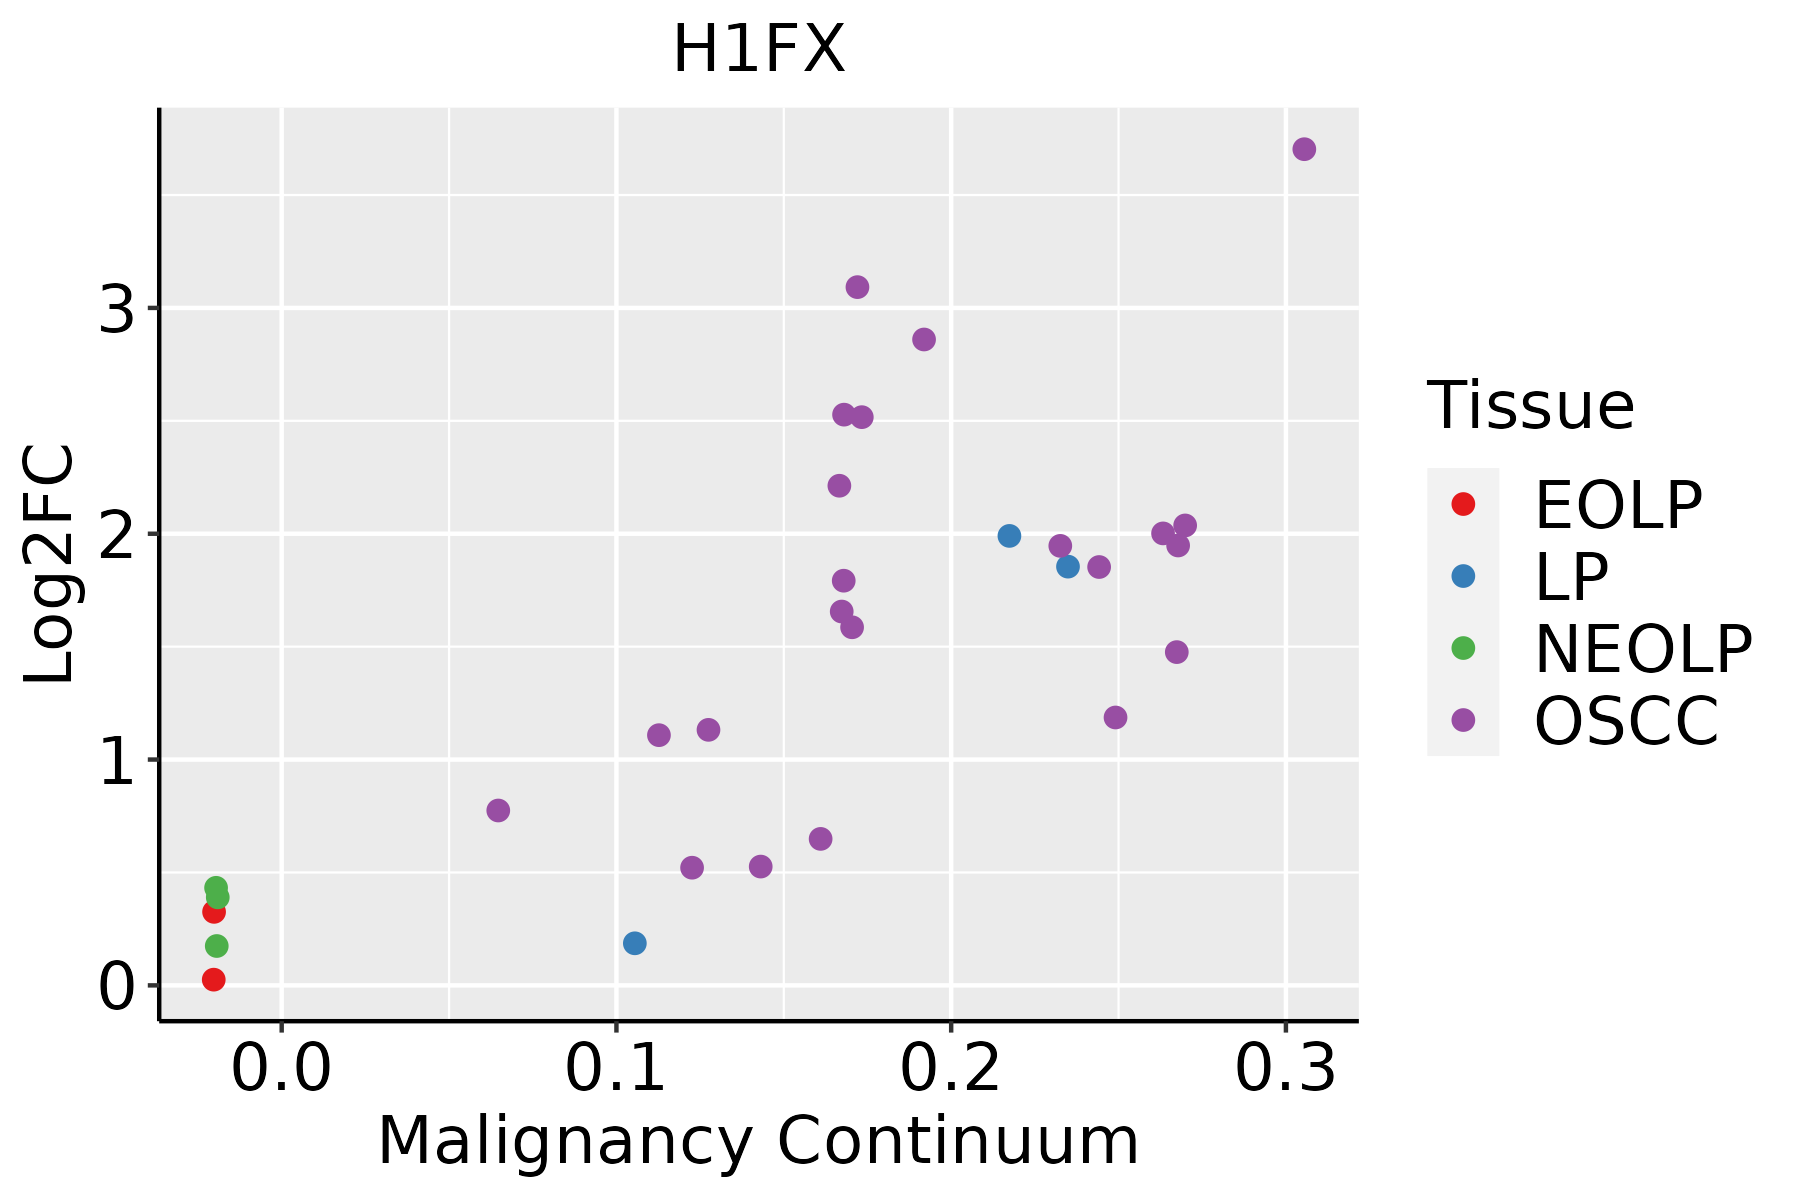 | EOLP: Erosive Oral lichen planus |
| LP: leukoplakia | ||
| NEOLP: Non-erosive oral lichen planus | ||
| OSCC: Oral squamous cell carcinoma | ||
| Prostate |  | BPH: Benign Prostatic Hyperplasia |
| Skin |  | AK: Actinic keratosis |
| cSCC: Cutaneous squamous cell carcinoma | ||
| SCCIS:squamous cell carcinoma in situ | ||
| Thyroid |  | ATC: Anaplastic thyroid cancer |
| HT: Hashimoto's thyroiditis | ||
| PTC: Papillary thyroid cancer |
| ∗log2FC in expression of this searched gene in stem-like cells from each diseased tissue sample relative to stem-like cells in normal samples in each tissue plotted against the malignancy continuum. Samples are colored based on if they are from different disease stage. |
Top |
Malignant transformation related pathway analysis |
| Find out the enriched GO biological processes and KEGG pathways involved in transition from healthy to precancer to cancer |
| Tissue | Disease Stage | Enriched GO biological Processes |
| Colorectum | AD |  |
| Colorectum | SER |  |
| Colorectum | MSS |  |
| Colorectum | MSI-H |  |
| Colorectum | FAP |  |
| ∗Top 15 enriched GO BP terms are showed in the bar plot of each disease state in each tissue. Each row represents a significant GO biological process which is colored according to the -log10(p.adjust). |
| Page: 1 2 3 4 5 6 7 8 9 |
| GO ID | Tissue | Disease Stage | Description | Gene Ratio | Bg Ratio | pvalue | p.adjust | Count |
| Page: 1 |
| Pathway ID | Tissue | Disease Stage | Description | Gene Ratio | Bg Ratio | pvalue | p.adjust | qvalue | Count |
| Page: 1 |
Top |
Cell-cell communication analysis |
| Identification of potential cell-cell interactions between two cell types and their ligand-receptor pairs for different disease states |
| Ligand | Receptor | LRpair | Pathway | Tissue | Disease Stage |
| Page: 1 |
Top |
Single-cell gene regulatory network inference analysis |
| Find out the significant the regulons (TFs) and the target genes of each regulon across cell types for different disease states |
| TF | Cell Type | Tissue | Disease Stage | Target Gene | RSS | Regulon Activity |
| ∗The dot plots of a searched regulon are shown for all cell subpopulations in each disease state of each tissue based on the regulon specific score inferred using pySCENIC and by calculating the average expression. |
| Page: 1 |
Top |
Somatic mutation of malignant transformation related genes |
| Annotation of somatic variants for genes involved in malignant transformation |
| Hugo Symbol | Variant Class | Variant Classification | dbSNP RS | HGVSc | HGVSp | HGVSp Short | SWISSPROT | BIOTYPE | SIFT | PolyPhen | Tumor Sample Barcode | Tissue | Histology | Sex | Age | Stage | Therapy Types | Drugs | Outcome |
| H1FX | SNV | Missense_Mutation | c.16G>C | p.Glu6Gln | p.E6Q | Q92522 | protein_coding | tolerated_low_confidence(0.05) | benign(0.174) | TCGA-IR-A3LA-01 | Cervix | cervical & endocervical cancer | Female | <65 | I/II | Chemotherapy | cisplatin | CR | |
| H1FX | SNV | Missense_Mutation | c.137N>A | p.Gly46Asp | p.G46D | Q92522 | protein_coding | deleterious(0) | probably_damaging(0.998) | TCGA-AZ-6598-01 | Colorectum | colon adenocarcinoma | Female | >=65 | I/II | Unknown | Unknown | SD | |
| H1FX | SNV | Missense_Mutation | rs774541988 | c.569N>T | p.Ala190Val | p.A190V | Q92522 | protein_coding | tolerated_low_confidence(0.28) | benign(0.019) | TCGA-CM-4743-01 | Colorectum | colon adenocarcinoma | Male | >=65 | I/II | Chemotherapy | capecitabine | SD |
| H1FX | SNV | Missense_Mutation | novel | c.527N>A | p.Ala176Asp | p.A176D | Q92522 | protein_coding | deleterious_low_confidence(0.01) | benign(0.1) | TCGA-E6-A2P9-01 | Endometrium | uterine corpus endometrioid carcinoma | Female | >=65 | I/II | Unknown | Unknown | SD |
| H1FX | SNV | Missense_Mutation | novel | c.568G>A | p.Ala190Thr | p.A190T | Q92522 | protein_coding | tolerated_low_confidence(0.38) | benign(0.444) | TCGA-FI-A2D5-01 | Endometrium | uterine corpus endometrioid carcinoma | Female | <65 | III/IV | Chemotherapy | carboplatinum | PD |
| H1FX | SNV | Missense_Mutation | c.537N>C | p.Lys179Asn | p.K179N | Q92522 | protein_coding | tolerated_low_confidence(0.06) | benign(0.42) | TCGA-55-6712-01 | Lung | lung adenocarcinoma | Male | >=65 | I/II | Chemotherapy | carboplatin | PD | |
| H1FX | SNV | Missense_Mutation | novel | c.637N>G | p.Lys213Glu | p.K213E | Q92522 | protein_coding | deleterious_low_confidence(0) | probably_damaging(0.986) | TCGA-O2-A52N-01 | Lung | lung squamous cell carcinoma | Male | >=65 | I/II | Unknown | Unknown | SD |
| H1FX | deletion | Frame_Shift_Del | novel | c.448_449delGG | p.Gly150ArgfsTer88 | p.G150Rfs*88 | Q92522 | protein_coding | TCGA-49-AARE-01 | Lung | lung adenocarcinoma | Female | <65 | I/II | Unknown | Unknown | PD | ||
| H1FX | SNV | Missense_Mutation | novel | c.438N>C | p.Lys146Asn | p.K146N | Q92522 | protein_coding | deleterious(0) | benign(0.035) | TCGA-CV-A6JN-01 | Oral cavity | head & neck squamous cell carcinoma | Male | <65 | I/II | Unknown | Unknown | SD |
| H1FX | SNV | Missense_Mutation | novel | c.43N>A | p.Glu15Lys | p.E15K | Q92522 | protein_coding | tolerated(0.25) | benign(0.003) | TCGA-4C-A93U-01 | Thyroid | thyroid carcinoma | Female | >=65 | I/II | Unknown | Unknown | SD |
| Page: 1 2 |
Top |
Related drugs of malignant transformation related genes |
| Identification of chemicals and drugs interact with genes involved in malignant transfromation |
| (DGIdb 4.0) |
| Entrez ID | Symbol | Category | Interaction Types | Drug Claim Name | Drug Name | PMIDs |
| Page: 1 |

Copyright 2023-Present -The University of Texas Health Science Center at Houston |