
|
|||||
|
 | |
| |
| |
| |
| |
| |
|
Gene: H19 |
Gene summary for H19 |
| Gene information | Species | Human | Gene symbol | H19 | Gene ID | 283120 |
| Gene name | H19 imprinted maternally expressed transcript | |
| Gene Alias | ASM | |
| Cytomap | 11p15.5 | |
| Gene Type | ncRNA | GO ID | GO:0000302 | UniProtAcc | NA |
Top |
Malignant transformation analysis |
| Identification of the aberrant gene expression in precancerous and cancerous lesions by comparing the gene expression of stem-like cells in diseased tissues with normal stem cells |
| Entrez ID | Symbol | Replicates | Species | Organ | Tissue | Adj P-value | Log2FC | Malignancy |
| 283120 | H19 | LZE2D | Human | Esophagus | HGIN | 5.68e-15 | 2.80e+00 | 0.0642 |
| 283120 | H19 | LZE2T | Human | Esophagus | ESCC | 1.80e-11 | 1.16e+00 | 0.082 |
| 283120 | H19 | LZE8T | Human | Esophagus | ESCC | 9.77e-06 | 5.77e-01 | 0.067 |
| 283120 | H19 | LZE22D1 | Human | Esophagus | HGIN | 1.88e-18 | 9.45e-01 | 0.0595 |
| 283120 | H19 | LZE22T | Human | Esophagus | ESCC | 6.43e-20 | 1.91e+00 | 0.068 |
| 283120 | H19 | LZE24T | Human | Esophagus | ESCC | 7.41e-13 | 8.11e-01 | 0.0596 |
| 283120 | H19 | S41 | Human | Liver | Cirrhotic | 2.57e-02 | 3.84e-01 | -0.0343 |
| 283120 | H19 | S42 | Human | Liver | HCC | 1.82e-02 | 6.56e-01 | -0.0103 |
| 283120 | H19 | S43 | Human | Liver | Cirrhotic | 1.60e-14 | 7.05e-01 | -0.0187 |
| 283120 | H19 | HCC1 | Human | Liver | HCC | 3.29e-07 | 3.70e+00 | 0.5336 |
| 283120 | H19 | HCC2 | Human | Liver | HCC | 2.13e-19 | 5.03e+00 | 0.5341 |
| 283120 | H19 | RNA-P17T-P17T-2 | Human | Lung | IAC | 2.13e-03 | 8.29e-01 | 0.3371 |
| 283120 | H19 | RNA-P17T-P17T-6 | Human | Lung | IAC | 4.71e-02 | 8.38e-01 | 0.3385 |
| 283120 | H19 | RNA-P17T-P17T-8 | Human | Lung | IAC | 5.44e-06 | 1.01e+00 | 0.3329 |
| Page: 1 |
| Tissue | Expression Dynamics | Abbreviation |
| Esophagus | 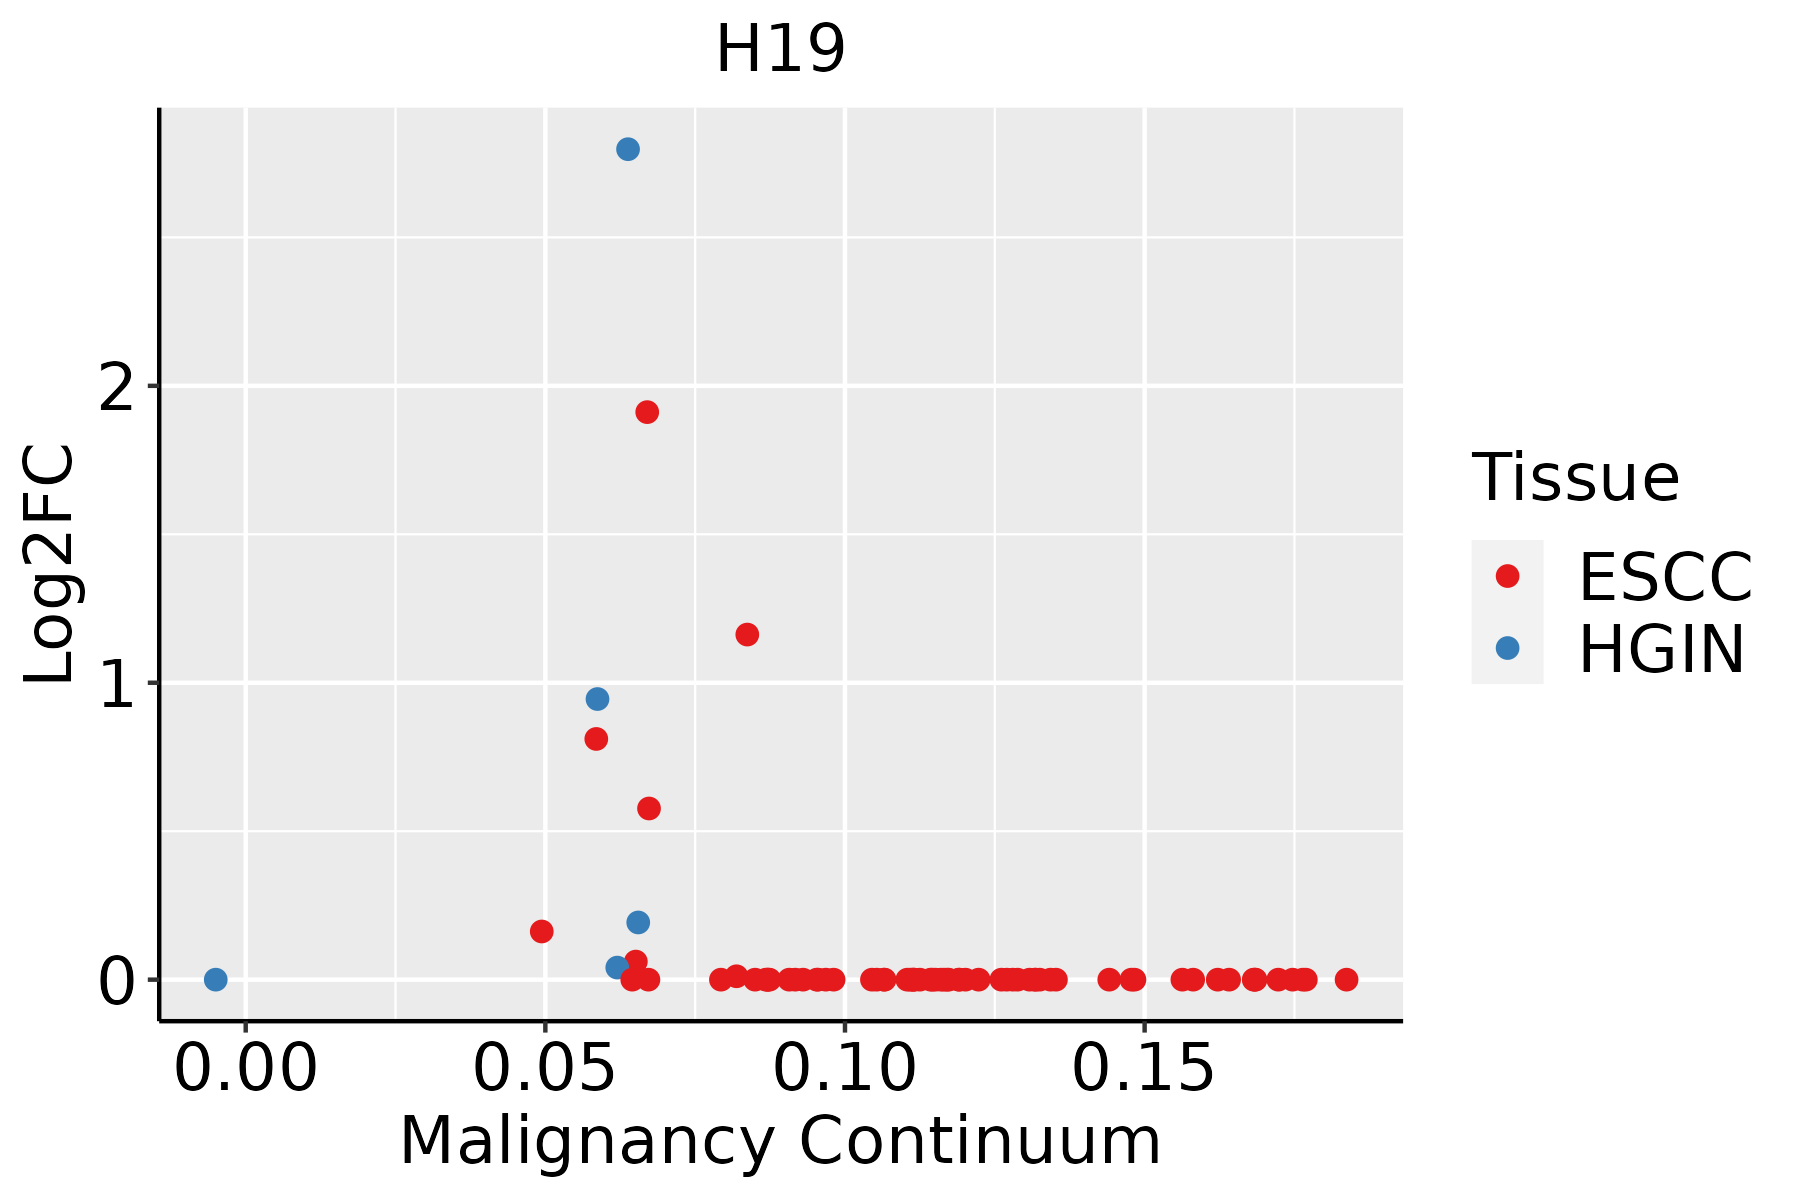 | ESCC: Esophageal squamous cell carcinoma |
| HGIN: High-grade intraepithelial neoplasias | ||
| LGIN: Low-grade intraepithelial neoplasias | ||
| Liver |  | HCC: Hepatocellular carcinoma |
| NAFLD: Non-alcoholic fatty liver disease | ||
| Lung | 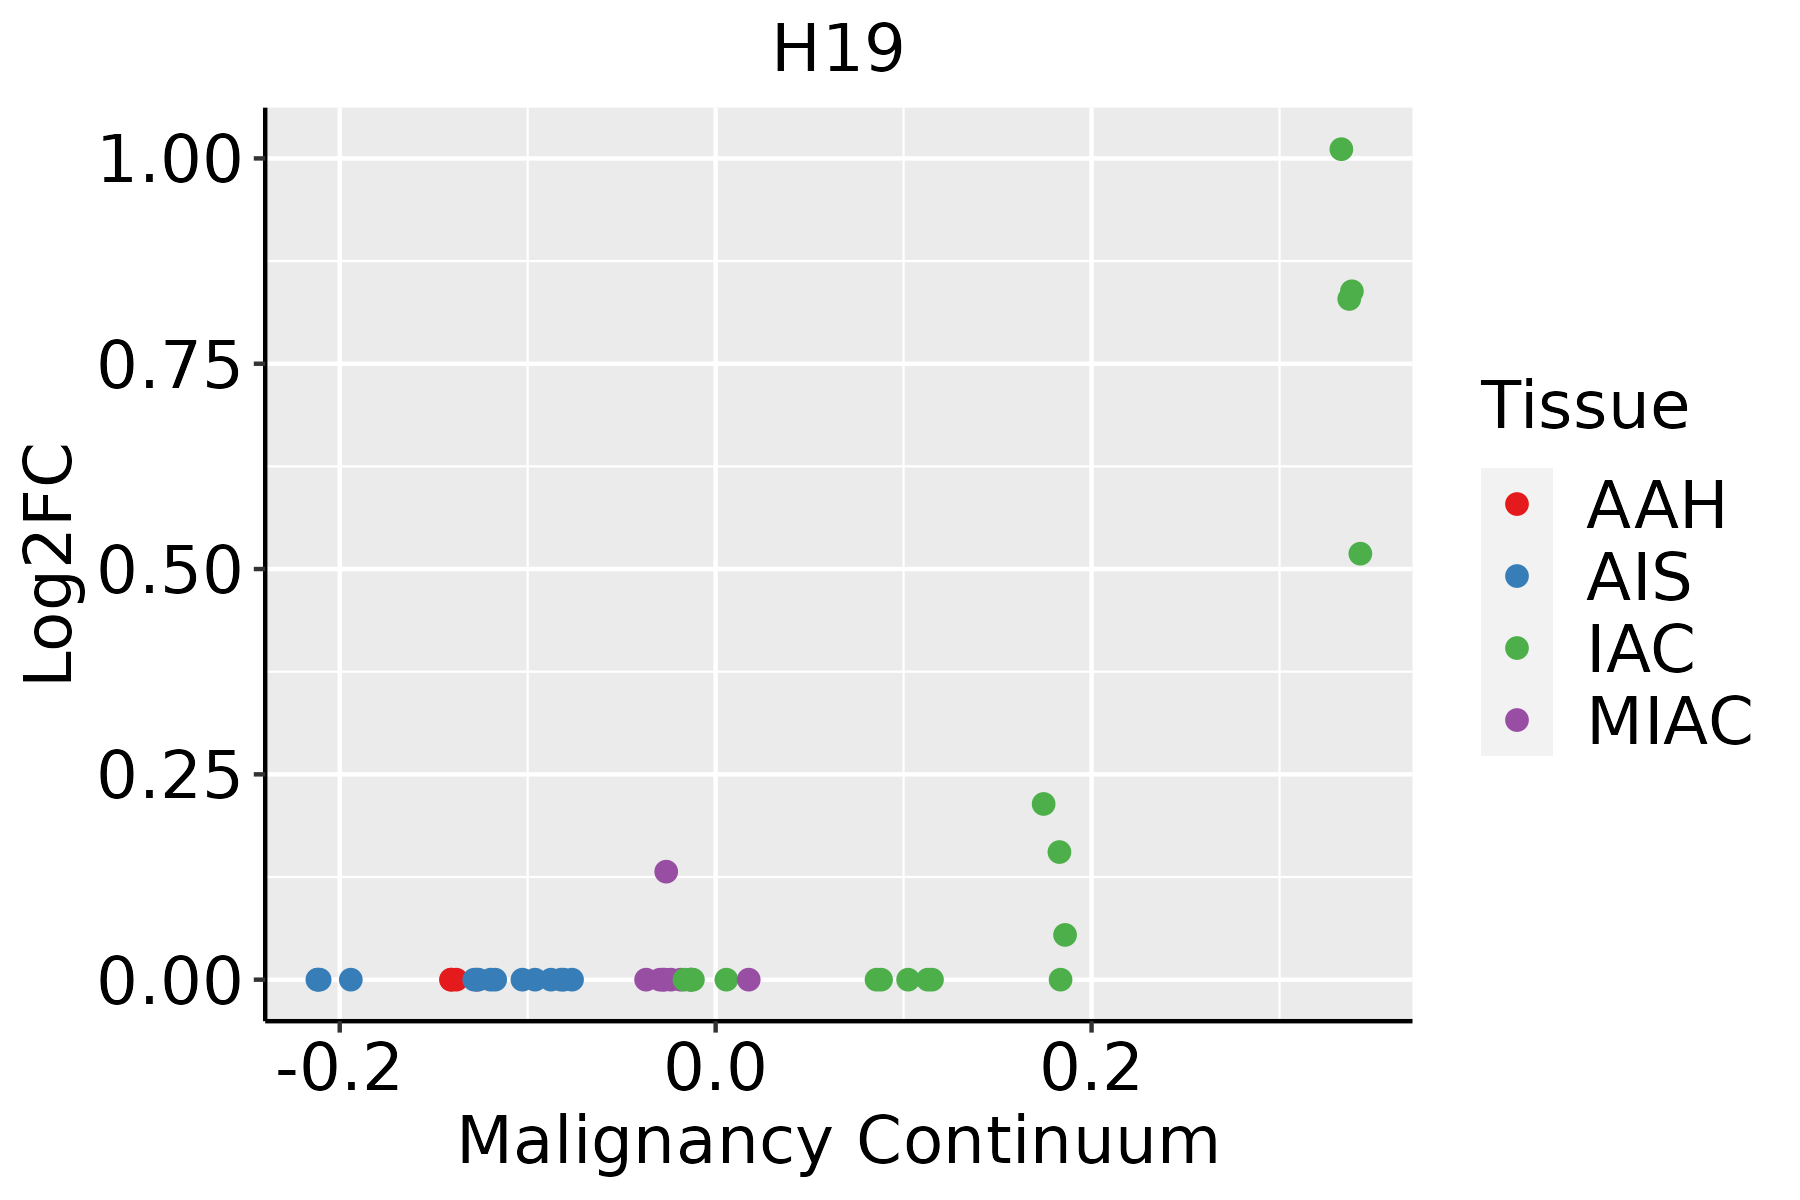 | AAH: Atypical adenomatous hyperplasia |
| AIS: Adenocarcinoma in situ | ||
| IAC: Invasive lung adenocarcinoma | ||
| MIA: Minimally invasive adenocarcinoma |
| ∗log2FC in expression of this searched gene in stem-like cells from each diseased tissue sample relative to stem-like cells in normal samples in each tissue plotted against the malignancy continuum. Samples are colored based on if they are from different disease stage. |
Top |
Malignant transformation related pathway analysis |
| Find out the enriched GO biological processes and KEGG pathways involved in transition from healthy to precancer to cancer |
| Tissue | Disease Stage | Enriched GO biological Processes |
| Colorectum | AD |  |
| Colorectum | SER |  |
| Colorectum | MSS |  |
| Colorectum | MSI-H |  |
| Colorectum | FAP |  |
| ∗Top 15 enriched GO BP terms are showed in the bar plot of each disease state in each tissue. Each row represents a significant GO biological process which is colored according to the -log10(p.adjust). |
| Page: 1 2 3 4 5 6 7 8 9 |
| GO ID | Tissue | Disease Stage | Description | Gene Ratio | Bg Ratio | pvalue | p.adjust | Count |
| GO:004603427 | Esophagus | HGIN | ATP metabolic process | 101/2587 | 277/18723 | 1.53e-21 | 1.02e-18 | 101 |
| GO:000914419 | Esophagus | HGIN | purine nucleoside triphosphate metabolic process | 36/2587 | 88/18723 | 3.49e-10 | 3.05e-08 | 36 |
| GO:000914518 | Esophagus | HGIN | purine nucleoside triphosphate biosynthetic process | 31/2587 | 69/18723 | 3.51e-10 | 3.05e-08 | 31 |
| GO:000920618 | Esophagus | HGIN | purine ribonucleoside triphosphate biosynthetic process | 30/2587 | 68/18723 | 1.16e-09 | 9.27e-08 | 30 |
| GO:000920518 | Esophagus | HGIN | purine ribonucleoside triphosphate metabolic process | 33/2587 | 82/18723 | 3.10e-09 | 2.27e-07 | 33 |
| GO:000697927 | Esophagus | HGIN | response to oxidative stress | 107/2587 | 446/18723 | 3.91e-09 | 2.76e-07 | 107 |
| GO:000675417 | Esophagus | HGIN | ATP biosynthetic process | 26/2587 | 57/18723 | 6.19e-09 | 4.04e-07 | 26 |
| GO:000920117 | Esophagus | HGIN | ribonucleoside triphosphate biosynthetic process | 30/2587 | 74/18723 | 1.30e-08 | 8.15e-07 | 30 |
| GO:000914120 | Esophagus | HGIN | nucleoside triphosphate metabolic process | 39/2587 | 112/18723 | 1.56e-08 | 9.53e-07 | 39 |
| GO:000919917 | Esophagus | HGIN | ribonucleoside triphosphate metabolic process | 33/2587 | 89/18723 | 3.42e-08 | 1.97e-06 | 33 |
| GO:000914218 | Esophagus | HGIN | nucleoside triphosphate biosynthetic process | 32/2587 | 85/18723 | 3.61e-08 | 2.04e-06 | 32 |
| GO:006219727 | Esophagus | HGIN | cellular response to chemical stress | 76/2587 | 337/18723 | 8.00e-06 | 2.41e-04 | 76 |
| GO:003459926 | Esophagus | HGIN | cellular response to oxidative stress | 65/2587 | 288/18723 | 3.42e-05 | 8.66e-04 | 65 |
| GO:000915219 | Esophagus | HGIN | purine ribonucleotide biosynthetic process | 43/2587 | 169/18723 | 3.94e-05 | 9.74e-04 | 43 |
| GO:000030226 | Esophagus | HGIN | response to reactive oxygen species | 52/2587 | 222/18723 | 7.30e-05 | 1.66e-03 | 52 |
| GO:004639019 | Esophagus | HGIN | ribose phosphate biosynthetic process | 46/2587 | 190/18723 | 8.06e-05 | 1.79e-03 | 46 |
| GO:004593626 | Esophagus | HGIN | negative regulation of phosphate metabolic process | 89/2587 | 441/18723 | 1.24e-04 | 2.54e-03 | 89 |
| GO:001056326 | Esophagus | HGIN | negative regulation of phosphorus metabolic process | 89/2587 | 442/18723 | 1.34e-04 | 2.71e-03 | 89 |
| GO:007252216 | Esophagus | HGIN | purine-containing compound biosynthetic process | 47/2587 | 200/18723 | 1.46e-04 | 2.91e-03 | 47 |
| GO:000616416 | Esophagus | HGIN | purine nucleotide biosynthetic process | 45/2587 | 191/18723 | 1.87e-04 | 3.52e-03 | 45 |
| Page: 1 2 3 4 5 6 7 8 9 10 11 12 |
| Pathway ID | Tissue | Disease Stage | Description | Gene Ratio | Bg Ratio | pvalue | p.adjust | qvalue | Count |
| Page: 1 |
Top |
Cell-cell communication analysis |
| Identification of potential cell-cell interactions between two cell types and their ligand-receptor pairs for different disease states |
| Ligand | Receptor | LRpair | Pathway | Tissue | Disease Stage |
| Page: 1 |
Top |
Single-cell gene regulatory network inference analysis |
| Find out the significant the regulons (TFs) and the target genes of each regulon across cell types for different disease states |
| TF | Cell Type | Tissue | Disease Stage | Target Gene | RSS | Regulon Activity |
| ∗The dot plots of a searched regulon are shown for all cell subpopulations in each disease state of each tissue based on the regulon specific score inferred using pySCENIC and by calculating the average expression. |
| Page: 1 |
Top |
Somatic mutation of malignant transformation related genes |
| Annotation of somatic variants for genes involved in malignant transformation |
| Hugo Symbol | Variant Class | Variant Classification | dbSNP RS | HGVSc | HGVSp | HGVSp Short | SWISSPROT | BIOTYPE | SIFT | PolyPhen | Tumor Sample Barcode | Tissue | Histology | Sex | Age | Stage | Therapy Types | Drugs | Outcome |
| Page: 1 |
Top |
Related drugs of malignant transformation related genes |
| Identification of chemicals and drugs interact with genes involved in malignant transfromation |
| (DGIdb 4.0) |
| Entrez ID | Symbol | Category | Interaction Types | Drug Claim Name | Drug Name | PMIDs |
| 283120 | H19 | CLINICALLY ACTIONABLE | Platinum compounds | 26729200 | ||
| 283120 | H19 | CLINICALLY ACTIONABLE | HORMONES | 8785513 |
| Page: 1 |

Copyright 2023-Present -The University of Texas Health Science Center at Houston |