
|
|||||
|
 | |
| |
| |
| |
| |
| |
|
Gene: GZMB |
Gene summary for GZMB |
| Gene information | Species | Human | Gene symbol | GZMB | Gene ID | 3002 |
| Gene name | granzyme B | |
| Gene Alias | C11 | |
| Cytomap | 14q12 | |
| Gene Type | protein-coding | GO ID | GO:0001844 | UniProtAcc | J3KQ52 |
Top |
Malignant transformation analysis |
| Identification of the aberrant gene expression in precancerous and cancerous lesions by comparing the gene expression of stem-like cells in diseased tissues with normal stem cells |
| Entrez ID | Symbol | Replicates | Species | Organ | Tissue | Adj P-value | Log2FC | Malignancy |
| 3002 | GZMB | LZE4T | Human | Esophagus | ESCC | 2.62e-05 | 6.20e-01 | 0.0811 |
| 3002 | GZMB | LZE24T | Human | Esophagus | ESCC | 1.67e-03 | 1.47e-01 | 0.0596 |
| 3002 | GZMB | LZE6T | Human | Esophagus | ESCC | 1.71e-22 | 2.56e+00 | 0.0845 |
| 3002 | GZMB | C21 | Human | Oral cavity | OSCC | 1.03e-49 | 1.62e+00 | 0.2678 |
| 3002 | GZMB | C30 | Human | Oral cavity | OSCC | 3.05e-14 | 7.85e-01 | 0.3055 |
| 3002 | GZMB | C38 | Human | Oral cavity | OSCC | 3.02e-13 | 3.09e+00 | 0.172 |
| 3002 | GZMB | C46 | Human | Oral cavity | OSCC | 4.35e-09 | 2.60e-01 | 0.1673 |
| 3002 | GZMB | C51 | Human | Oral cavity | OSCC | 1.09e-16 | 6.68e-01 | 0.2674 |
| 3002 | GZMB | C06 | Human | Oral cavity | OSCC | 1.18e-04 | 8.18e-01 | 0.2699 |
| 3002 | GZMB | C07 | Human | Oral cavity | OSCC | 5.81e-07 | 5.63e-01 | 0.2491 |
| 3002 | GZMB | C08 | Human | Oral cavity | OSCC | 2.25e-09 | 2.80e-01 | 0.1919 |
| 3002 | GZMB | C09 | Human | Oral cavity | OSCC | 1.13e-07 | 2.29e-01 | 0.1431 |
| 3002 | GZMB | LN22 | Human | Oral cavity | OSCC | 4.83e-15 | 1.73e+00 | 0.1733 |
| 3002 | GZMB | LN38 | Human | Oral cavity | OSCC | 3.54e-02 | 1.57e+00 | 0.168 |
| 3002 | GZMB | LN46 | Human | Oral cavity | OSCC | 2.19e-18 | 4.54e-01 | 0.1666 |
| 3002 | GZMB | EOLP-1 | Human | Oral cavity | EOLP | 7.02e-09 | 4.74e-01 | -0.0202 |
| Page: 1 |
| Tissue | Expression Dynamics | Abbreviation |
| Esophagus | 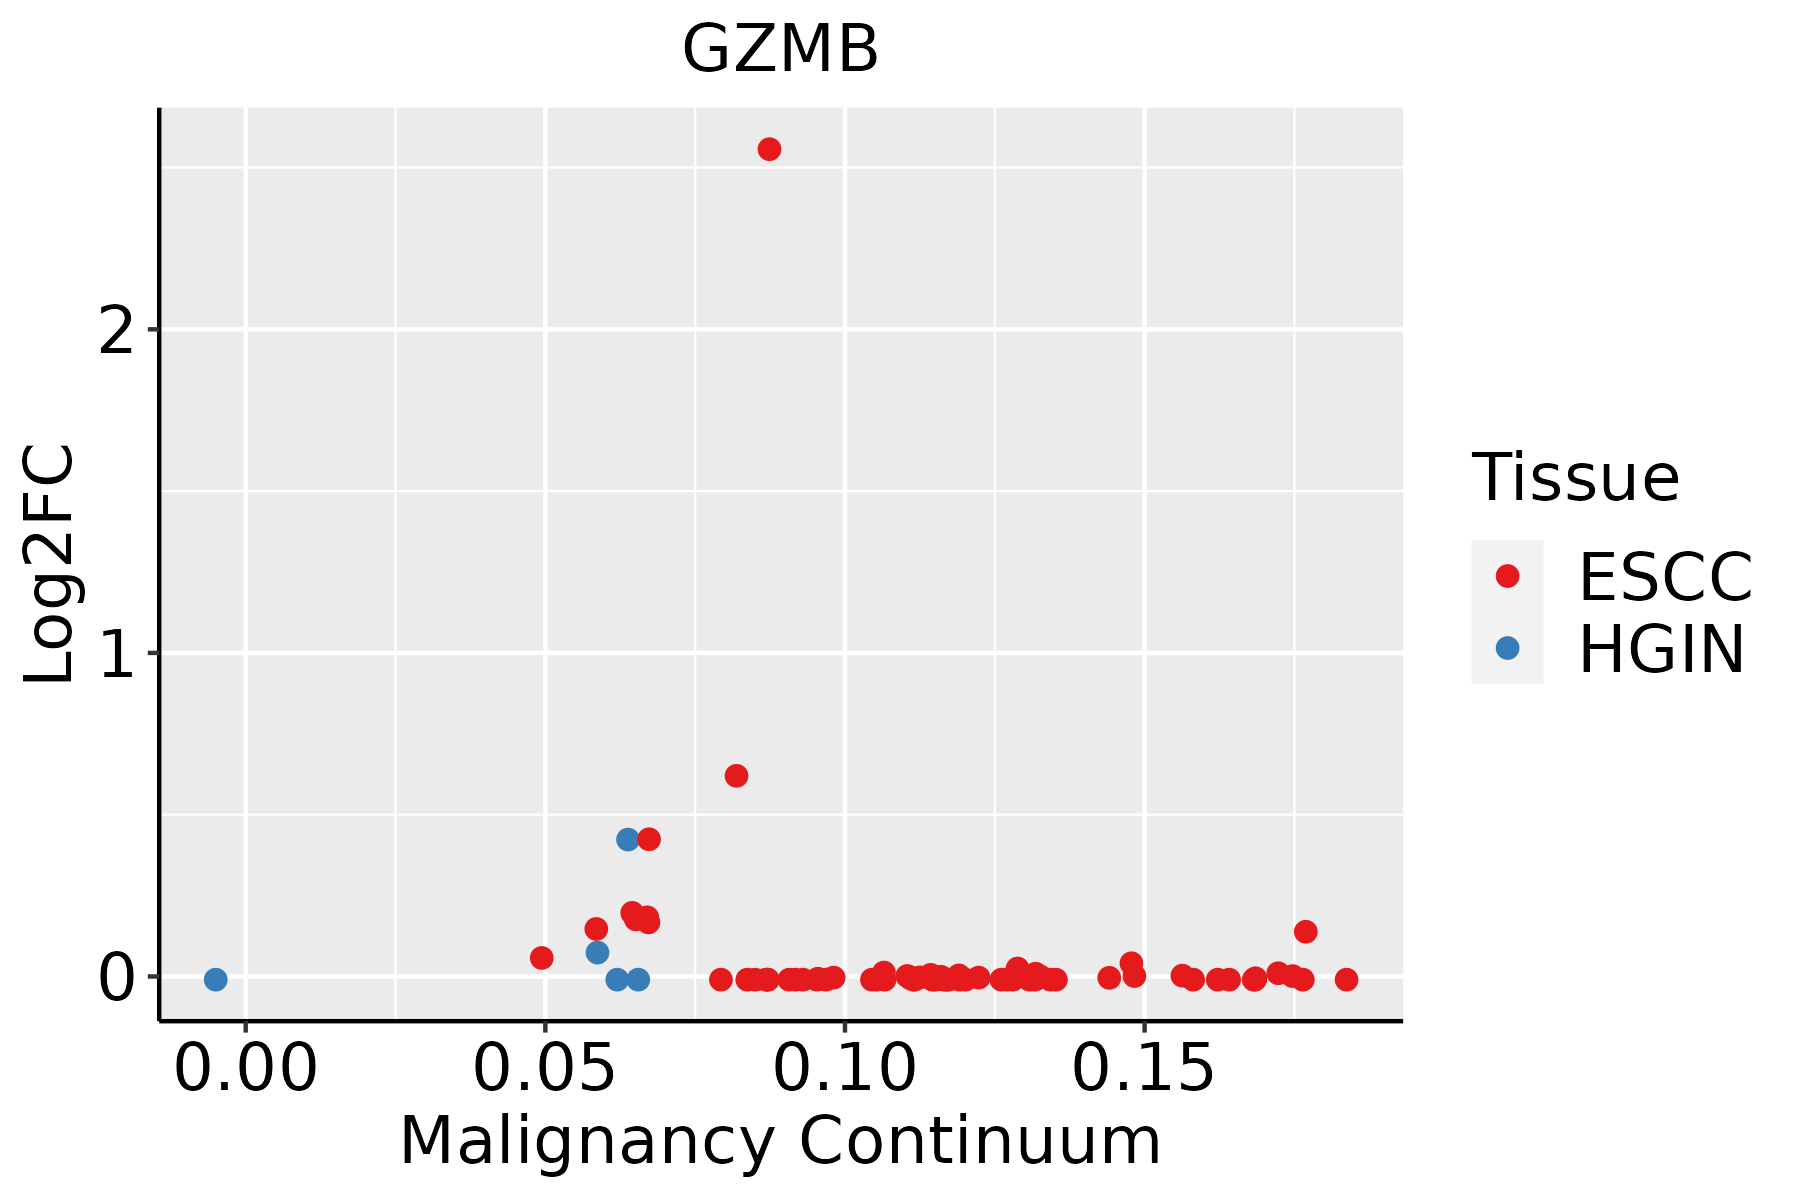 | ESCC: Esophageal squamous cell carcinoma |
| HGIN: High-grade intraepithelial neoplasias | ||
| LGIN: Low-grade intraepithelial neoplasias | ||
| Oral Cavity | 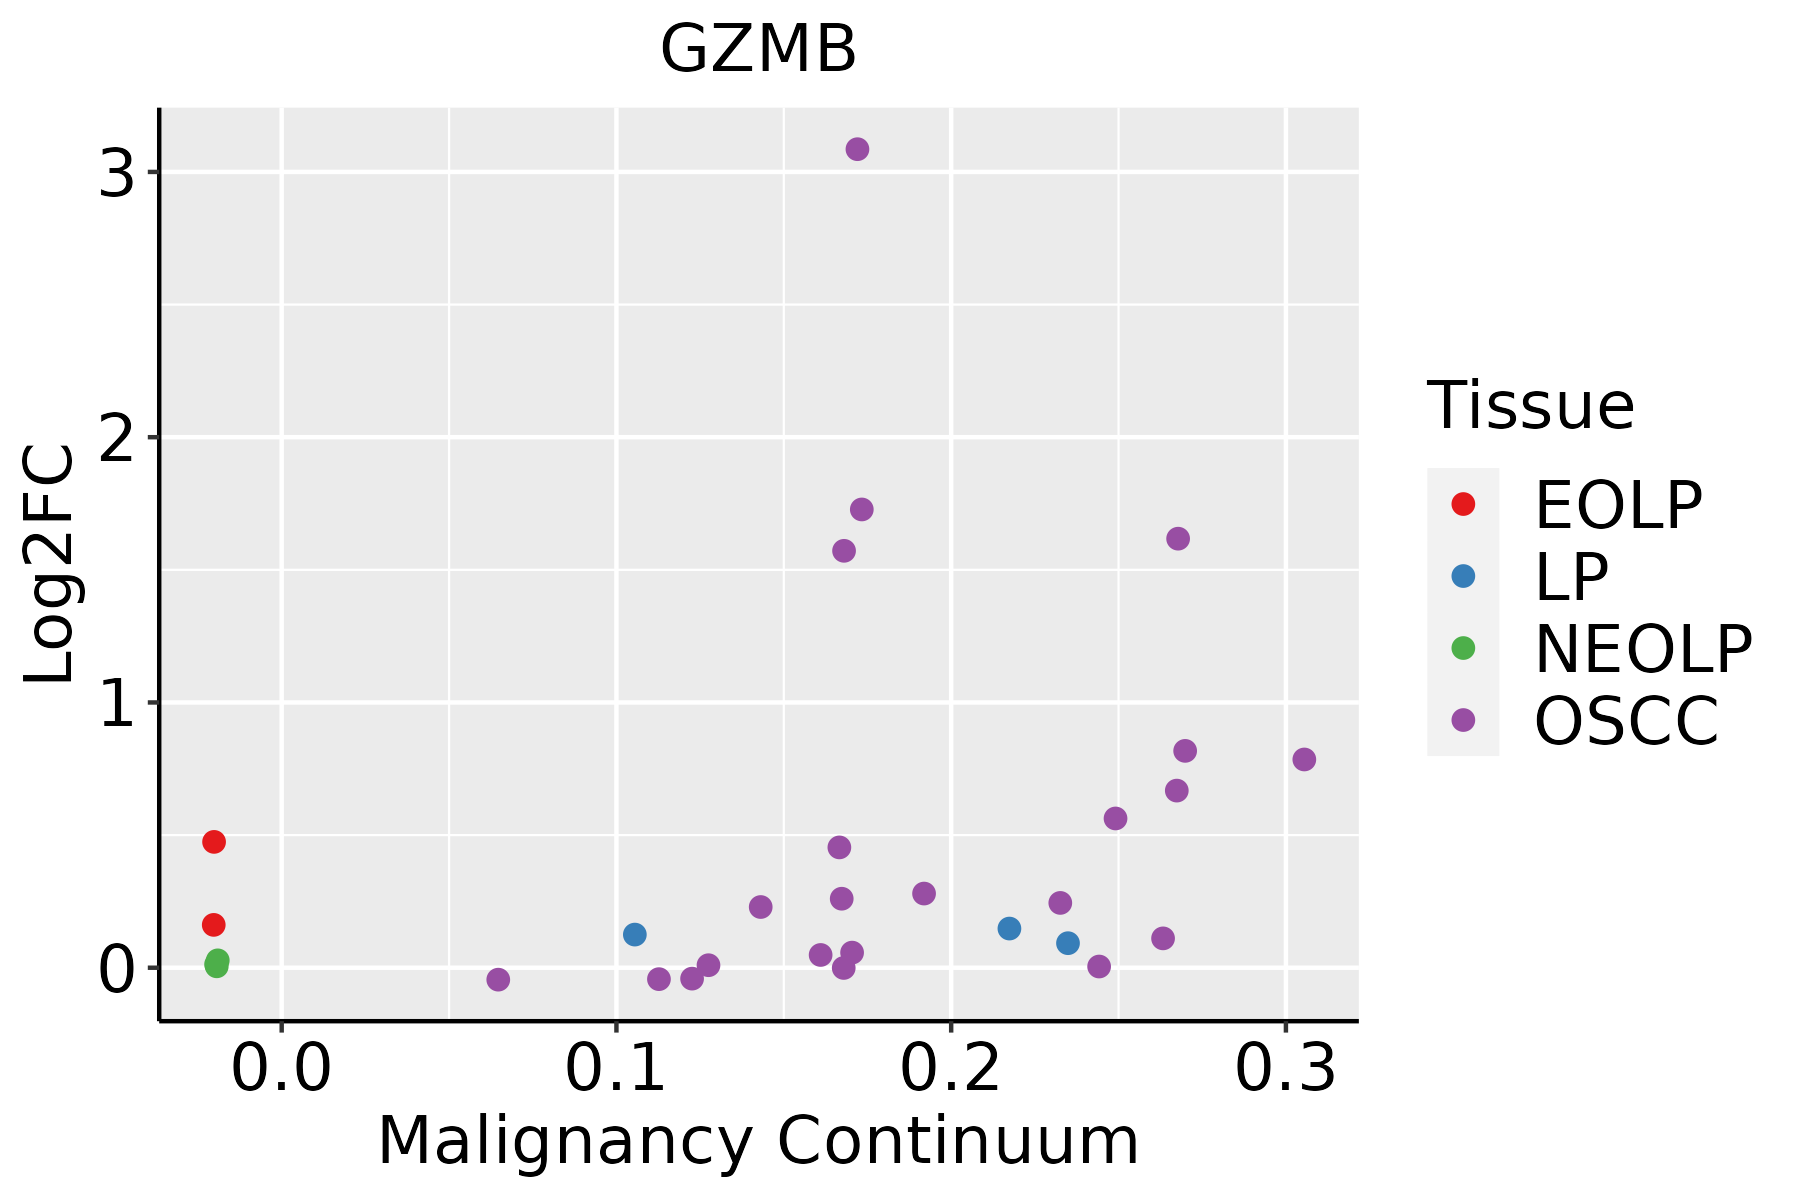 | EOLP: Erosive Oral lichen planus |
| LP: leukoplakia | ||
| NEOLP: Non-erosive oral lichen planus | ||
| OSCC: Oral squamous cell carcinoma |
| ∗log2FC in expression of this searched gene in stem-like cells from each diseased tissue sample relative to stem-like cells in normal samples in each tissue plotted against the malignancy continuum. Samples are colored based on if they are from different disease stage. |
Top |
Malignant transformation related pathway analysis |
| Find out the enriched GO biological processes and KEGG pathways involved in transition from healthy to precancer to cancer |
| Tissue | Disease Stage | Enriched GO biological Processes |
| Colorectum | AD |  |
| Colorectum | SER |  |
| Colorectum | MSS |  |
| Colorectum | MSI-H |  |
| Colorectum | FAP |  |
| ∗Top 15 enriched GO BP terms are showed in the bar plot of each disease state in each tissue. Each row represents a significant GO biological process which is colored according to the -log10(p.adjust). |
| Page: 1 2 3 4 5 6 7 8 9 |
| GO ID | Tissue | Disease Stage | Description | Gene Ratio | Bg Ratio | pvalue | p.adjust | Count |
| GO:0072594110 | Esophagus | ESCC | establishment of protein localization to organelle | 311/8552 | 422/18723 | 3.02e-32 | 2.13e-29 | 311 |
| GO:003238618 | Esophagus | ESCC | regulation of intracellular transport | 243/8552 | 337/18723 | 3.20e-23 | 7.25e-21 | 243 |
| GO:0006839110 | Esophagus | ESCC | mitochondrial transport | 187/8552 | 254/18723 | 8.35e-20 | 9.81e-18 | 187 |
| GO:1903829111 | Esophagus | ESCC | positive regulation of cellular protein localization | 199/8552 | 276/18723 | 2.99e-19 | 3.45e-17 | 199 |
| GO:0033157110 | Esophagus | ESCC | regulation of intracellular protein transport | 169/8552 | 229/18723 | 3.31e-18 | 3.23e-16 | 169 |
| GO:0032388110 | Esophagus | ESCC | positive regulation of intracellular transport | 152/8552 | 202/18723 | 7.89e-18 | 7.36e-16 | 152 |
| GO:0006417111 | Esophagus | ESCC | regulation of translation | 304/8552 | 468/18723 | 1.53e-17 | 1.33e-15 | 304 |
| GO:1904951111 | Esophagus | ESCC | positive regulation of establishment of protein localization | 216/8552 | 319/18723 | 1.01e-15 | 6.86e-14 | 216 |
| GO:0090150110 | Esophagus | ESCC | establishment of protein localization to membrane | 182/8552 | 260/18723 | 1.27e-15 | 8.19e-14 | 182 |
| GO:0072655110 | Esophagus | ESCC | establishment of protein localization to mitochondrion | 97/8552 | 120/18723 | 2.17e-15 | 1.33e-13 | 97 |
| GO:009031617 | Esophagus | ESCC | positive regulation of intracellular protein transport | 122/8552 | 160/18723 | 2.45e-15 | 1.49e-13 | 122 |
| GO:0070585110 | Esophagus | ESCC | protein localization to mitochondrion | 100/8552 | 125/18723 | 2.96e-15 | 1.77e-13 | 100 |
| GO:0051222111 | Esophagus | ESCC | positive regulation of protein transport | 204/8552 | 303/18723 | 1.56e-14 | 8.38e-13 | 204 |
| GO:000700619 | Esophagus | ESCC | mitochondrial membrane organization | 93/8552 | 116/18723 | 2.16e-14 | 1.11e-12 | 93 |
| GO:0010821110 | Esophagus | ESCC | regulation of mitochondrion organization | 107/8552 | 144/18723 | 2.31e-12 | 9.41e-11 | 107 |
| GO:0008637110 | Esophagus | ESCC | apoptotic mitochondrial changes | 83/8552 | 107/18723 | 1.43e-11 | 5.08e-10 | 83 |
| GO:001082215 | Esophagus | ESCC | positive regulation of mitochondrion organization | 58/8552 | 74/18723 | 8.55e-09 | 1.73e-07 | 58 |
| GO:190547519 | Esophagus | ESCC | regulation of protein localization to membrane | 117/8552 | 175/18723 | 1.14e-08 | 2.26e-07 | 117 |
| GO:005120515 | Esophagus | ESCC | protein insertion into membrane | 46/8552 | 57/18723 | 5.90e-08 | 1.04e-06 | 46 |
| GO:004690217 | Esophagus | ESCC | regulation of mitochondrial membrane permeability | 49/8552 | 63/18723 | 1.91e-07 | 2.97e-06 | 49 |
| Page: 1 2 3 4 5 |
| Pathway ID | Tissue | Disease Stage | Description | Gene Ratio | Bg Ratio | pvalue | p.adjust | qvalue | Count |
| hsa0421027 | Esophagus | ESCC | Apoptosis | 102/4205 | 136/8465 | 1.05e-09 | 1.21e-08 | 6.21e-09 | 102 |
| hsa052028 | Esophagus | ESCC | Transcriptional misregulation in cancer | 116/4205 | 193/8465 | 2.08e-03 | 5.95e-03 | 3.05e-03 | 116 |
| hsa0421037 | Esophagus | ESCC | Apoptosis | 102/4205 | 136/8465 | 1.05e-09 | 1.21e-08 | 6.21e-09 | 102 |
| hsa0520213 | Esophagus | ESCC | Transcriptional misregulation in cancer | 116/4205 | 193/8465 | 2.08e-03 | 5.95e-03 | 3.05e-03 | 116 |
| hsa0421018 | Oral cavity | OSCC | Apoptosis | 101/3704 | 136/8465 | 3.34e-13 | 7.00e-12 | 3.56e-12 | 101 |
| hsa0421019 | Oral cavity | OSCC | Apoptosis | 101/3704 | 136/8465 | 3.34e-13 | 7.00e-12 | 3.56e-12 | 101 |
| hsa0421043 | Oral cavity | EOLP | Apoptosis | 40/1218 | 136/8465 | 4.20e-06 | 2.91e-05 | 1.72e-05 | 40 |
| hsa04650 | Oral cavity | EOLP | Natural killer cell mediated cytotoxicity | 38/1218 | 132/8465 | 1.26e-05 | 7.01e-05 | 4.13e-05 | 38 |
| hsa0421053 | Oral cavity | EOLP | Apoptosis | 40/1218 | 136/8465 | 4.20e-06 | 2.91e-05 | 1.72e-05 | 40 |
| hsa046501 | Oral cavity | EOLP | Natural killer cell mediated cytotoxicity | 38/1218 | 132/8465 | 1.26e-05 | 7.01e-05 | 4.13e-05 | 38 |
| Page: 1 |
Top |
Cell-cell communication analysis |
| Identification of potential cell-cell interactions between two cell types and their ligand-receptor pairs for different disease states |
| Ligand | Receptor | LRpair | Pathway | Tissue | Disease Stage |
| Page: 1 |
Top |
Single-cell gene regulatory network inference analysis |
| Find out the significant the regulons (TFs) and the target genes of each regulon across cell types for different disease states |
| TF | Cell Type | Tissue | Disease Stage | Target Gene | RSS | Regulon Activity |
| ∗The dot plots of a searched regulon are shown for all cell subpopulations in each disease state of each tissue based on the regulon specific score inferred using pySCENIC and by calculating the average expression. |
| Page: 1 |
Top |
Somatic mutation of malignant transformation related genes |
| Annotation of somatic variants for genes involved in malignant transformation |
| Hugo Symbol | Variant Class | Variant Classification | dbSNP RS | HGVSc | HGVSp | HGVSp Short | SWISSPROT | BIOTYPE | SIFT | PolyPhen | Tumor Sample Barcode | Tissue | Histology | Sex | Age | Stage | Therapy Types | Drugs | Outcome |
| GZMB | insertion | Nonsense_Mutation | novel | c.181_182insTTCCAATTCCTGGGGACCGACTGTCCCCTTAATTTCCCCT | p.Thr61IlefsTer11 | p.T61Ifs*11 | P10144 | protein_coding | TCGA-A8-A09B-01 | Breast | breast invasive carcinoma | Female | <65 | III/IV | Chemotherapy | 5-fluorouracil | SD | ||
| GZMB | SNV | Missense_Mutation | c.577G>A | p.Glu193Lys | p.E193K | P10144 | protein_coding | tolerated(1) | benign(0) | TCGA-EK-A2RK-01 | Cervix | cervical & endocervical cancer | Female | >=65 | I/II | Unknown | Unknown | SD | |
| GZMB | SNV | Missense_Mutation | rs142224147 | c.358C>T | p.Arg120Trp | p.R120W | P10144 | protein_coding | deleterious(0.04) | benign(0.077) | TCGA-AA-3663-01 | Colorectum | colon adenocarcinoma | Male | <65 | I/II | Unknown | Unknown | SD |
| GZMB | SNV | Missense_Mutation | rs757031846 | c.436G>A | p.Gly146Ser | p.G146S | P10144 | protein_coding | deleterious(0.02) | probably_damaging(0.998) | TCGA-G4-6309-01 | Colorectum | colon adenocarcinoma | Female | <65 | III/IV | Chemotherapy | xeloda | PD |
| GZMB | SNV | Missense_Mutation | c.736C>A | p.Arg246Ser | p.R246S | P10144 | protein_coding | tolerated(0.11) | benign(0.01) | TCGA-G4-6626-01 | Colorectum | colon adenocarcinoma | Male | >=65 | I/II | Unknown | Unknown | SD | |
| GZMB | SNV | Missense_Mutation | novel | c.683N>C | p.Arg228Pro | p.R228P | P10144 | protein_coding | tolerated(0.26) | possibly_damaging(0.481) | TCGA-AJ-A2QK-01 | Endometrium | uterine corpus endometrioid carcinoma | Female | >=65 | I/II | Chemotherapy | carboplatin | SD |
| GZMB | SNV | Missense_Mutation | c.520N>A | p.Glu174Lys | p.E174K | P10144 | protein_coding | tolerated(0.52) | benign(0) | TCGA-AJ-A5DW-01 | Endometrium | uterine corpus endometrioid carcinoma | Female | <65 | I/II | Unknown | Unknown | SD | |
| GZMB | SNV | Missense_Mutation | c.11N>C | p.Ile4Thr | p.I4T | P10144 | protein_coding | deleterious(0.05) | benign(0.108) | TCGA-AP-A0LM-01 | Endometrium | uterine corpus endometrioid carcinoma | Female | <65 | III/IV | Chemotherapy | cisplatin | SD | |
| GZMB | SNV | Missense_Mutation | novel | c.451N>A | p.Ala151Thr | p.A151T | P10144 | protein_coding | tolerated(0.43) | benign(0.001) | TCGA-AP-A1DV-01 | Endometrium | uterine corpus endometrioid carcinoma | Female | <65 | I/II | Unknown | Unknown | SD |
| GZMB | SNV | Missense_Mutation | c.551N>G | p.Thr184Ser | p.T184S | P10144 | protein_coding | tolerated(0.24) | benign(0.003) | TCGA-AX-A05Z-01 | Endometrium | uterine corpus endometrioid carcinoma | Female | <65 | III/IV | Chemotherapy | adriamycin | SD |
| Page: 1 2 3 |
Top |
Related drugs of malignant transformation related genes |
| Identification of chemicals and drugs interact with genes involved in malignant transfromation |
| (DGIdb 4.0) |
| Entrez ID | Symbol | Category | Interaction Types | Drug Claim Name | Drug Name | PMIDs |
| 3002 | GZMB | PROTEASE, DRUGGABLE GENOME, ENZYME | HEXACHLOROPHENE | HEXACHLOROPHENE | 19633659 | |
| 3002 | GZMB | PROTEASE, DRUGGABLE GENOME, ENZYME | inhibitor | 252166850 |
| Page: 1 |

Copyright 2023-Present -The University of Texas Health Science Center at Houston |