
|
|||||
|
 | |
| |
| |
| |
| |
| |
|
Gene: GZMA |
Gene summary for GZMA |
| Gene information | Species | Human | Gene symbol | GZMA | Gene ID | 3001 |
| Gene name | granzyme A | |
| Gene Alias | CTLA3 | |
| Cytomap | 5q11.2 | |
| Gene Type | protein-coding | GO ID | GO:0002376 | UniProtAcc | P12544 |
Top |
Malignant transformation analysis |
| Identification of the aberrant gene expression in precancerous and cancerous lesions by comparing the gene expression of stem-like cells in diseased tissues with normal stem cells |
| Entrez ID | Symbol | Replicates | Species | Organ | Tissue | Adj P-value | Log2FC | Malignancy |
| 3001 | GZMA | LZE4T | Human | Esophagus | ESCC | 2.45e-09 | 6.11e-01 | 0.0811 |
| 3001 | GZMA | LZE7T | Human | Esophagus | ESCC | 2.56e-05 | 6.55e-01 | 0.0667 |
| 3001 | GZMA | LZE8T | Human | Esophagus | ESCC | 1.65e-04 | 6.86e-01 | 0.067 |
| 3001 | GZMA | LZE6T | Human | Esophagus | ESCC | 4.33e-26 | 2.25e+00 | 0.0845 |
| 3001 | GZMA | C21 | Human | Oral cavity | OSCC | 1.56e-26 | 1.18e+00 | 0.2678 |
| 3001 | GZMA | C30 | Human | Oral cavity | OSCC | 1.35e-05 | 2.80e-01 | 0.3055 |
| 3001 | GZMA | C38 | Human | Oral cavity | OSCC | 1.12e-12 | 1.95e+00 | 0.172 |
| 3001 | GZMA | C46 | Human | Oral cavity | OSCC | 1.15e-07 | 2.44e-01 | 0.1673 |
| 3001 | GZMA | C51 | Human | Oral cavity | OSCC | 1.10e-05 | 2.96e-01 | 0.2674 |
| 3001 | GZMA | C07 | Human | Oral cavity | OSCC | 5.76e-03 | 5.66e-01 | 0.2491 |
| 3001 | GZMA | C08 | Human | Oral cavity | OSCC | 3.30e-02 | 8.58e-02 | 0.1919 |
| 3001 | GZMA | LN22 | Human | Oral cavity | OSCC | 1.65e-02 | 1.40e+00 | 0.1733 |
| 3001 | GZMA | LN46 | Human | Oral cavity | OSCC | 2.77e-02 | 8.51e-02 | 0.1666 |
| Page: 1 |
| Tissue | Expression Dynamics | Abbreviation |
| Esophagus | 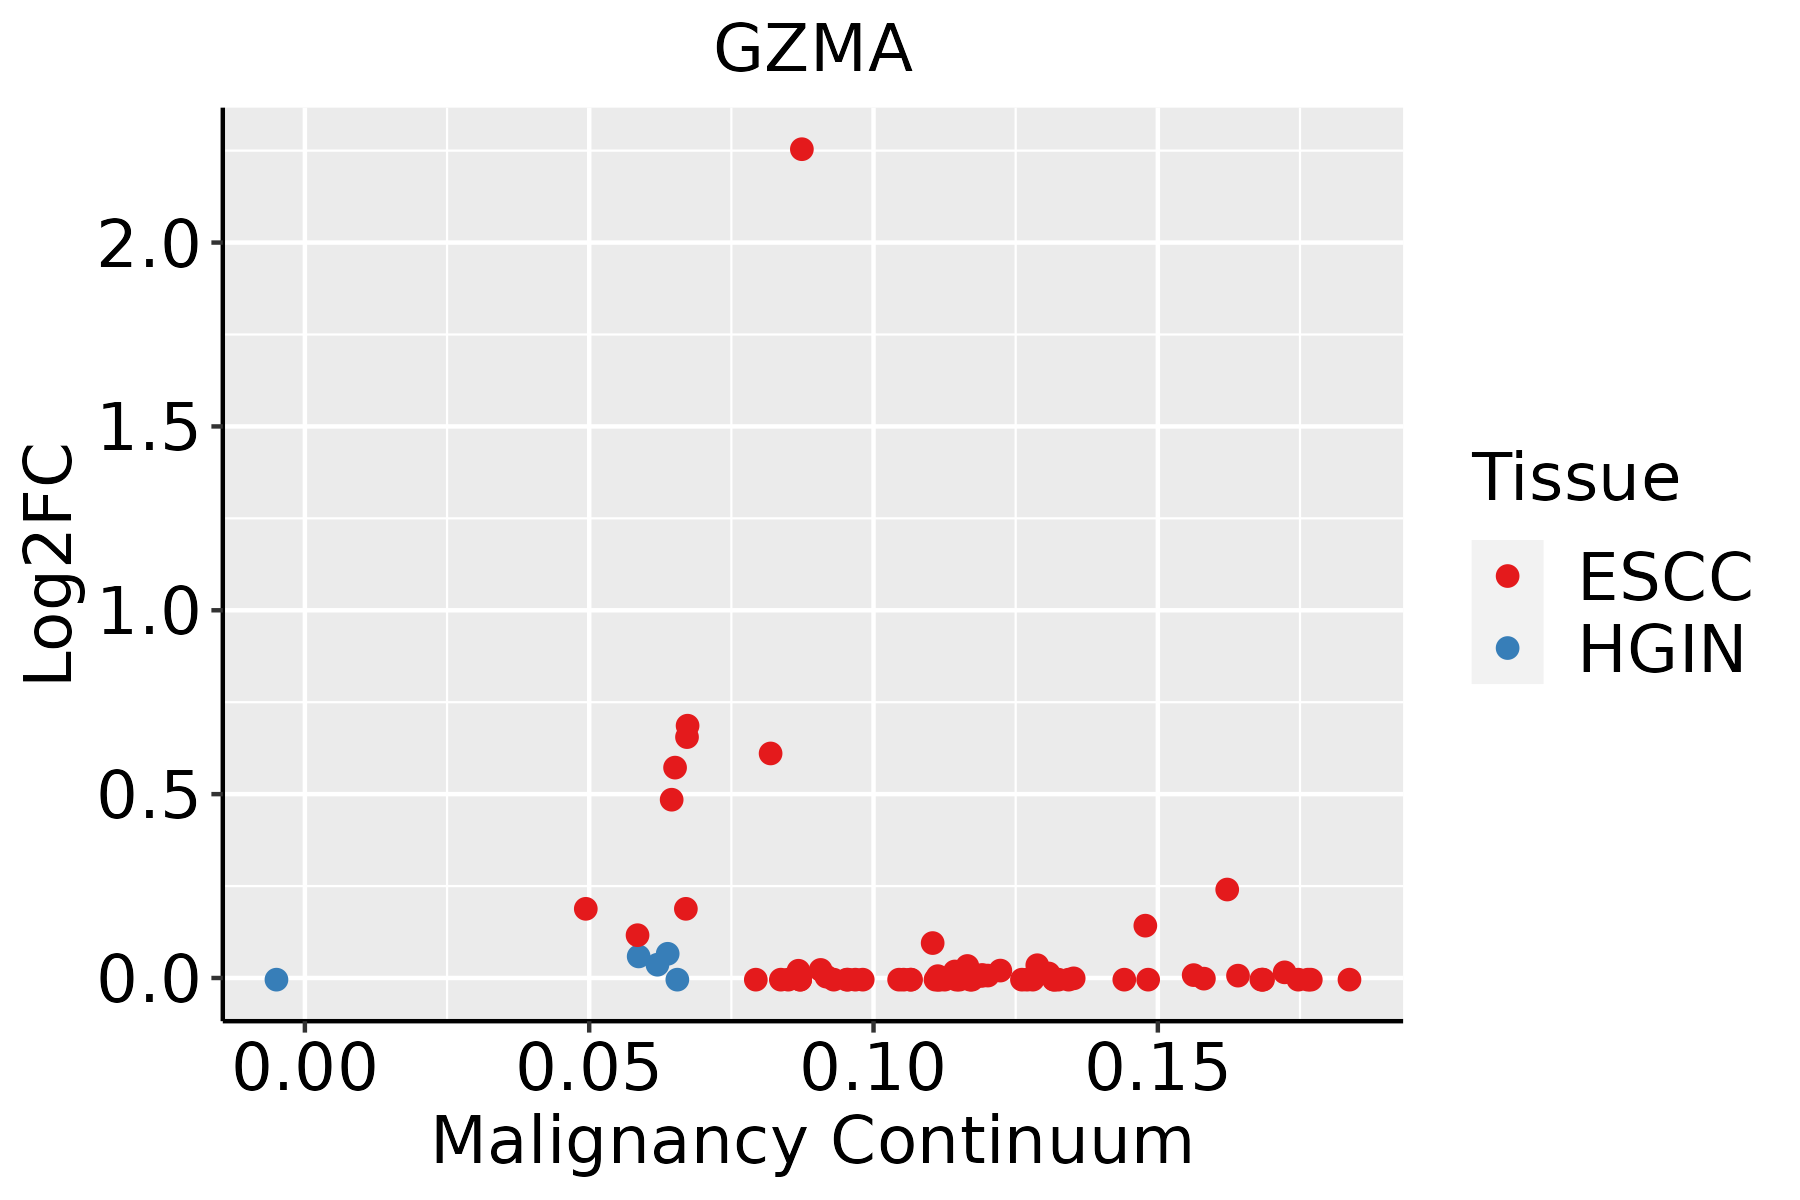 | ESCC: Esophageal squamous cell carcinoma |
| HGIN: High-grade intraepithelial neoplasias | ||
| LGIN: Low-grade intraepithelial neoplasias | ||
| Oral Cavity | 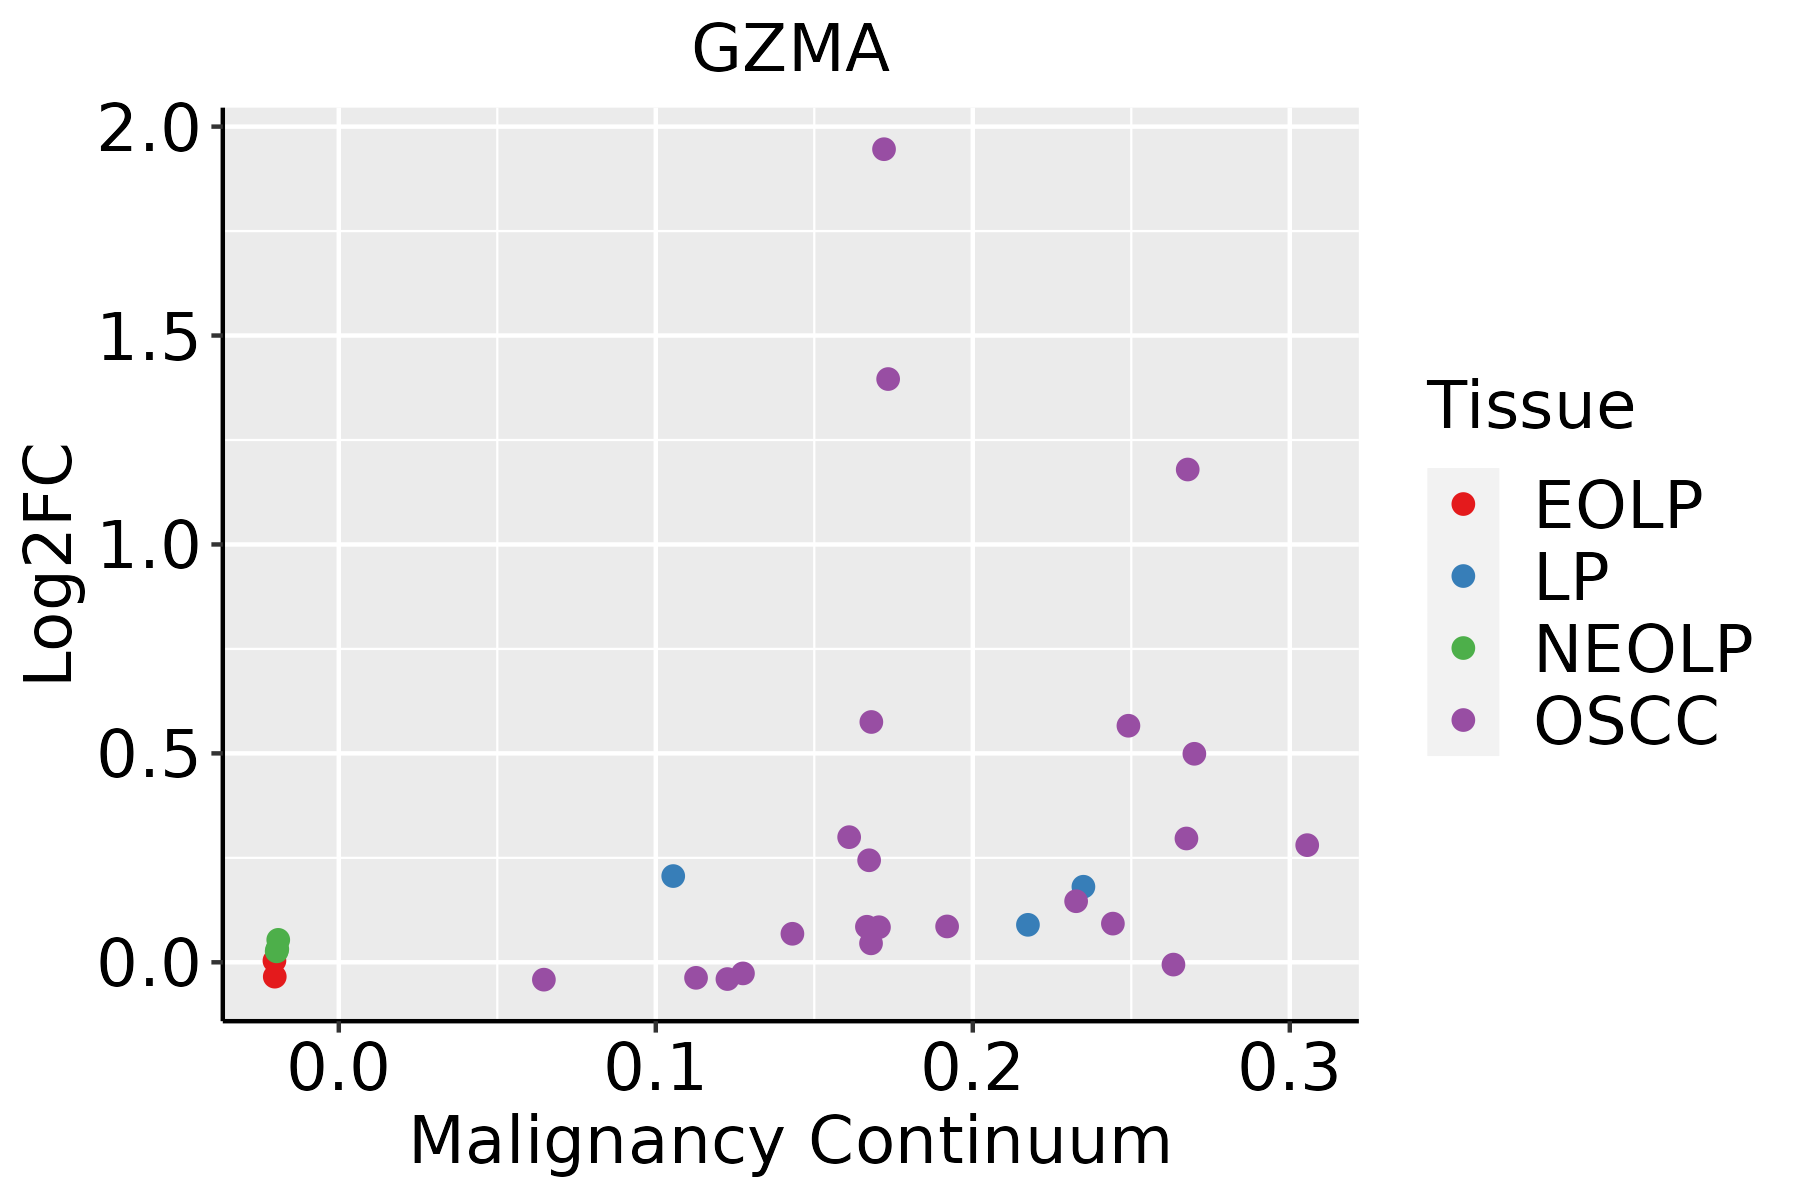 | EOLP: Erosive Oral lichen planus |
| LP: leukoplakia | ||
| NEOLP: Non-erosive oral lichen planus | ||
| OSCC: Oral squamous cell carcinoma |
| ∗log2FC in expression of this searched gene in stem-like cells from each diseased tissue sample relative to stem-like cells in normal samples in each tissue plotted against the malignancy continuum. Samples are colored based on if they are from different disease stage. |
Top |
Malignant transformation related pathway analysis |
| Find out the enriched GO biological processes and KEGG pathways involved in transition from healthy to precancer to cancer |
| Tissue | Disease Stage | Enriched GO biological Processes |
| Colorectum | AD |  |
| Colorectum | SER |  |
| Colorectum | MSS |  |
| Colorectum | MSI-H |  |
| Colorectum | FAP |  |
| ∗Top 15 enriched GO BP terms are showed in the bar plot of each disease state in each tissue. Each row represents a significant GO biological process which is colored according to the -log10(p.adjust). |
| Page: 1 2 3 4 5 6 7 8 9 |
| GO ID | Tissue | Disease Stage | Description | Gene Ratio | Bg Ratio | pvalue | p.adjust | Count |
| GO:0051098111 | Esophagus | ESCC | regulation of binding | 251/8552 | 363/18723 | 6.73e-20 | 8.46e-18 | 251 |
| GO:005105215 | Esophagus | ESCC | regulation of DNA metabolic process | 232/8552 | 359/18723 | 2.40e-13 | 1.13e-11 | 232 |
| GO:0051101111 | Esophagus | ESCC | regulation of DNA binding | 84/8552 | 118/18723 | 1.64e-08 | 3.21e-07 | 84 |
| GO:0051100111 | Esophagus | ESCC | negative regulation of binding | 109/8552 | 162/18723 | 2.10e-08 | 4.03e-07 | 109 |
| GO:00320698 | Esophagus | ESCC | regulation of nuclease activity | 19/8552 | 22/18723 | 9.52e-05 | 6.78e-04 | 19 |
| GO:00433924 | Esophagus | ESCC | negative regulation of DNA binding | 37/8552 | 52/18723 | 1.75e-04 | 1.14e-03 | 37 |
| GO:0051346110 | Esophagus | ESCC | negative regulation of hydrolase activity | 208/8552 | 379/18723 | 1.76e-04 | 1.14e-03 | 208 |
| GO:00320707 | Esophagus | ESCC | regulation of deoxyribonuclease activity | 9/8552 | 10/18723 | 5.09e-03 | 1.92e-02 | 9 |
| GO:005109820 | Oral cavity | OSCC | regulation of binding | 212/7305 | 363/18723 | 3.88e-14 | 2.15e-12 | 212 |
| GO:005105210 | Oral cavity | OSCC | regulation of DNA metabolic process | 207/7305 | 359/18723 | 4.45e-13 | 2.17e-11 | 207 |
| GO:00320697 | Oral cavity | OSCC | regulation of nuclease activity | 20/7305 | 22/18723 | 6.02e-07 | 8.64e-06 | 20 |
| GO:00320706 | Oral cavity | OSCC | regulation of deoxyribonuclease activity | 10/7305 | 10/18723 | 8.14e-05 | 6.26e-04 | 10 |
| GO:005110019 | Oral cavity | OSCC | negative regulation of binding | 87/7305 | 162/18723 | 1.00e-04 | 7.54e-04 | 87 |
| GO:005134618 | Oral cavity | OSCC | negative regulation of hydrolase activity | 182/7305 | 379/18723 | 1.98e-04 | 1.32e-03 | 182 |
| GO:005110120 | Oral cavity | OSCC | regulation of DNA binding | 64/7305 | 118/18723 | 5.53e-04 | 3.21e-03 | 64 |
| Page: 1 |
| Pathway ID | Tissue | Disease Stage | Description | Gene Ratio | Bg Ratio | pvalue | p.adjust | qvalue | Count |
| Page: 1 |
Top |
Cell-cell communication analysis |
| Identification of potential cell-cell interactions between two cell types and their ligand-receptor pairs for different disease states |
| Ligand | Receptor | LRpair | Pathway | Tissue | Disease Stage |
| GZMA | F2R | GZMA_F2R | PARs | Breast | ADJ |
| GZMA | F2RL2 | GZMA_F2RL2 | PARs | Breast | ADJ |
| GZMA | PARD3 | GZMA_PARD3 | PARs | Breast | ADJ |
| GZMA | F2R | GZMA_F2R | PARs | Breast | DCIS |
| GZMA | F2RL3 | GZMA_F2RL3 | PARs | Breast | Healthy |
| GZMA | F2R | GZMA_F2R | PARs | Breast | IDC |
| GZMA | F2R | GZMA_F2R | PARs | Cervix | ADJ |
| GZMA | F2R | GZMA_F2R | PARs | Cervix | CC |
| GZMA | PARD3 | GZMA_PARD3 | PARs | Cervix | CC |
| GZMA | F2R | GZMA_F2R | PARs | Cervix | Healthy |
| GZMA | F2R | GZMA_F2R | PARs | Cervix | Precancer |
| GZMA | F2R | GZMA_F2R | PARs | CRC | AD |
| GZMA | F2RL3 | GZMA_F2RL3 | PARs | CRC | AD |
| GZMA | PARD3 | GZMA_PARD3 | PARs | CRC | AD |
| GZMA | PARD3 | GZMA_PARD3 | PARs | CRC | ADJ |
| GZMA | F2R | GZMA_F2R | PARs | CRC | MSI-H |
| GZMA | PARD3 | GZMA_PARD3 | PARs | CRC | MSI-H |
| GZMA | PARD3 | GZMA_PARD3 | PARs | CRC | MSS |
| GZMA | F2R | GZMA_F2R | PARs | CRC | SER |
| GZMA | PARD3 | GZMA_PARD3 | PARs | CRC | SER |
| Page: 1 2 3 4 5 |
Top |
Single-cell gene regulatory network inference analysis |
| Find out the significant the regulons (TFs) and the target genes of each regulon across cell types for different disease states |
| TF | Cell Type | Tissue | Disease Stage | Target Gene | RSS | Regulon Activity |
| ∗The dot plots of a searched regulon are shown for all cell subpopulations in each disease state of each tissue based on the regulon specific score inferred using pySCENIC and by calculating the average expression. |
| Page: 1 |
Top |
Somatic mutation of malignant transformation related genes |
| Annotation of somatic variants for genes involved in malignant transformation |
| Hugo Symbol | Variant Class | Variant Classification | dbSNP RS | HGVSc | HGVSp | HGVSp Short | SWISSPROT | BIOTYPE | SIFT | PolyPhen | Tumor Sample Barcode | Tissue | Histology | Sex | Age | Stage | Therapy Types | Drugs | Outcome |
| GZMA | SNV | Missense_Mutation | c.49N>C | p.Ser17Pro | p.S17P | P12544 | protein_coding | tolerated(0.21) | benign(0) | TCGA-AN-A0AR-01 | Breast | breast invasive carcinoma | Female | <65 | I/II | Unknown | Unknown | SD | |
| GZMA | SNV | Missense_Mutation | c.761N>C | p.Ile254Thr | p.I254T | P12544 | protein_coding | deleterious(0.01) | probably_damaging(1) | TCGA-AO-A0J5-01 | Breast | breast invasive carcinoma | Female | <65 | III/IV | Other, specify in notesBisphosphonate | zoledronic | PD | |
| GZMA | SNV | Missense_Mutation | rs372192022 | c.755N>G | p.Asn252Ser | p.N252S | P12544 | protein_coding | tolerated(0.7) | benign(0) | TCGA-EW-A1P6-01 | Breast | breast invasive carcinoma | Female | <65 | I/II | Chemotherapy | cyclophosphamide | SD |
| GZMA | SNV | Missense_Mutation | c.710C>T | p.Pro237Leu | p.P237L | P12544 | protein_coding | tolerated(0.11) | probably_damaging(0.929) | TCGA-2W-A8YY-01 | Cervix | cervical & endocervical cancer | Female | <65 | I/II | Chemotherapy | cisplatin | CR | |
| GZMA | SNV | Missense_Mutation | c.216G>T | p.Leu72Phe | p.L72F | P12544 | protein_coding | tolerated(0.3) | possibly_damaging(0.614) | TCGA-AA-3509-01 | Colorectum | colon adenocarcinoma | Female | <65 | I/II | Unknown | Unknown | SD | |
| GZMA | SNV | Missense_Mutation | c.256N>G | p.Thr86Ala | p.T86A | P12544 | protein_coding | tolerated(0.15) | benign(0.001) | TCGA-AA-3510-01 | Colorectum | colon adenocarcinoma | Male | >=65 | I/II | Unknown | Unknown | SD | |
| GZMA | SNV | Missense_Mutation | novel | c.357G>T | p.Gln119His | p.Q119H | P12544 | protein_coding | deleterious(0) | probably_damaging(0.99) | TCGA-AA-3950-01 | Colorectum | colon adenocarcinoma | Female | >=65 | I/II | Unknown | Unknown | SD |
| GZMA | SNV | Missense_Mutation | c.164N>A | p.Ala55Asp | p.A55D | P12544 | protein_coding | deleterious(0) | possibly_damaging(0.802) | TCGA-AA-A00N-01 | Colorectum | colon adenocarcinoma | Male | >=65 | I/II | Unknown | Unknown | PD | |
| GZMA | SNV | Missense_Mutation | novel | c.380N>G | p.Asn127Ser | p.N127S | P12544 | protein_coding | deleterious(0.05) | benign(0.088) | TCGA-AZ-4315-01 | Colorectum | colon adenocarcinoma | Male | <65 | I/II | Unknown | Unknown | SD |
| GZMA | SNV | Missense_Mutation | rs765136087 | c.226T>C | p.Ser76Pro | p.S76P | P12544 | protein_coding | tolerated(0.42) | benign(0.005) | TCGA-D5-6922-01 | Colorectum | colon adenocarcinoma | Male | >=65 | III/IV | Unknown | Unknown | SD |
| Page: 1 2 3 4 5 6 |
Top |
Related drugs of malignant transformation related genes |
| Identification of chemicals and drugs interact with genes involved in malignant transfromation |
| (DGIdb 4.0) |
| Entrez ID | Symbol | Category | Interaction Types | Drug Claim Name | Drug Name | PMIDs |
| 3001 | GZMA | PROTEASE, DRUGGABLE GENOME, ENZYME | CYCLOSPORINE | CYCLOSPORINE | 8420038 | |
| 3001 | GZMA | PROTEASE, DRUGGABLE GENOME, ENZYME | CC CHEMOKINES | 8598480 | ||
| 3001 | GZMA | PROTEASE, DRUGGABLE GENOME, ENZYME | ANTIVIRAL | 12820184 |
| Page: 1 |

Copyright 2023-Present -The University of Texas Health Science Center at Houston |