
|
|||||
|
 | |
| |
| |
| |
| |
| |
|
Gene: GYPC |
Gene summary for GYPC |
| Gene information | Species | Human | Gene symbol | GYPC | Gene ID | 2995 |
| Gene name | glycophorin C (Gerbich blood group) | |
| Gene Alias | CD236 | |
| Cytomap | 2q14.3 | |
| Gene Type | protein-coding | GO ID | GO:0005575 | UniProtAcc | P04921 |
Top |
Malignant transformation analysis |
| Identification of the aberrant gene expression in precancerous and cancerous lesions by comparing the gene expression of stem-like cells in diseased tissues with normal stem cells |
| Entrez ID | Symbol | Replicates | Species | Organ | Tissue | Adj P-value | Log2FC | Malignancy |
| 2995 | GYPC | AEH-subject1 | Human | Endometrium | AEH | 2.24e-30 | -5.43e-01 | -0.3059 |
| 2995 | GYPC | AEH-subject2 | Human | Endometrium | AEH | 1.61e-22 | -5.13e-01 | -0.2525 |
| 2995 | GYPC | AEH-subject3 | Human | Endometrium | AEH | 4.92e-24 | -5.10e-01 | -0.2576 |
| 2995 | GYPC | AEH-subject4 | Human | Endometrium | AEH | 9.82e-08 | -3.89e-01 | -0.2657 |
| 2995 | GYPC | AEH-subject5 | Human | Endometrium | AEH | 6.40e-26 | -5.43e-01 | -0.2953 |
| 2995 | GYPC | EEC-subject1 | Human | Endometrium | EEC | 1.13e-30 | -5.64e-01 | -0.2682 |
| 2995 | GYPC | EEC-subject2 | Human | Endometrium | EEC | 6.34e-36 | -5.74e-01 | -0.2607 |
| 2995 | GYPC | EEC-subject3 | Human | Endometrium | EEC | 2.23e-33 | -5.29e-01 | -0.2525 |
| 2995 | GYPC | EEC-subject4 | Human | Endometrium | EEC | 1.43e-11 | -4.22e-01 | -0.2571 |
| 2995 | GYPC | EEC-subject5 | Human | Endometrium | EEC | 2.13e-21 | -4.74e-01 | -0.249 |
| 2995 | GYPC | GSM5276935 | Human | Endometrium | EEC | 5.42e-32 | -5.65e-01 | -0.123 |
| 2995 | GYPC | GSM6177620_NYU_UCEC1_lib1_lib1 | Human | Endometrium | EEC | 1.92e-27 | -5.84e-01 | -0.1869 |
| 2995 | GYPC | GSM6177620_NYU_UCEC1_lib2_lib2 | Human | Endometrium | EEC | 1.71e-24 | -5.84e-01 | -0.1875 |
| 2995 | GYPC | GSM6177620_NYU_UCEC1_lib3_lib3 | Human | Endometrium | EEC | 2.18e-28 | -5.84e-01 | -0.1883 |
| 2995 | GYPC | GSM6177621_NYU_UCEC2_lib1_lib1 | Human | Endometrium | EEC | 1.97e-37 | -5.49e-01 | -0.1934 |
| 2995 | GYPC | GSM6177622_NYU_UCEC3_lib1_lib1 | Human | Endometrium | EEC | 6.46e-36 | -5.68e-01 | -0.1917 |
| 2995 | GYPC | GSM6177622_NYU_UCEC3_lib2_lib2 | Human | Endometrium | EEC | 1.72e-36 | -5.84e-01 | -0.1916 |
| 2995 | GYPC | GSM6177623_NYU_UCEC3_Vis | Human | Endometrium | EEC | 2.66e-11 | -4.22e-01 | -0.1269 |
| 2995 | GYPC | LZE7T | Human | Esophagus | ESCC | 6.54e-03 | 3.99e-01 | 0.0667 |
| 2995 | GYPC | LZE6T | Human | Esophagus | ESCC | 3.83e-08 | 5.50e-01 | 0.0845 |
| Page: 1 2 3 |
| Tissue | Expression Dynamics | Abbreviation |
| Endometrium | 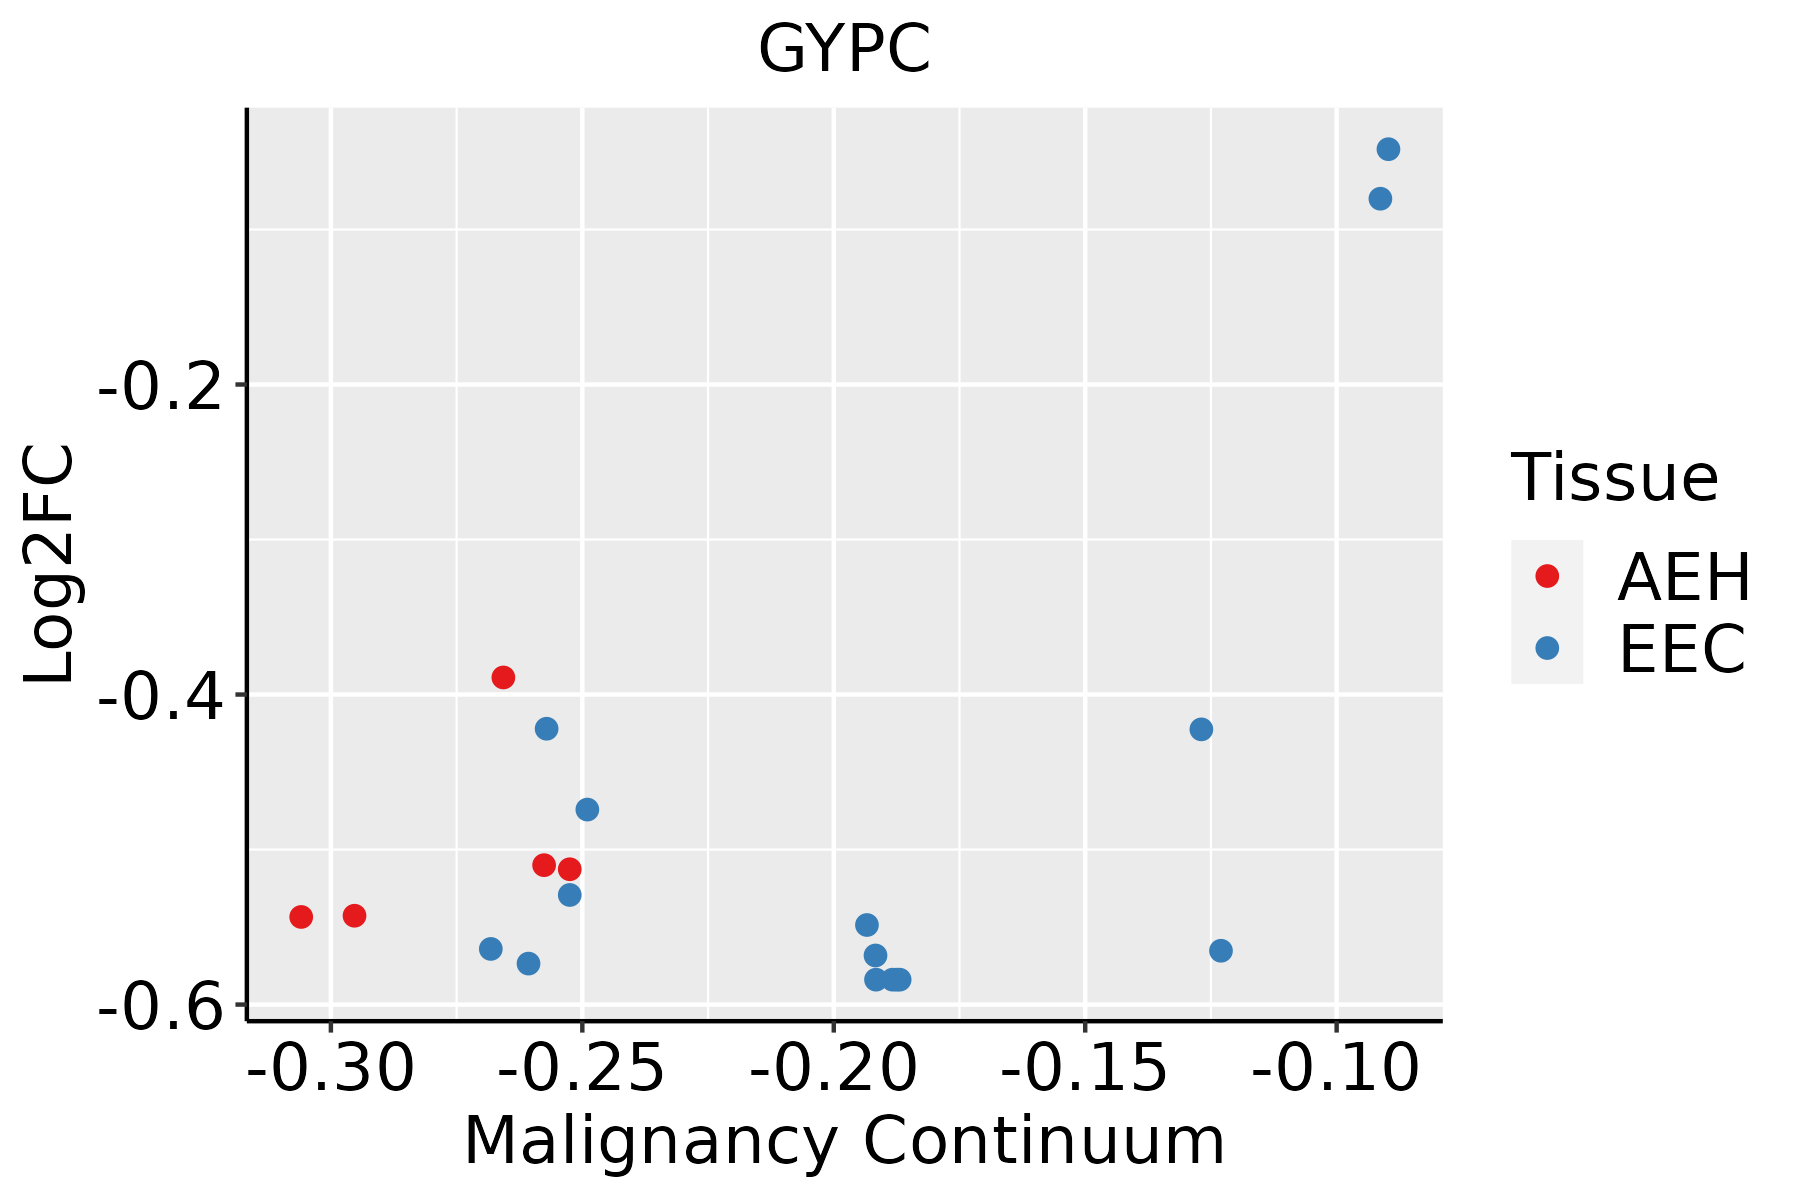 | AEH: Atypical endometrial hyperplasia |
| EEC: Endometrioid Cancer | ||
| Esophagus | 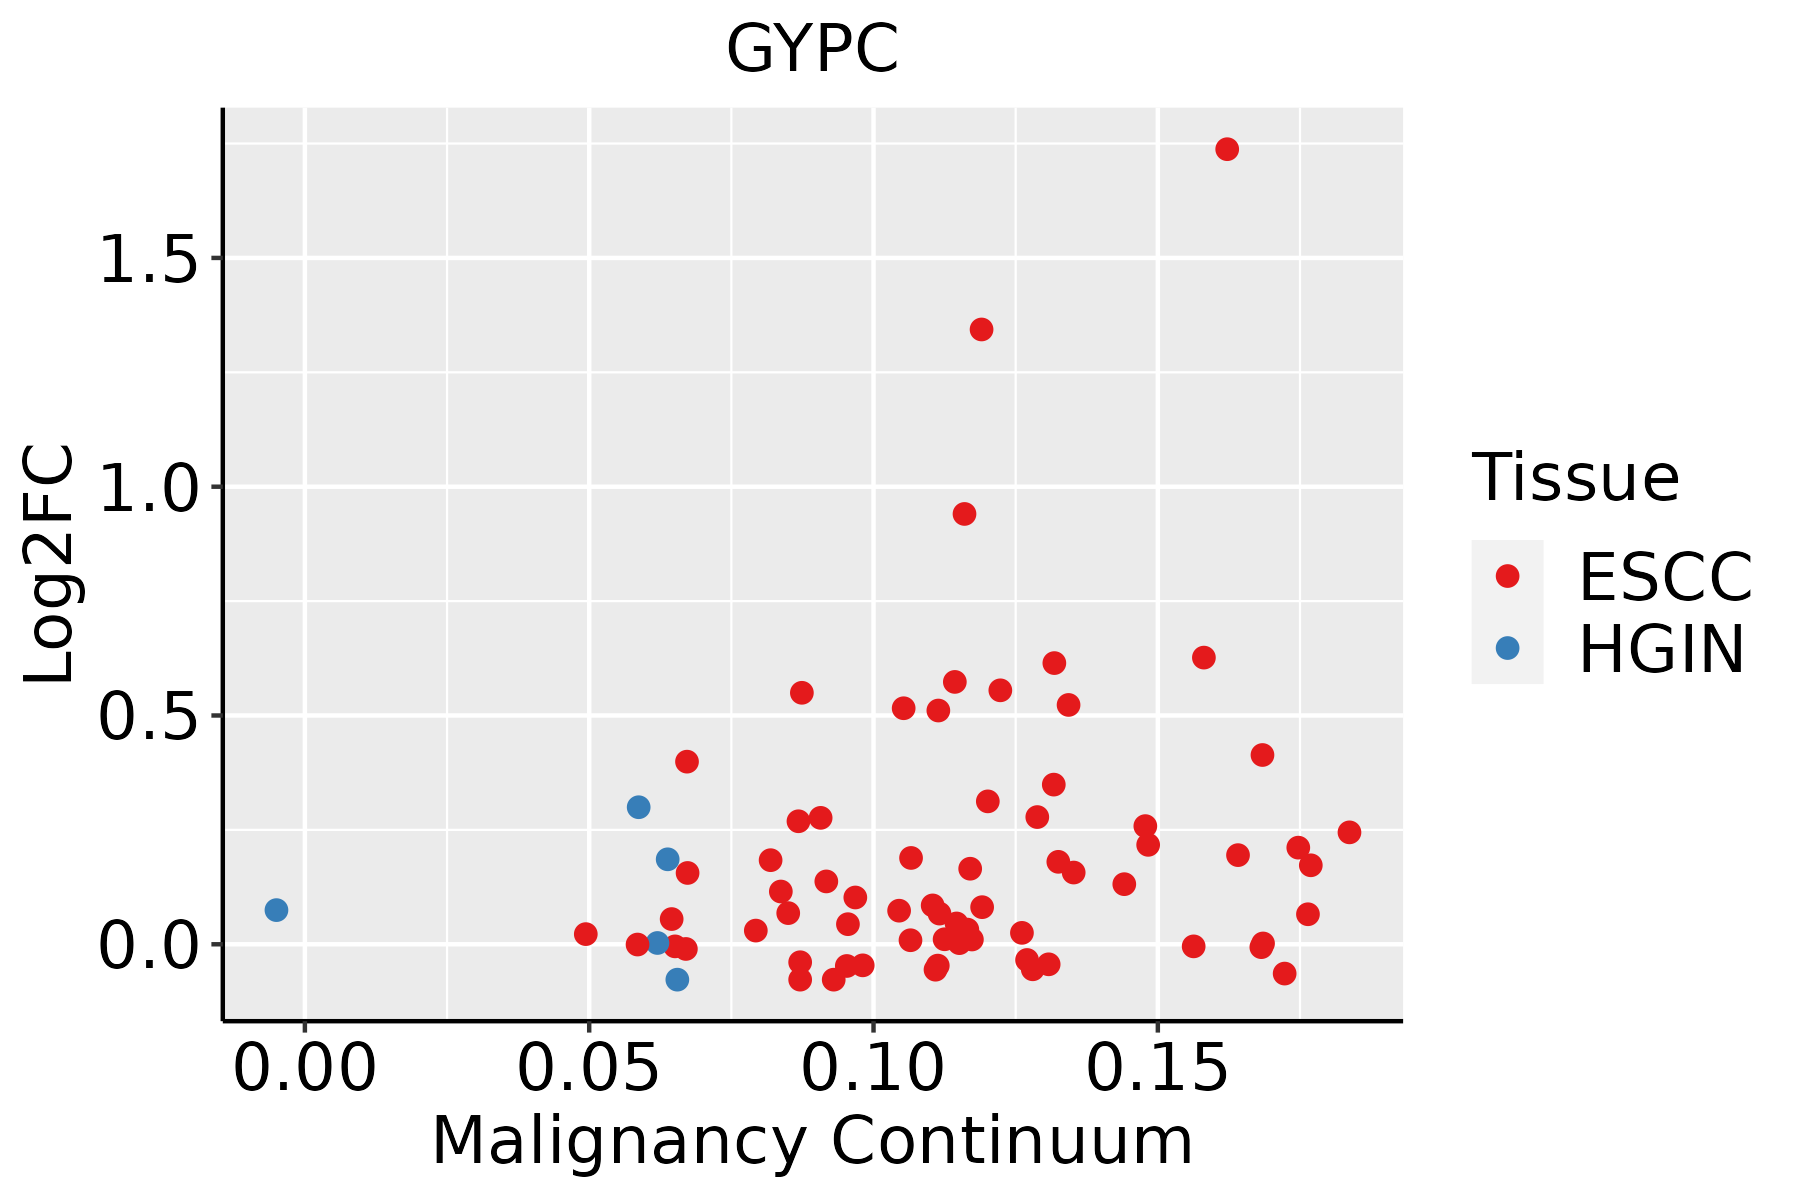 | ESCC: Esophageal squamous cell carcinoma |
| HGIN: High-grade intraepithelial neoplasias | ||
| LGIN: Low-grade intraepithelial neoplasias | ||
| Liver |  | HCC: Hepatocellular carcinoma |
| NAFLD: Non-alcoholic fatty liver disease | ||
| Oral Cavity | 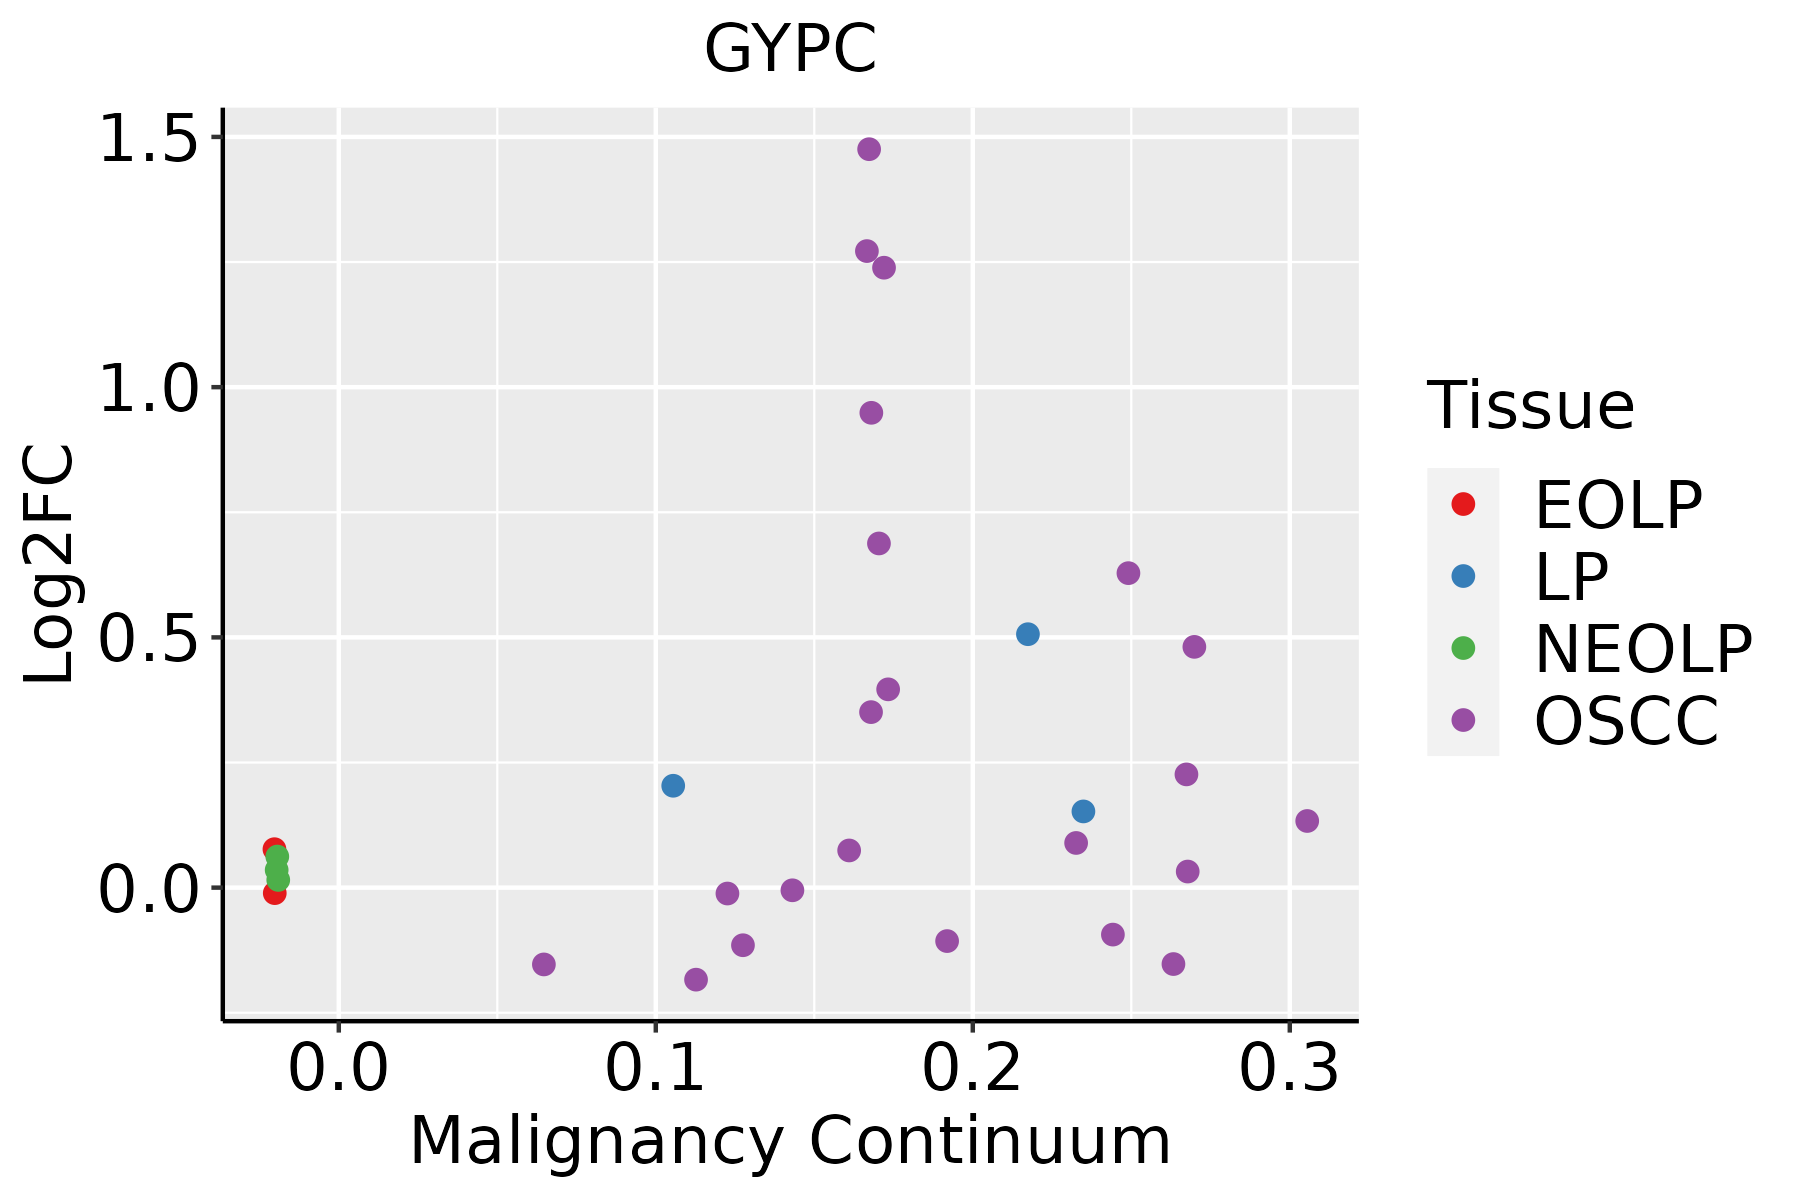 | EOLP: Erosive Oral lichen planus |
| LP: leukoplakia | ||
| NEOLP: Non-erosive oral lichen planus | ||
| OSCC: Oral squamous cell carcinoma | ||
| Thyroid | 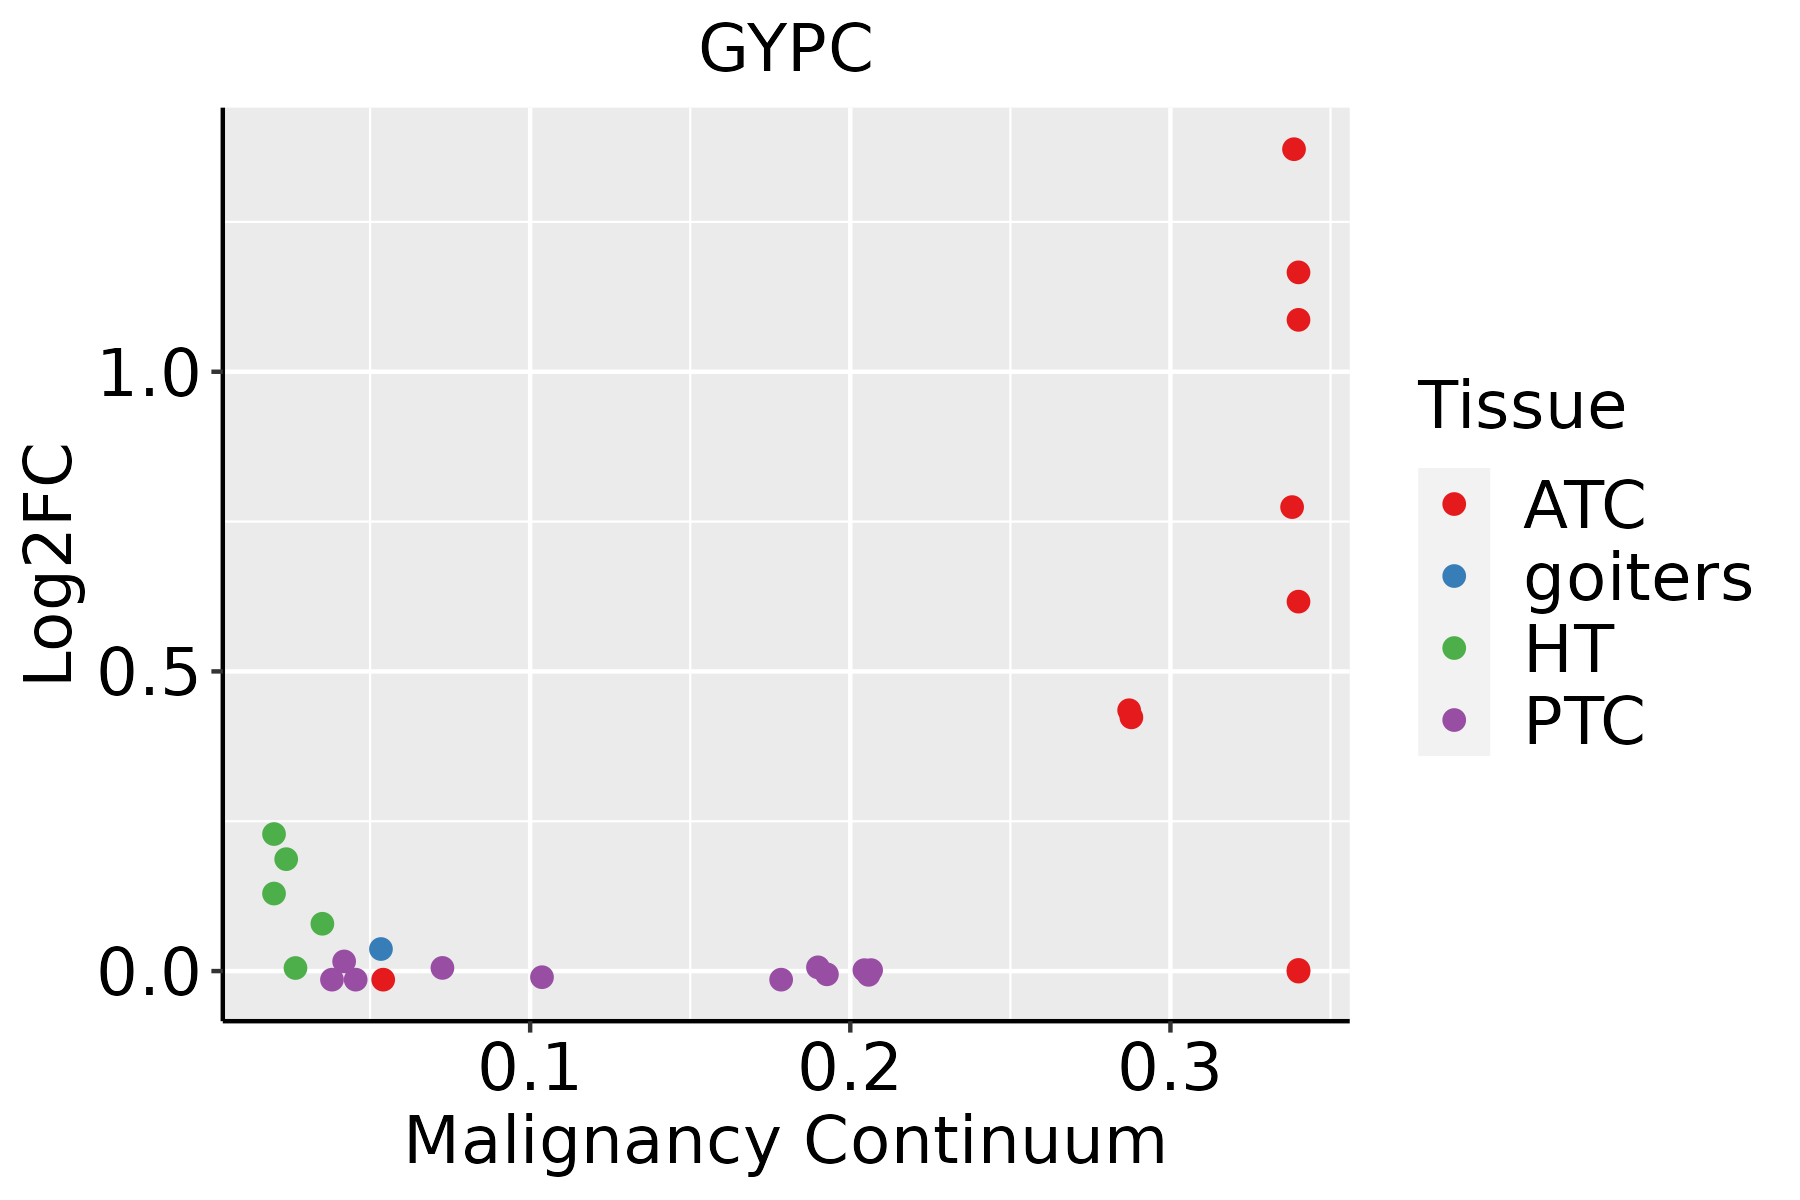 | ATC: Anaplastic thyroid cancer |
| HT: Hashimoto's thyroiditis | ||
| PTC: Papillary thyroid cancer |
| ∗log2FC in expression of this searched gene in stem-like cells from each diseased tissue sample relative to stem-like cells in normal samples in each tissue plotted against the malignancy continuum. Samples are colored based on if they are from different disease stage. |
Top |
Malignant transformation related pathway analysis |
| Find out the enriched GO biological processes and KEGG pathways involved in transition from healthy to precancer to cancer |
| Tissue | Disease Stage | Enriched GO biological Processes |
| Colorectum | AD |  |
| Colorectum | SER |  |
| Colorectum | MSS |  |
| Colorectum | MSI-H |  |
| Colorectum | FAP |  |
| ∗Top 15 enriched GO BP terms are showed in the bar plot of each disease state in each tissue. Each row represents a significant GO biological process which is colored according to the -log10(p.adjust). |
| Page: 1 2 3 4 5 6 7 8 9 |
| GO ID | Tissue | Disease Stage | Description | Gene Ratio | Bg Ratio | pvalue | p.adjust | Count |
| Page: 1 |
| Pathway ID | Tissue | Disease Stage | Description | Gene Ratio | Bg Ratio | pvalue | p.adjust | qvalue | Count |
| Page: 1 |
Top |
Cell-cell communication analysis |
| Identification of potential cell-cell interactions between two cell types and their ligand-receptor pairs for different disease states |
| Ligand | Receptor | LRpair | Pathway | Tissue | Disease Stage |
| Page: 1 |
Top |
Single-cell gene regulatory network inference analysis |
| Find out the significant the regulons (TFs) and the target genes of each regulon across cell types for different disease states |
| TF | Cell Type | Tissue | Disease Stage | Target Gene | RSS | Regulon Activity |
| ∗The dot plots of a searched regulon are shown for all cell subpopulations in each disease state of each tissue based on the regulon specific score inferred using pySCENIC and by calculating the average expression. |
| Page: 1 |
Top |
Somatic mutation of malignant transformation related genes |
| Annotation of somatic variants for genes involved in malignant transformation |
| Hugo Symbol | Variant Class | Variant Classification | dbSNP RS | HGVSc | HGVSp | HGVSp Short | SWISSPROT | BIOTYPE | SIFT | PolyPhen | Tumor Sample Barcode | Tissue | Histology | Sex | Age | Stage | Therapy Types | Drugs | Outcome |
| GYPC | SNV | Missense_Mutation | c.29N>T | p.Thr10Met | p.T10M | P04921 | protein_coding | deleterious(0.01) | possibly_damaging(0.902) | TCGA-AD-6889-01 | Colorectum | colon adenocarcinoma | Male | >=65 | I/II | Chemotherapy | xeloda | PD | |
| GYPC | SNV | Missense_Mutation | rs149400883 | c.245G>A | p.Arg82His | p.R82H | P04921 | protein_coding | tolerated(0.51) | benign(0.001) | TCGA-F4-6856-01 | Colorectum | colon adenocarcinoma | Male | <65 | I/II | Ancillary | leucovorin | CR |
| GYPC | SNV | Missense_Mutation | c.184A>G | p.Ile62Val | p.I62V | P04921 | protein_coding | tolerated(0.09) | possibly_damaging(0.546) | TCGA-G4-6586-01 | Colorectum | colon adenocarcinoma | Female | >=65 | I/II | Unknown | Unknown | SD | |
| GYPC | SNV | Missense_Mutation | rs151167334 | c.269N>T | p.Thr90Met | p.T90M | P04921 | protein_coding | deleterious(0) | probably_damaging(0.996) | TCGA-AX-A1CE-01 | Endometrium | uterine corpus endometrioid carcinoma | Female | <65 | I/II | Unspecific | Paclitaxel | SD |
| GYPC | SNV | Missense_Mutation | novel | c.323C>A | p.Ala108Asp | p.A108D | P04921 | protein_coding | deleterious(0) | probably_damaging(0.999) | TCGA-D1-A0ZO-01 | Endometrium | uterine corpus endometrioid carcinoma | Female | >=65 | I/II | Unknown | Unknown | SD |
| GYPC | SNV | Missense_Mutation | c.173N>G | p.Asp58Gly | p.D58G | P04921 | protein_coding | deleterious(0.02) | possibly_damaging(0.722) | TCGA-FI-A2D0-01 | Endometrium | uterine corpus endometrioid carcinoma | Female | <65 | I/II | Unknown | Unknown | SD | |
| GYPC | SNV | Missense_Mutation | c.109C>A | p.Pro37Thr | p.P37T | P04921 | protein_coding | deleterious(0.01) | benign(0.015) | TCGA-05-4417-01 | Lung | lung adenocarcinoma | Female | <65 | I/II | Unknown | Unknown | SD | |
| GYPC | SNV | Missense_Mutation | c.266N>T | p.Gly89Val | p.G89V | P04921 | protein_coding | deleterious(0) | probably_damaging(1) | TCGA-69-7979-01 | Lung | lung adenocarcinoma | Female | >=65 | I/II | Unknown | Unknown | SD | |
| GYPC | SNV | Missense_Mutation | c.191N>T | p.Gly64Val | p.G64V | P04921 | protein_coding | deleterious(0.01) | benign(0.067) | TCGA-95-7039-01 | Lung | lung adenocarcinoma | Female | <65 | I/II | Unknown | Unknown | PD | |
| GYPC | SNV | Missense_Mutation | c.134N>A | p.Pro45Gln | p.P45Q | P04921 | protein_coding | deleterious(0) | benign(0) | TCGA-22-5481-01 | Lung | lung squamous cell carcinoma | Female | >=65 | I/II | Unknown | Unknown | PD |
| Page: 1 2 |
Top |
Related drugs of malignant transformation related genes |
| Identification of chemicals and drugs interact with genes involved in malignant transfromation |
| (DGIdb 4.0) |
| Entrez ID | Symbol | Category | Interaction Types | Drug Claim Name | Drug Name | PMIDs |
| Page: 1 |

Copyright 2023-Present -The University of Texas Health Science Center at Houston |