Schematic overview of the cellular and molecular mechanisms involved in the cancer progression, including the proposed cellular and molecular mechanisms in cancer cells trajectory. AT1: alveolar type 1 cells; AT2: alveolar type 2 cells; AAH: atypical adenomatous hyperplasia; AIS: adenocarcinoma in situ; MIA: minimally invasive adenocarcinoma; IA: invasive adenocarcinoma; EMT: epithelial-mesenchymal transition

Home

Download

Statistics

Help

Contact

Center for Computational Systems Medicine
leaf

Gene summary

leaf

Malignant transformation analysis

leaf

Malignant transformation related pathway analysis

leaf

Cell-cell communication analysis

leaf

Single-cell gene regulatory network inference analysis

leaf

Somatic mutation of malignant transformation related genes

leaf

Related drugs of malignant transformation related genes

Gene: GYG1

Gene summary for GYG1

check button Gene summary.

Gene informationSpeciesHuman
Gene symbol

GYG1

Gene ID

2992

Gene nameglycogenin 1
Gene AliasGSD15
Cytomap3q24
Gene Typeprotein-coding
GO ID

GO:0000271

UniProtAcc

P46976


Top

Malignant transformation analysis

check button Identification of the aberrant gene expression in precancerous and cancerous lesions by comparing the gene expression of stem-like cells in diseased tissues with normal stem cells
check button Malignant transformation involving gene list.
Entrez IDSymbolReplicatesSpeciesOrganTissueAdj P-valueLog2FCMalignancy
2992GYG1LZE4THumanEsophagusESCC5.06e-215.69e-010.0811
2992GYG1LZE5THumanEsophagusESCC1.96e-022.53e-010.0514
2992GYG1LZE7THumanEsophagusESCC7.02e-127.39e-010.0667
2992GYG1LZE8THumanEsophagusESCC1.87e-114.42e-010.067
2992GYG1LZE22THumanEsophagusESCC4.07e-043.32e-010.068
2992GYG1LZE24THumanEsophagusESCC4.92e-165.10e-010.0596
2992GYG1LZE6THumanEsophagusESCC1.19e-063.41e-010.0845
2992GYG1P2T-EHumanEsophagusESCC4.98e-631.13e+000.1177
2992GYG1P4T-EHumanEsophagusESCC9.41e-225.41e-010.1323
2992GYG1P5T-EHumanEsophagusESCC2.70e-317.03e-010.1327
2992GYG1P8T-EHumanEsophagusESCC9.21e-326.28e-010.0889
2992GYG1P9T-EHumanEsophagusESCC1.84e-133.52e-010.1131
2992GYG1P10T-EHumanEsophagusESCC4.99e-244.55e-010.116
2992GYG1P11T-EHumanEsophagusESCC6.47e-135.80e-010.1426
2992GYG1P12T-EHumanEsophagusESCC4.18e-123.24e-010.1122
2992GYG1P15T-EHumanEsophagusESCC1.76e-205.79e-010.1149
2992GYG1P16T-EHumanEsophagusESCC5.17e-357.52e-010.1153
2992GYG1P17T-EHumanEsophagusESCC7.16e-084.00e-010.1278
2992GYG1P19T-EHumanEsophagusESCC5.09e-077.30e-010.1662
2992GYG1P20T-EHumanEsophagusESCC2.84e-256.65e-010.1124
Page: 1 2 3 4 5 

check button Transcriptomic changes along malignancy continuum.
TissueExpression DynamicsAbbreviation
EsophagusThe image shows the transcriptomic changes along malignancy continuum.log2FC in expression of this searched gene in stem-like cells from each diseased tissue sample relative to stem-like cells in normal samples in each tissue plotted against the malignancy continuum. Samples are colored based on if they are from different disease stage.
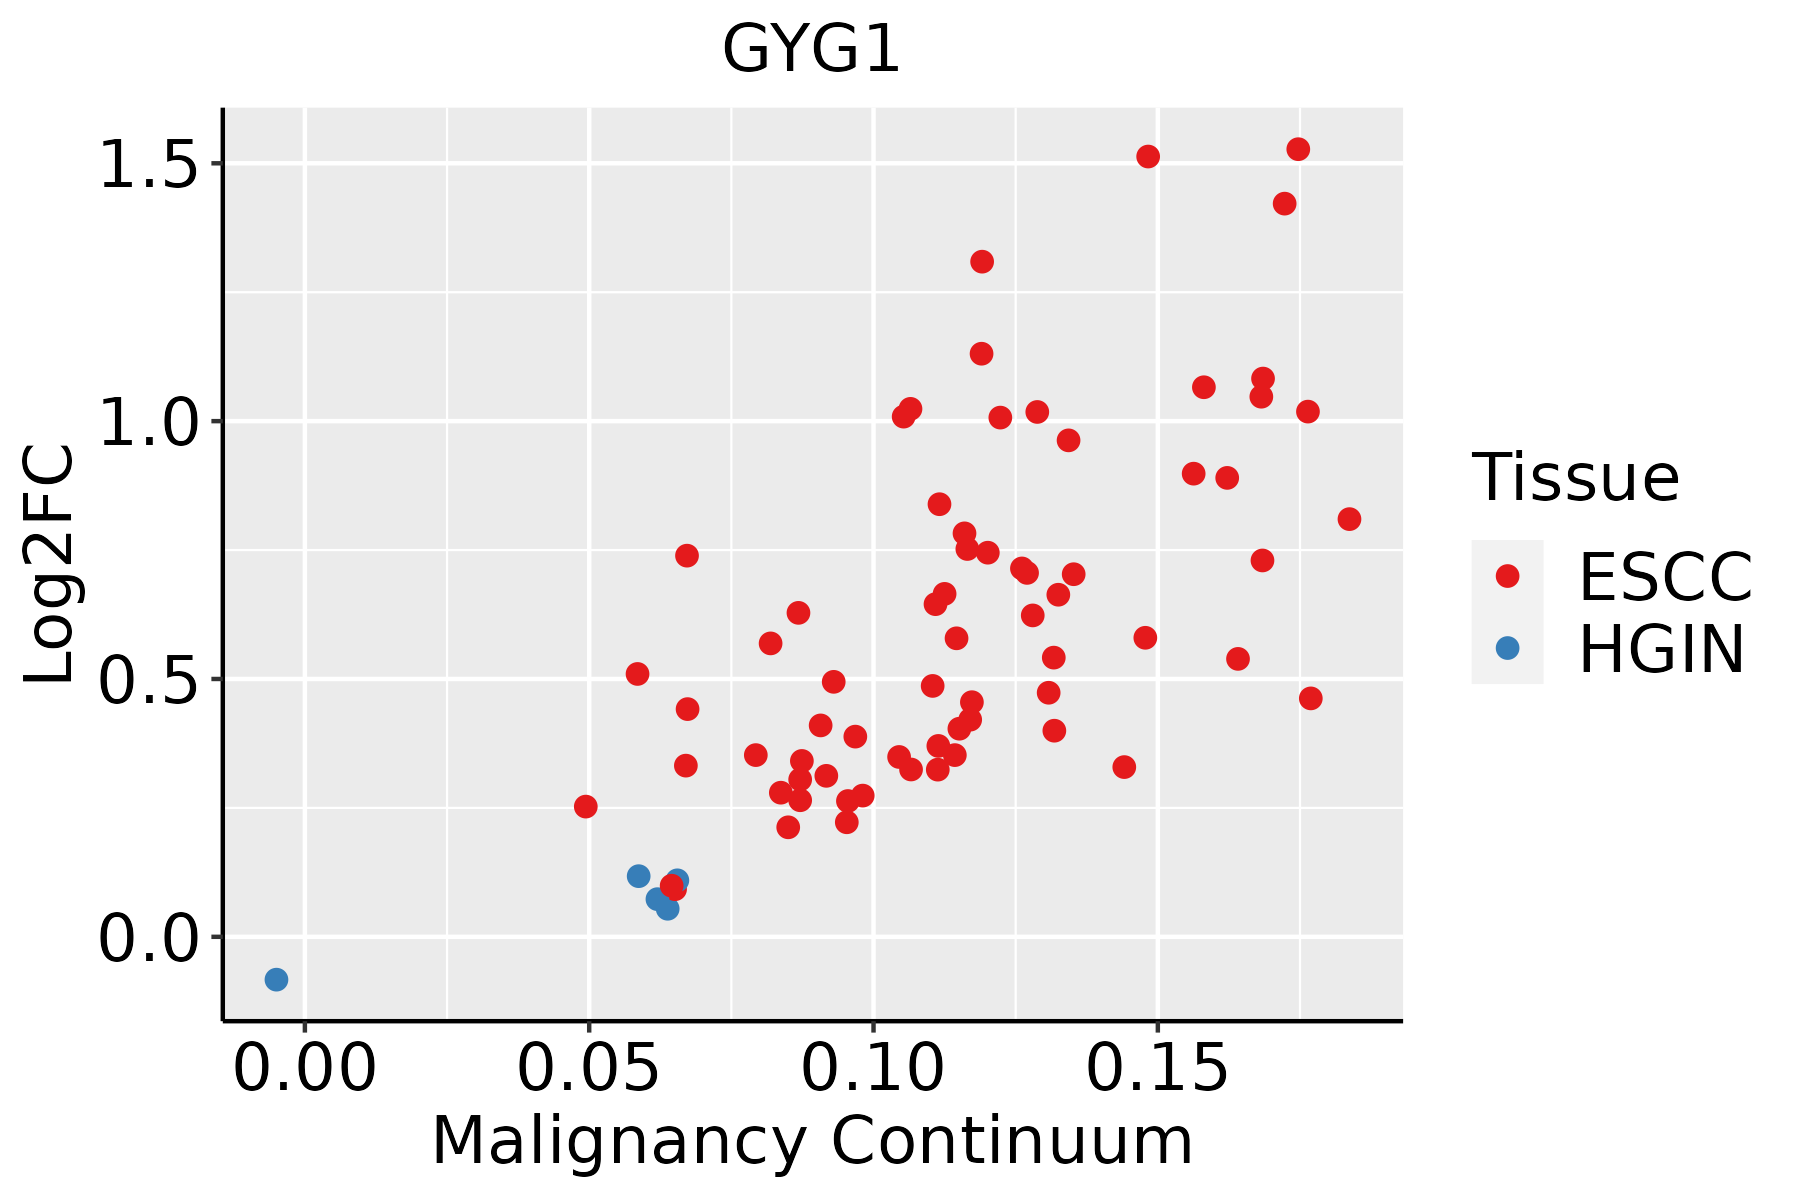
ESCC: Esophageal squamous cell carcinoma
HGIN: High-grade intraepithelial neoplasias
LGIN: Low-grade intraepithelial neoplasias
LiverThe image shows the transcriptomic changes along malignancy continuum.log2FC in expression of this searched gene in stem-like cells from each diseased tissue sample relative to stem-like cells in normal samples in each tissue plotted against the malignancy continuum. Samples are colored based on if they are from different disease stage.HCC: Hepatocellular carcinoma
NAFLD: Non-alcoholic fatty liver disease
Oral CavityThe image shows the transcriptomic changes along malignancy continuum.log2FC in expression of this searched gene in stem-like cells from each diseased tissue sample relative to stem-like cells in normal samples in each tissue plotted against the malignancy continuum. Samples are colored based on if they are from different disease stage.EOLP: Erosive Oral lichen planus
LP: leukoplakia
NEOLP: Non-erosive oral lichen planus
OSCC: Oral squamous cell carcinoma
SkinThe image shows the transcriptomic changes along malignancy continuum.log2FC in expression of this searched gene in stem-like cells from each diseased tissue sample relative to stem-like cells in normal samples in each tissue plotted against the malignancy continuum. Samples are colored based on if they are from different disease stage.
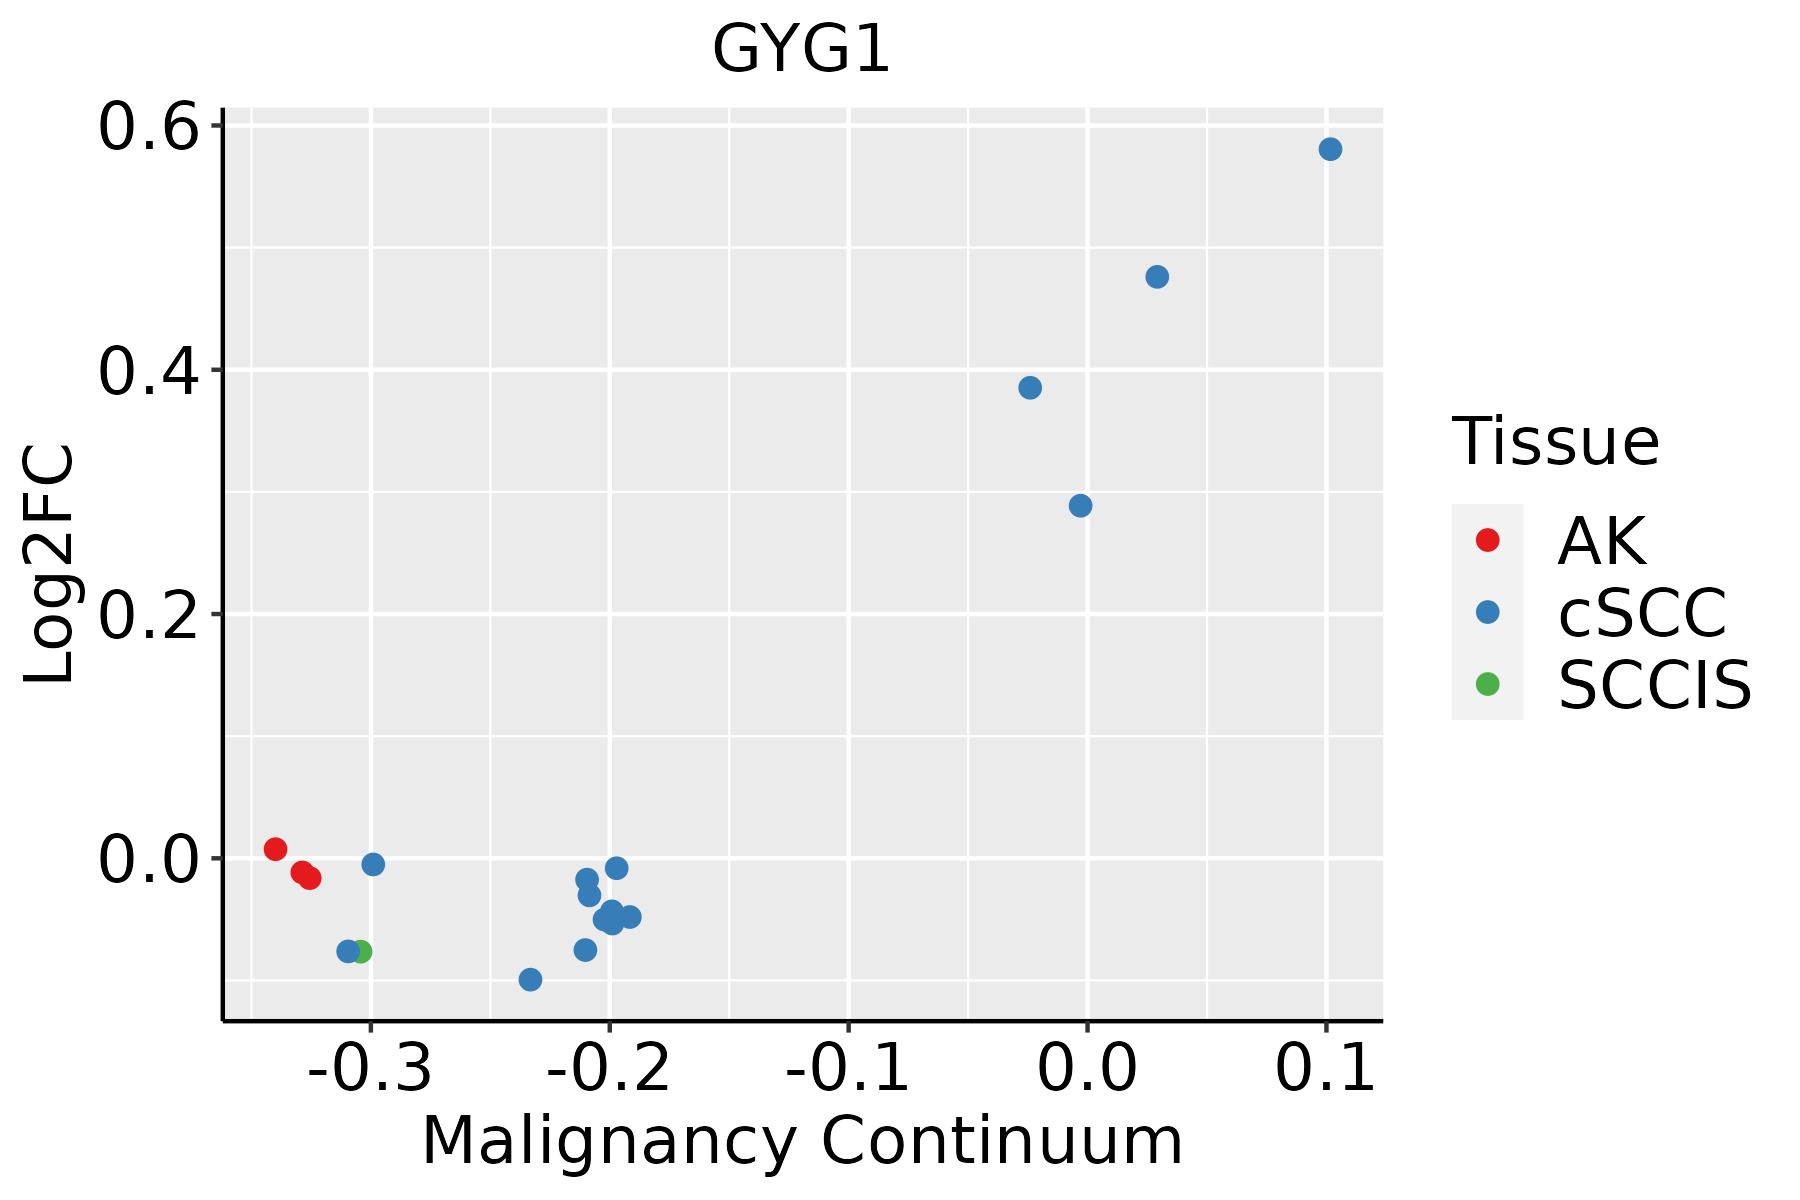
AK: Actinic keratosis
cSCC: Cutaneous squamous cell carcinoma
SCCIS:squamous cell carcinoma in situ
∗log2FC in expression of this searched gene in stem-like cells from each diseased tissue sample relative to stem-like cells in normal samples in each tissue plotted against the malignancy continuum. Samples are colored based on if they are from different disease stage.

Top

Malignant transformation related pathway analysis

check buttonFind out the enriched GO biological processes and KEGG pathways involved in transition from healthy to precancer to cancer
check button Figure of enriched GO biological processes.
TissueDisease StageEnriched GO biological Processes
ColorectumADGO analysis - Figure of enriched GO biological processes: Top 15 enriched GO BP terms are showed in the bar plot of each disease state in each tissue. Each row represents a significant GO biological process which is colored according to the -log10(p.adjust).
ColorectumSERGO analysis - Figure of enriched GO biological processes: Top 15 enriched GO BP terms are showed in the bar plot of each disease state in each tissue. Each row represents a significant GO biological process which is colored according to the -log10(p.adjust).
ColorectumMSSGO analysis - Figure of enriched GO biological processes: Top 15 enriched GO BP terms are showed in the bar plot of each disease state in each tissue. Each row represents a significant GO biological process which is colored according to the -log10(p.adjust).
ColorectumMSI-HGO analysis - Figure of enriched GO biological processes: Top 15 enriched GO BP terms are showed in the bar plot of each disease state in each tissue. Each row represents a significant GO biological process which is colored according to the -log10(p.adjust).
ColorectumFAPGO analysis - Figure of enriched GO biological processes: Top 15 enriched GO BP terms are showed in the bar plot of each disease state in each tissue. Each row represents a significant GO biological process which is colored according to the -log10(p.adjust).
∗Top 15 enriched GO BP terms are showed in the bar plot of each disease state in each tissue. Each row represents a significant GO biological process which is colored according to the -log10(p.adjust).
Page: 1 2 3 4 5 6 7 8 9 

check button Enriched GO biological processes.
GO IDTissueDisease StageDescriptionGene RatioBg Ratiopvaluep.adjustCount
GO:0006091110EsophagusESCCgeneration of precursor metabolites and energy331/8552490/187233.86e-238.45e-21331
GO:0015980110EsophagusESCCenergy derivation by oxidation of organic compounds220/8552318/187231.20e-171.09e-15220
GO:00442626EsophagusESCCcellular carbohydrate metabolic process160/8552283/187231.43e-049.66e-04160
GO:00160514EsophagusESCCcarbohydrate biosynthetic process117/8552202/187232.96e-041.79e-03117
GO:00346372EsophagusESCCcellular carbohydrate biosynthetic process46/855278/187231.24e-024.13e-0246
GO:000609122LiverHCCgeneration of precursor metabolites and energy340/7958490/187234.04e-342.85e-31340
GO:001598022LiverHCCenergy derivation by oxidation of organic compounds221/7958318/187231.02e-221.86e-20221
GO:004426221LiverHCCcellular carbohydrate metabolic process153/7958283/187235.27e-055.00e-04153
GO:00160512LiverHCCcarbohydrate biosynthetic process113/7958202/187237.64e-056.83e-04113
GO:00059772LiverHCCglycogen metabolic process46/795872/187232.02e-041.56e-0346
GO:00060732LiverHCCcellular glucan metabolic process46/795873/187233.23e-042.28e-0346
GO:00440422LiverHCCglucan metabolic process46/795873/187233.23e-042.28e-0346
GO:00059781LiverHCCglycogen biosynthetic process29/795844/187231.46e-037.75e-0329
GO:00092501LiverHCCglucan biosynthetic process29/795844/187231.46e-037.75e-0329
GO:00061122LiverHCCenergy reserve metabolic process49/795884/187232.46e-031.19e-0249
GO:00346371LiverHCCcellular carbohydrate biosynthetic process44/795878/187239.13e-033.51e-0244
GO:00442641LiverHCCcellular polysaccharide metabolic process52/795896/187231.38e-024.91e-0252
GO:000609118Oral cavityOSCCgeneration of precursor metabolites and energy286/7305490/187231.45e-181.71e-16286
GO:001598018Oral cavityOSCCenergy derivation by oxidation of organic compounds190/7305318/187234.10e-142.26e-12190
GO:00160513Oral cavityOSCCcarbohydrate biosynthetic process97/7305202/187235.50e-032.13e-0297
Page: 1 2 

check button Enriched KEGG pathways.
Pathway IDTissueDisease StageDescriptionGene RatioBg Ratiopvaluep.adjustqvalueCount
Page: 1 

Top

Cell-cell communication analysis

check buttonIdentification of potential cell-cell interactions between two cell types and their ligand-receptor pairs for different disease states
LigandReceptorLRpairPathwayTissueDisease Stage
Page: 1 

Top

Single-cell gene regulatory network inference analysis

check buttonFind out the significant the regulons (TFs) and the target genes of each regulon across cell types for different disease states
TFCell TypeTissueDisease StageTarget GeneRSSRegulon Activity
∗The dot plots of a searched regulon are shown for all cell subpopulations in each disease state of each tissue based on the regulon specific score inferred using pySCENIC and by calculating the average expression.
Page: 1 

Top

Somatic mutation of malignant transformation related genes

check buttonAnnotation of somatic variants for genes involved in malignant transformation
Hugo SymbolVariant ClassVariant ClassificationdbSNP RSHGVScHGVSpHGVSp ShortSWISSPROTBIOTYPESIFTPolyPhenTumor Sample BarcodeTissueHistologySexAgeStageTherapy TypesDrugsOutcome
GYG1SNVMissense_Mutationc.539G>Tp.Arg180Ilep.R180IP46976protein_codingdeleterious(0.05)benign(0.206)TCGA-A2-A0EY-01Breastbreast invasive carcinomaFemale<65I/IIChemotherapyadriamycinSD
GYG1SNVMissense_Mutationrs781042039c.875G>Cp.Arg292Thrp.R292TP46976protein_codingtolerated(0.5)benign(0.236)TCGA-BH-A0BP-01Breastbreast invasive carcinomaFemale>=65I/IIUnknownUnknownSD
GYG1SNVMissense_Mutationnovelc.698N>Ap.Ser233Asnp.S233NP46976protein_codingtolerated(0.29)benign(0)TCGA-LL-A6FQ-01Breastbreast invasive carcinomaFemale>=65III/IVUnknownUnknownSD
GYG1insertionIn_Frame_Insnovelc.736_737insAGCAGGGTTTGGAGCTAGGCTACAGGTTTGGTCCAGATCTGTp.Leu246delinsGlnGlnGlyLeuGluLeuGlyTyrArgPheGlyProAspLeuPhep.L246delinsQQGLELGYRFGPDLFP46976protein_codingTCGA-AN-A04A-01Breastbreast invasive carcinomaFemale<65III/IVUnknownUnknownSD
GYG1insertionNonsense_Mutationnovelc.579_580insTTATTTCTTTTGAATGAATGGCCATGATCCCCGCTTTCTGAGGAAGp.Ile194LeufsTer9p.I194Lfs*9P46976protein_codingTCGA-B6-A0RE-01Breastbreast invasive carcinomaFemale<65I/IIUnknownUnknownSD
GYG1SNVMissense_Mutationc.71N>Tp.Ser24Leup.S24LP46976protein_codingtolerated(0.11)benign(0.018)TCGA-C5-A1BQ-01Cervixcervical & endocervical cancerFemale>=65III/IVChemotherapycisplatinCR
GYG1SNVMissense_Mutationc.334G>Ap.Asp112Asnp.D112NP46976protein_codingdeleterious(0)probably_damaging(1)TCGA-Q1-A73O-01Cervixcervical & endocervical cancerFemale<65I/IIChemotherapycisplatinCR
GYG1SNVMissense_Mutationnovelc.163N>Cp.Phe55Leup.F55LP46976protein_codingdeleterious(0)probably_damaging(0.951)TCGA-F5-6814-01Colorectumrectum adenocarcinomaMale<65I/IIUnknownUnknownSD
GYG1SNVMissense_Mutationnovelc.736N>Ap.Leu246Ilep.L246IP46976protein_codingtolerated(0.06)possibly_damaging(0.818)TCGA-F5-6814-01Colorectumrectum adenocarcinomaMale<65I/IIUnknownUnknownSD
GYG1SNVMissense_Mutationnovelc.953N>Tp.Ser318Leup.S318LP46976protein_codingdeleterious(0.03)possibly_damaging(0.594)TCGA-A5-A0G2-01Endometriumuterine corpus endometrioid carcinomaFemale<65III/IVUnknownUnknownSD
Page: 1 2 3 

Top

Related drugs of malignant transformation related genes

check buttonIdentification of chemicals and drugs interact with genes involved in malignant transfromation
(DGIdb 4.0)
Entrez IDSymbolCategoryInteraction TypesDrug Claim NameDrug NamePMIDs
Page: 1