
|
|||||
|
 | |
| |
| |
| |
| |
| |
|
Gene: GXYLT2 |
Gene summary for GXYLT2 |
| Gene information | Species | Human | Gene symbol | GXYLT2 | Gene ID | 727936 |
| Gene name | glucoside xylosyltransferase 2 | |
| Gene Alias | GLT8D4 | |
| Cytomap | 3p13 | |
| Gene Type | protein-coding | GO ID | GO:0006464 | UniProtAcc | A0PJZ3 |
Top |
Malignant transformation analysis |
| Identification of the aberrant gene expression in precancerous and cancerous lesions by comparing the gene expression of stem-like cells in diseased tissues with normal stem cells |
| Entrez ID | Symbol | Replicates | Species | Organ | Tissue | Adj P-value | Log2FC | Malignancy |
| 727936 | GXYLT2 | HTA11_696_2000001011 | Human | Colorectum | AD | 8.98e-03 | -2.15e-01 | -0.1464 |
| 727936 | GXYLT2 | HTA11_7663_2000001011 | Human | Colorectum | SER | 3.31e-09 | 1.05e+00 | 0.0131 |
| 727936 | GXYLT2 | HTA11_99999970781_79442 | Human | Colorectum | MSS | 1.99e-03 | 4.22e-01 | 0.294 |
| 727936 | GXYLT2 | F007 | Human | Colorectum | FAP | 6.98e-05 | -3.21e-01 | 0.1176 |
| 727936 | GXYLT2 | A002-C-010 | Human | Colorectum | FAP | 5.36e-03 | -1.98e-01 | 0.242 |
| 727936 | GXYLT2 | A015-C-203 | Human | Colorectum | FAP | 2.41e-08 | -2.06e-01 | -0.1294 |
| 727936 | GXYLT2 | A002-C-201 | Human | Colorectum | FAP | 4.71e-04 | -2.40e-01 | 0.0324 |
| 727936 | GXYLT2 | A002-C-203 | Human | Colorectum | FAP | 1.61e-09 | -2.71e-01 | 0.2786 |
| 727936 | GXYLT2 | A001-C-108 | Human | Colorectum | FAP | 2.25e-06 | -2.47e-01 | -0.0272 |
| 727936 | GXYLT2 | A002-C-205 | Human | Colorectum | FAP | 3.13e-07 | -2.98e-01 | -0.1236 |
| 727936 | GXYLT2 | A001-C-104 | Human | Colorectum | FAP | 9.57e-04 | -2.06e-01 | 0.0184 |
| 727936 | GXYLT2 | A015-C-006 | Human | Colorectum | FAP | 2.42e-04 | -3.06e-01 | -0.0994 |
| 727936 | GXYLT2 | A002-C-114 | Human | Colorectum | FAP | 9.68e-06 | -2.85e-01 | -0.1561 |
| 727936 | GXYLT2 | A015-C-104 | Human | Colorectum | FAP | 7.64e-09 | -2.50e-01 | -0.1899 |
| 727936 | GXYLT2 | A001-C-014 | Human | Colorectum | FAP | 1.49e-10 | -2.96e-01 | 0.0135 |
| 727936 | GXYLT2 | A002-C-016 | Human | Colorectum | FAP | 9.21e-10 | -2.45e-01 | 0.0521 |
| 727936 | GXYLT2 | A015-C-002 | Human | Colorectum | FAP | 2.82e-02 | -2.73e-01 | -0.0763 |
| 727936 | GXYLT2 | A001-C-203 | Human | Colorectum | FAP | 6.55e-04 | -1.34e-01 | -0.0481 |
| 727936 | GXYLT2 | A002-C-116 | Human | Colorectum | FAP | 4.99e-10 | -2.69e-01 | -0.0452 |
| 727936 | GXYLT2 | A014-C-008 | Human | Colorectum | FAP | 4.74e-03 | -2.79e-01 | -0.191 |
| Page: 1 2 |
| Tissue | Expression Dynamics | Abbreviation |
| Colorectum (GSE201348) |  | FAP: Familial adenomatous polyposis |
| CRC: Colorectal cancer | ||
| Colorectum (HTA11) |  | AD: Adenomas |
| SER: Sessile serrated lesions | ||
| MSI-H: Microsatellite-high colorectal cancer | ||
| MSS: Microsatellite stable colorectal cancer | ||
| Thyroid | 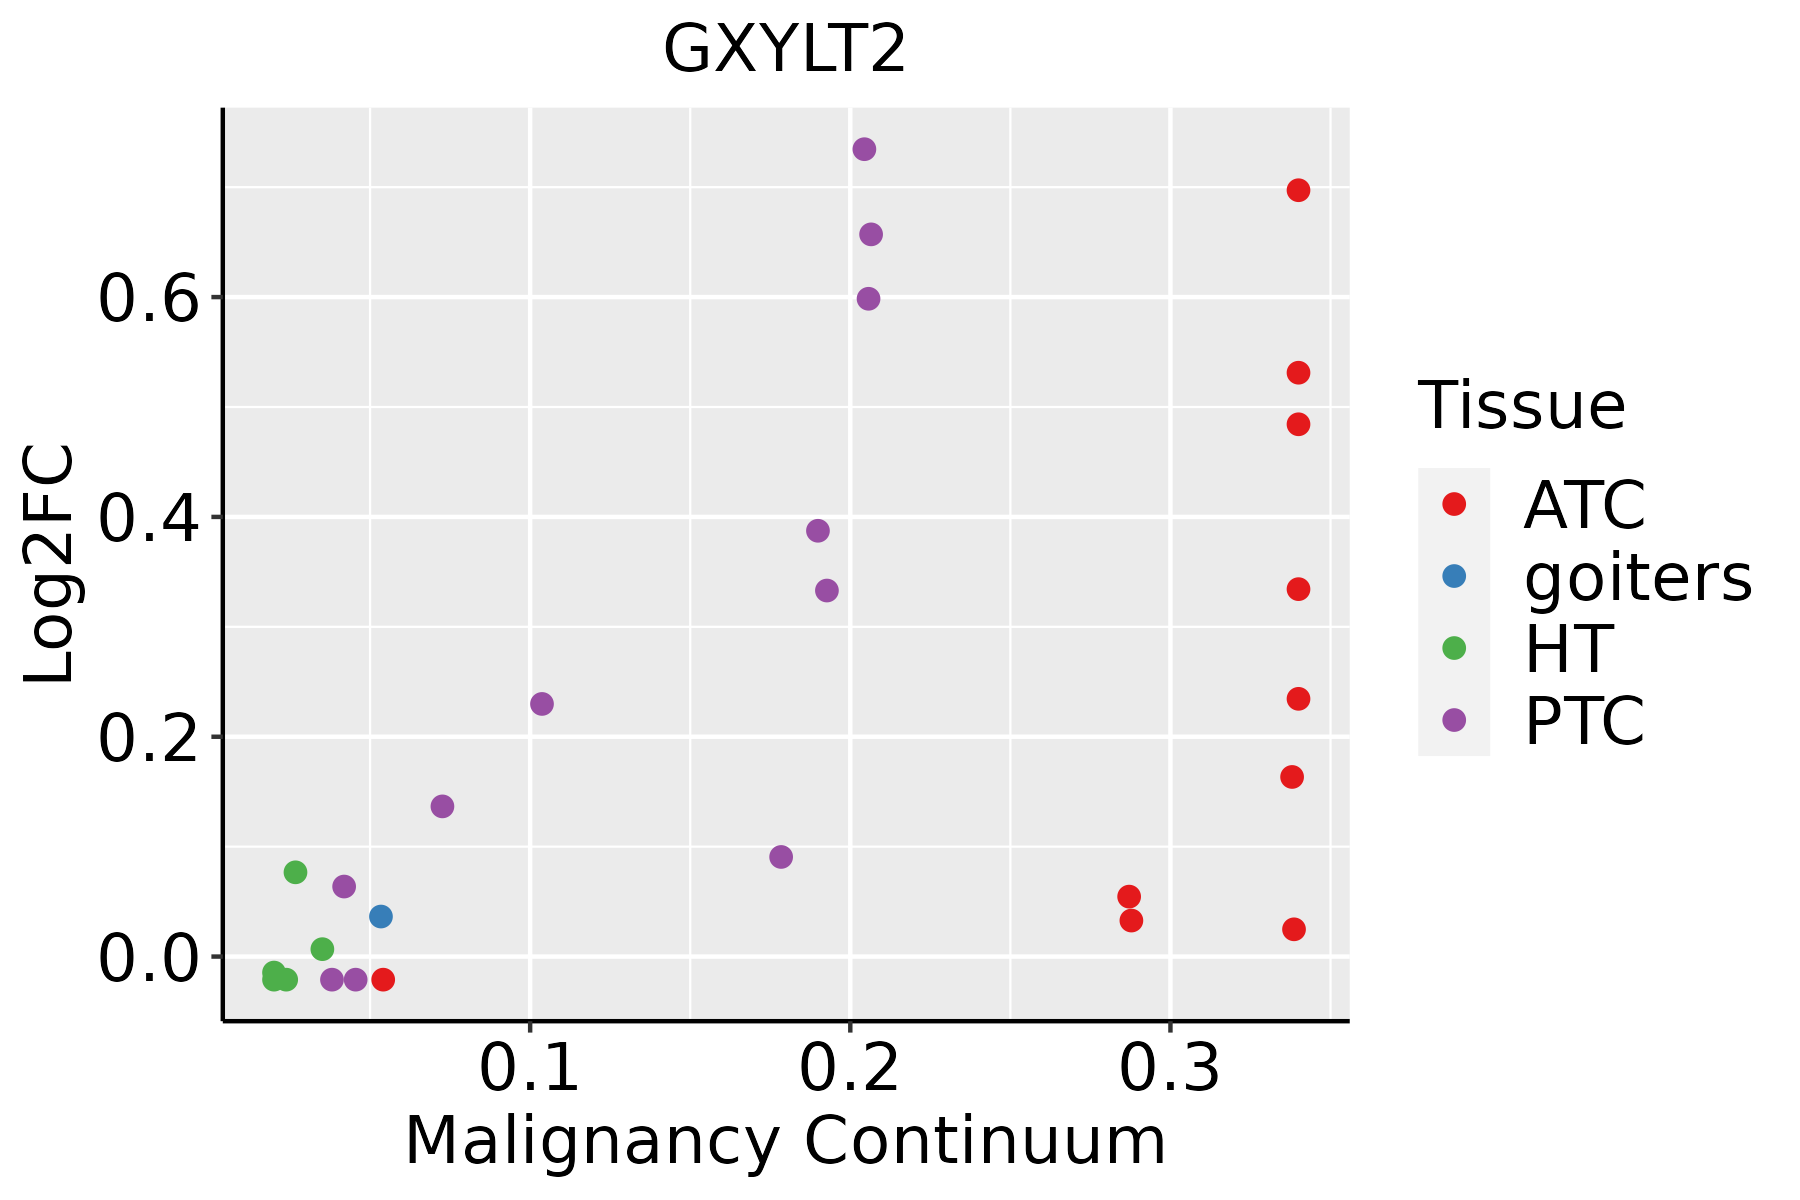 | ATC: Anaplastic thyroid cancer |
| HT: Hashimoto's thyroiditis | ||
| PTC: Papillary thyroid cancer |
| ∗log2FC in expression of this searched gene in stem-like cells from each diseased tissue sample relative to stem-like cells in normal samples in each tissue plotted against the malignancy continuum. Samples are colored based on if they are from different disease stage. |
Top |
Malignant transformation related pathway analysis |
| Find out the enriched GO biological processes and KEGG pathways involved in transition from healthy to precancer to cancer |
| Tissue | Disease Stage | Enriched GO biological Processes |
| Colorectum | AD |  |
| Colorectum | SER |  |
| Colorectum | MSS |  |
| Colorectum | MSI-H |  |
| Colorectum | FAP |  |
| ∗Top 15 enriched GO BP terms are showed in the bar plot of each disease state in each tissue. Each row represents a significant GO biological process which is colored according to the -log10(p.adjust). |
| Page: 1 2 3 4 5 6 7 8 9 |
| GO ID | Tissue | Disease Stage | Description | Gene Ratio | Bg Ratio | pvalue | p.adjust | Count |
| GO:0006486 | Colorectum | AD | protein glycosylation | 64/3918 | 226/18723 | 4.86e-03 | 3.27e-02 | 64 |
| GO:0043413 | Colorectum | AD | macromolecule glycosylation | 64/3918 | 226/18723 | 4.86e-03 | 3.27e-02 | 64 |
| GO:0070085 | Colorectum | AD | glycosylation | 67/3918 | 240/18723 | 5.78e-03 | 3.67e-02 | 67 |
| GO:00064861 | Colorectum | FAP | protein glycosylation | 48/2622 | 226/18723 | 1.85e-03 | 1.57e-02 | 48 |
| GO:00434131 | Colorectum | FAP | macromolecule glycosylation | 48/2622 | 226/18723 | 1.85e-03 | 1.57e-02 | 48 |
| GO:00700851 | Colorectum | FAP | glycosylation | 50/2622 | 240/18723 | 2.30e-03 | 1.85e-02 | 50 |
| GO:0009101 | Colorectum | FAP | glycoprotein biosynthetic process | 63/2622 | 317/18723 | 2.31e-03 | 1.86e-02 | 63 |
| GO:00064866 | Thyroid | PTC | protein glycosylation | 94/5968 | 226/18723 | 1.25e-03 | 7.13e-03 | 94 |
| GO:00434136 | Thyroid | PTC | macromolecule glycosylation | 94/5968 | 226/18723 | 1.25e-03 | 7.13e-03 | 94 |
| GO:00700855 | Thyroid | PTC | glycosylation | 96/5968 | 240/18723 | 4.57e-03 | 2.15e-02 | 96 |
| GO:00091013 | Thyroid | PTC | glycoprotein biosynthetic process | 123/5968 | 317/18723 | 5.05e-03 | 2.33e-02 | 123 |
| GO:00091003 | Thyroid | PTC | glycoprotein metabolic process | 147/5968 | 387/18723 | 5.87e-03 | 2.64e-02 | 147 |
| GO:000648612 | Thyroid | ATC | protein glycosylation | 94/6293 | 226/18723 | 7.11e-03 | 2.82e-02 | 94 |
| GO:004341312 | Thyroid | ATC | macromolecule glycosylation | 94/6293 | 226/18723 | 7.11e-03 | 2.82e-02 | 94 |
| GO:000910011 | Thyroid | ATC | glycoprotein metabolic process | 153/6293 | 387/18723 | 7.90e-03 | 3.06e-02 | 153 |
| Page: 1 |
| Pathway ID | Tissue | Disease Stage | Description | Gene Ratio | Bg Ratio | pvalue | p.adjust | qvalue | Count |
| Page: 1 |
Top |
Cell-cell communication analysis |
| Identification of potential cell-cell interactions between two cell types and their ligand-receptor pairs for different disease states |
| Ligand | Receptor | LRpair | Pathway | Tissue | Disease Stage |
| Page: 1 |
Top |
Single-cell gene regulatory network inference analysis |
| Find out the significant the regulons (TFs) and the target genes of each regulon across cell types for different disease states |
| TF | Cell Type | Tissue | Disease Stage | Target Gene | RSS | Regulon Activity |
| ∗The dot plots of a searched regulon are shown for all cell subpopulations in each disease state of each tissue based on the regulon specific score inferred using pySCENIC and by calculating the average expression. |
| Page: 1 |
Top |
Somatic mutation of malignant transformation related genes |
| Annotation of somatic variants for genes involved in malignant transformation |
| Hugo Symbol | Variant Class | Variant Classification | dbSNP RS | HGVSc | HGVSp | HGVSp Short | SWISSPROT | BIOTYPE | SIFT | PolyPhen | Tumor Sample Barcode | Tissue | Histology | Sex | Age | Stage | Therapy Types | Drugs | Outcome |
| GXYLT2 | SNV | Missense_Mutation | novel | c.780N>A | p.Phe260Leu | p.F260L | A0PJZ3 | protein_coding | deleterious(0) | benign(0.216) | TCGA-AN-A046-01 | Breast | breast invasive carcinoma | Female | >=65 | I/II | Unknown | Unknown | SD |
| GXYLT2 | SNV | Missense_Mutation | rs563351437 | c.1303N>G | p.Ile435Val | p.I435V | A0PJZ3 | protein_coding | tolerated_low_confidence(1) | benign(0) | TCGA-AA-3492-01 | Colorectum | colon adenocarcinoma | Female | >=65 | I/II | Unknown | Unknown | SD |
| GXYLT2 | SNV | Missense_Mutation | c.1168N>A | p.Leu390Ile | p.L390I | A0PJZ3 | protein_coding | tolerated(0.25) | benign(0.271) | TCGA-AA-A00N-01 | Colorectum | colon adenocarcinoma | Male | >=65 | I/II | Unknown | Unknown | PD | |
| GXYLT2 | SNV | Missense_Mutation | rs755121331 | c.612G>T | p.Lys204Asn | p.K204N | A0PJZ3 | protein_coding | tolerated(0.12) | possibly_damaging(0.574) | TCGA-AA-A010-01 | Colorectum | colon adenocarcinoma | Female | <65 | I/II | Chemotherapy | folinic | CR |
| GXYLT2 | SNV | Missense_Mutation | novel | c.819N>T | p.Met273Ile | p.M273I | A0PJZ3 | protein_coding | deleterious(0.01) | possibly_damaging(0.836) | TCGA-CA-6717-01 | Colorectum | colon adenocarcinoma | Male | <65 | I/II | Chemotherapy | oxaliplatin | CR |
| GXYLT2 | SNV | Missense_Mutation | novel | c.604N>G | p.Ile202Val | p.I202V | A0PJZ3 | protein_coding | tolerated(0.13) | benign(0.088) | TCGA-F5-6814-01 | Colorectum | rectum adenocarcinoma | Male | <65 | I/II | Unknown | Unknown | SD |
| GXYLT2 | SNV | Missense_Mutation | novel | c.1235N>A | p.Arg412Gln | p.R412Q | A0PJZ3 | protein_coding | deleterious(0.02) | possibly_damaging(0.536) | TCGA-A5-A0G1-01 | Endometrium | uterine corpus endometrioid carcinoma | Female | >=65 | I/II | Unknown | Unknown | SD |
| GXYLT2 | SNV | Missense_Mutation | novel | c.530N>G | p.Phe177Cys | p.F177C | A0PJZ3 | protein_coding | deleterious(0) | probably_damaging(0.998) | TCGA-A5-A2K5-01 | Endometrium | uterine corpus endometrioid carcinoma | Female | >=65 | I/II | Unknown | Unknown | SD |
| GXYLT2 | SNV | Missense_Mutation | c.841A>G | p.Thr281Ala | p.T281A | A0PJZ3 | protein_coding | tolerated(0.32) | benign(0.006) | TCGA-AP-A056-01 | Endometrium | uterine corpus endometrioid carcinoma | Female | <65 | I/II | Unknown | Unknown | SD | |
| GXYLT2 | SNV | Missense_Mutation | c.1124N>T | p.Arg375Ile | p.R375I | A0PJZ3 | protein_coding | deleterious(0) | possibly_damaging(0.836) | TCGA-AP-A059-01 | Endometrium | uterine corpus endometrioid carcinoma | Female | >=65 | I/II | Unknown | Unknown | SD |
| Page: 1 2 3 4 |
Top |
Related drugs of malignant transformation related genes |
| Identification of chemicals and drugs interact with genes involved in malignant transfromation |
| (DGIdb 4.0) |
| Entrez ID | Symbol | Category | Interaction Types | Drug Claim Name | Drug Name | PMIDs |
| Page: 1 |

Copyright 2023-Present -The University of Texas Health Science Center at Houston |