
|
|||||
|
 | |
| |
| |
| |
| |
| |
|
Gene: GXYLT1 |
Gene summary for GXYLT1 |
| Gene information | Species | Human | Gene symbol | GXYLT1 | Gene ID | 283464 |
| Gene name | glucoside xylosyltransferase 1 | |
| Gene Alias | GLT8D3 | |
| Cytomap | 12q12 | |
| Gene Type | protein-coding | GO ID | GO:0006464 | UniProtAcc | Q4G148 |
Top |
Malignant transformation analysis |
| Identification of the aberrant gene expression in precancerous and cancerous lesions by comparing the gene expression of stem-like cells in diseased tissues with normal stem cells |
| Entrez ID | Symbol | Replicates | Species | Organ | Tissue | Adj P-value | Log2FC | Malignancy |
| 283464 | GXYLT1 | HCC1_Meng | Human | Liver | HCC | 1.44e-42 | 6.19e-02 | 0.0246 |
| 283464 | GXYLT1 | HCC2_Meng | Human | Liver | HCC | 3.40e-11 | 5.97e-02 | 0.0107 |
| 283464 | GXYLT1 | HCC1 | Human | Liver | HCC | 3.19e-10 | 2.37e+00 | 0.5336 |
| 283464 | GXYLT1 | HCC2 | Human | Liver | HCC | 6.92e-30 | 4.70e+00 | 0.5341 |
| 283464 | GXYLT1 | S014 | Human | Liver | HCC | 3.31e-07 | 3.37e-01 | 0.2254 |
| 283464 | GXYLT1 | S015 | Human | Liver | HCC | 1.58e-05 | 3.73e-01 | 0.2375 |
| 283464 | GXYLT1 | S016 | Human | Liver | HCC | 9.15e-07 | 3.11e-01 | 0.2243 |
| 283464 | GXYLT1 | S027 | Human | Liver | HCC | 7.54e-03 | 3.40e-01 | 0.2446 |
| 283464 | GXYLT1 | S028 | Human | Liver | HCC | 9.94e-05 | 3.09e-01 | 0.2503 |
| 283464 | GXYLT1 | S029 | Human | Liver | HCC | 9.78e-07 | 3.84e-01 | 0.2581 |
| 283464 | GXYLT1 | male-WTA | Human | Thyroid | PTC | 1.42e-19 | 2.30e-01 | 0.1037 |
| 283464 | GXYLT1 | PTC01 | Human | Thyroid | PTC | 8.61e-09 | 2.24e-01 | 0.1899 |
| 283464 | GXYLT1 | PTC04 | Human | Thyroid | PTC | 1.61e-13 | 3.02e-01 | 0.1927 |
| 283464 | GXYLT1 | PTC05 | Human | Thyroid | PTC | 4.59e-11 | 5.64e-01 | 0.2065 |
| 283464 | GXYLT1 | PTC06 | Human | Thyroid | PTC | 1.98e-33 | 8.52e-01 | 0.2057 |
| 283464 | GXYLT1 | PTC07 | Human | Thyroid | PTC | 2.41e-30 | 4.73e-01 | 0.2044 |
| 283464 | GXYLT1 | ATC09 | Human | Thyroid | ATC | 2.15e-07 | 3.06e-01 | 0.2871 |
| 283464 | GXYLT1 | ATC12 | Human | Thyroid | ATC | 3.91e-06 | 1.36e-01 | 0.34 |
| 283464 | GXYLT1 | ATC13 | Human | Thyroid | ATC | 1.25e-46 | 9.69e-01 | 0.34 |
| 283464 | GXYLT1 | ATC1 | Human | Thyroid | ATC | 5.17e-07 | 3.77e-01 | 0.2878 |
| Page: 1 2 |
| Tissue | Expression Dynamics | Abbreviation |
| Liver | 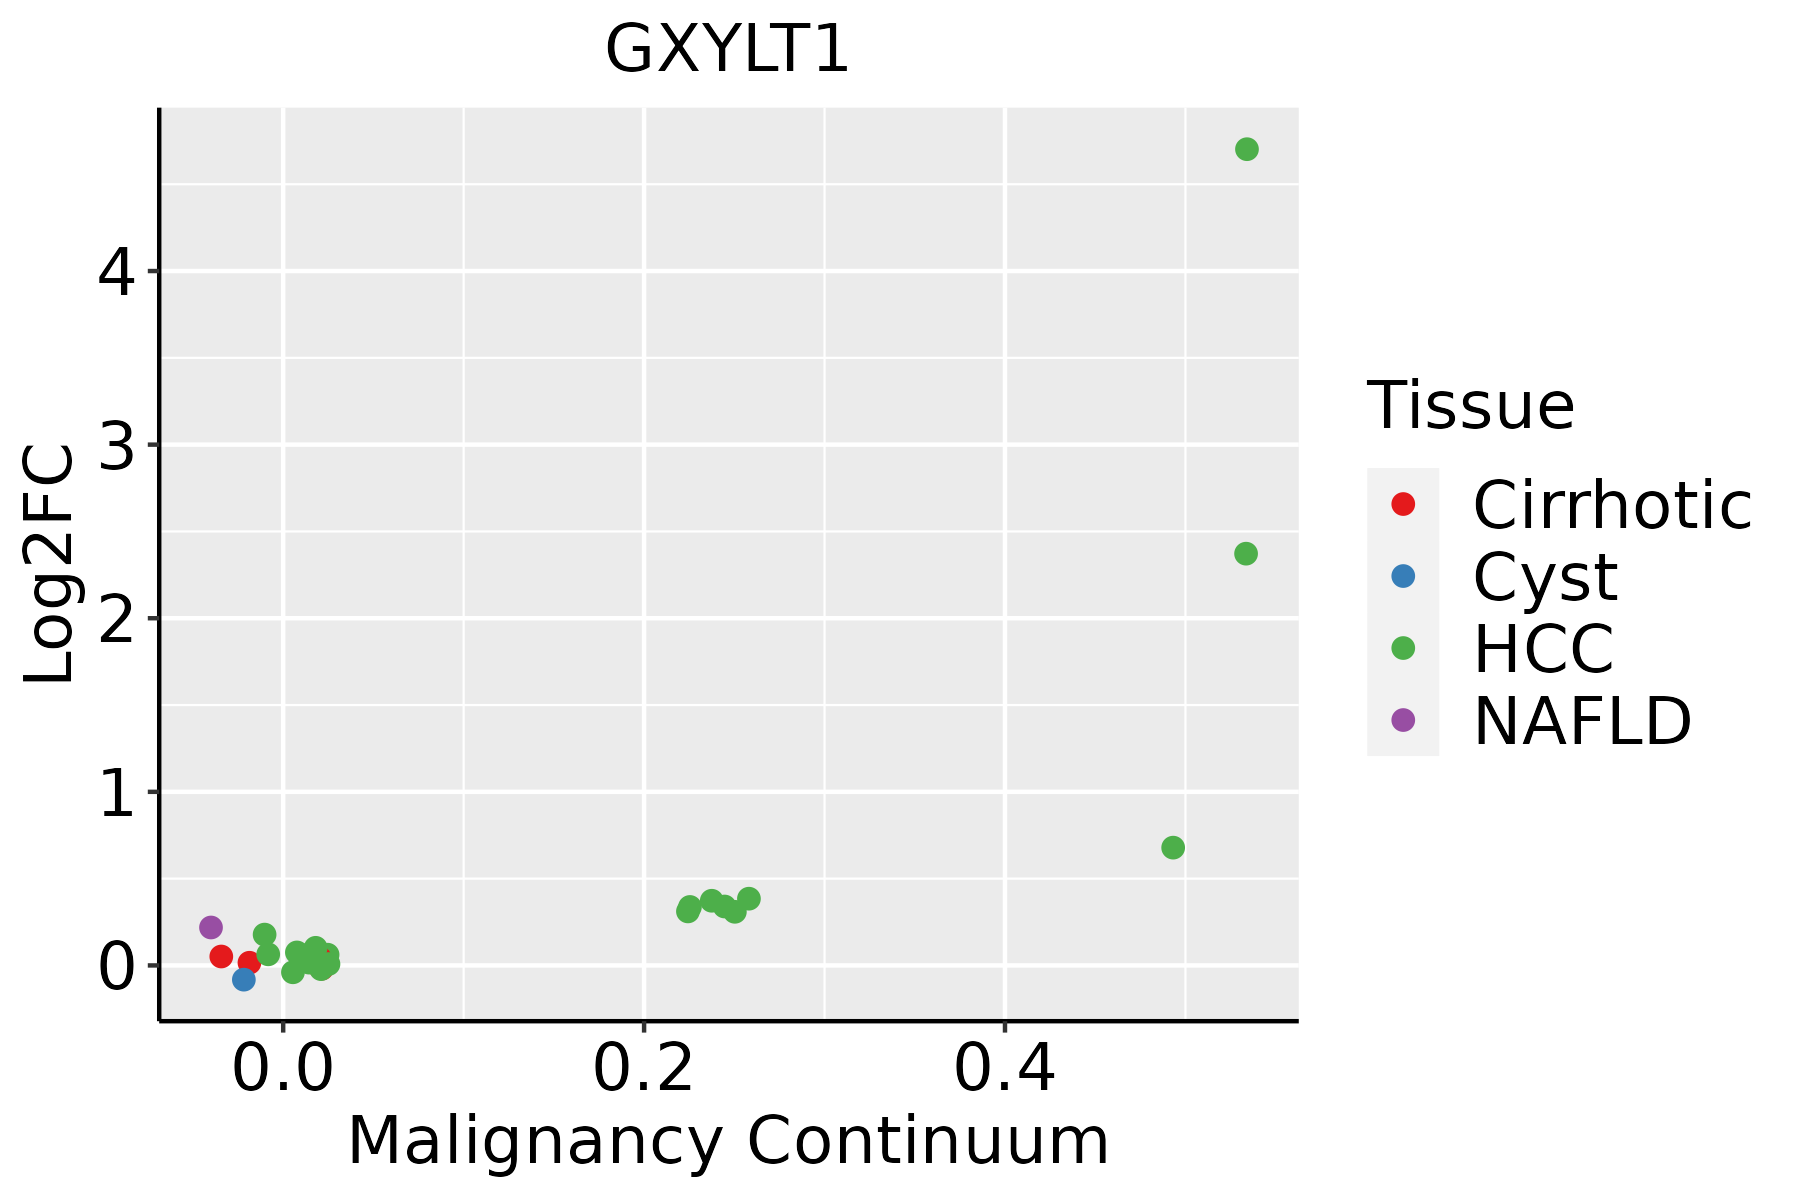 | HCC: Hepatocellular carcinoma |
| NAFLD: Non-alcoholic fatty liver disease | ||
| Thyroid |  | ATC: Anaplastic thyroid cancer |
| HT: Hashimoto's thyroiditis | ||
| PTC: Papillary thyroid cancer |
| ∗log2FC in expression of this searched gene in stem-like cells from each diseased tissue sample relative to stem-like cells in normal samples in each tissue plotted against the malignancy continuum. Samples are colored based on if they are from different disease stage. |
Top |
Malignant transformation related pathway analysis |
| Find out the enriched GO biological processes and KEGG pathways involved in transition from healthy to precancer to cancer |
| Tissue | Disease Stage | Enriched GO biological Processes |
| Colorectum | AD |  |
| Colorectum | SER |  |
| Colorectum | MSS |  |
| Colorectum | MSI-H |  |
| Colorectum | FAP |  |
| ∗Top 15 enriched GO BP terms are showed in the bar plot of each disease state in each tissue. Each row represents a significant GO biological process which is colored according to the -log10(p.adjust). |
| Page: 1 2 3 4 5 6 7 8 9 |
| GO ID | Tissue | Disease Stage | Description | Gene Ratio | Bg Ratio | pvalue | p.adjust | Count |
| GO:00064862 | Liver | HCC | protein glycosylation | 122/7958 | 226/18723 | 3.11e-04 | 2.21e-03 | 122 |
| GO:00434132 | Liver | HCC | macromolecule glycosylation | 122/7958 | 226/18723 | 3.11e-04 | 2.21e-03 | 122 |
| GO:00700852 | Liver | HCC | glycosylation | 128/7958 | 240/18723 | 4.35e-04 | 2.92e-03 | 128 |
| GO:0009100 | Liver | HCC | glycoprotein metabolic process | 193/7958 | 387/18723 | 1.89e-03 | 9.62e-03 | 193 |
| GO:00064866 | Thyroid | PTC | protein glycosylation | 94/5968 | 226/18723 | 1.25e-03 | 7.13e-03 | 94 |
| GO:00434136 | Thyroid | PTC | macromolecule glycosylation | 94/5968 | 226/18723 | 1.25e-03 | 7.13e-03 | 94 |
| GO:00700855 | Thyroid | PTC | glycosylation | 96/5968 | 240/18723 | 4.57e-03 | 2.15e-02 | 96 |
| GO:00091013 | Thyroid | PTC | glycoprotein biosynthetic process | 123/5968 | 317/18723 | 5.05e-03 | 2.33e-02 | 123 |
| GO:00091003 | Thyroid | PTC | glycoprotein metabolic process | 147/5968 | 387/18723 | 5.87e-03 | 2.64e-02 | 147 |
| GO:000648612 | Thyroid | ATC | protein glycosylation | 94/6293 | 226/18723 | 7.11e-03 | 2.82e-02 | 94 |
| GO:004341312 | Thyroid | ATC | macromolecule glycosylation | 94/6293 | 226/18723 | 7.11e-03 | 2.82e-02 | 94 |
| GO:000910011 | Thyroid | ATC | glycoprotein metabolic process | 153/6293 | 387/18723 | 7.90e-03 | 3.06e-02 | 153 |
| Page: 1 |
| Pathway ID | Tissue | Disease Stage | Description | Gene Ratio | Bg Ratio | pvalue | p.adjust | qvalue | Count |
| Page: 1 |
Top |
Cell-cell communication analysis |
| Identification of potential cell-cell interactions between two cell types and their ligand-receptor pairs for different disease states |
| Ligand | Receptor | LRpair | Pathway | Tissue | Disease Stage |
| Page: 1 |
Top |
Single-cell gene regulatory network inference analysis |
| Find out the significant the regulons (TFs) and the target genes of each regulon across cell types for different disease states |
| TF | Cell Type | Tissue | Disease Stage | Target Gene | RSS | Regulon Activity |
| ∗The dot plots of a searched regulon are shown for all cell subpopulations in each disease state of each tissue based on the regulon specific score inferred using pySCENIC and by calculating the average expression. |
| Page: 1 |
Top |
Somatic mutation of malignant transformation related genes |
| Annotation of somatic variants for genes involved in malignant transformation |
| Hugo Symbol | Variant Class | Variant Classification | dbSNP RS | HGVSc | HGVSp | HGVSp Short | SWISSPROT | BIOTYPE | SIFT | PolyPhen | Tumor Sample Barcode | Tissue | Histology | Sex | Age | Stage | Therapy Types | Drugs | Outcome |
| GXYLT1 | SNV | Missense_Mutation | novel | c.1117N>A | p.Asp373Asn | p.D373N | Q4G148 | protein_coding | tolerated(0.15) | benign(0.025) | TCGA-AN-A046-01 | Breast | breast invasive carcinoma | Female | >=65 | I/II | Unknown | Unknown | SD |
| GXYLT1 | SNV | Missense_Mutation | rs78536827 | c.770A>G | p.Asn257Ser | p.N257S | Q4G148 | protein_coding | tolerated(0.33) | benign(0.326) | TCGA-D8-A1X8-01 | Breast | breast invasive carcinoma | Female | <65 | III/IV | Chemotherapy | adrimicin+cyclophosphamide | SD |
| GXYLT1 | SNV | Missense_Mutation | c.961N>G | p.Leu321Val | p.L321V | Q4G148 | protein_coding | deleterious(0.02) | possibly_damaging(0.842) | TCGA-EW-A1OZ-01 | Breast | breast invasive carcinoma | Female | <65 | I/II | Targeted Molecular therapy | trastuzumab | SD | |
| GXYLT1 | insertion | Nonsense_Mutation | novel | c.884_885insGTTCTTCCCATAGGCTGCTTATAAGAGGAAAAATA | p.Leu296PhefsTer4 | p.L296Ffs*4 | Q4G148 | protein_coding | TCGA-A8-A07U-01 | Breast | breast invasive carcinoma | Female | >=65 | III/IV | Chemotherapy | 5-fluorouracil | SD | ||
| GXYLT1 | SNV | Missense_Mutation | c.842G>A | p.Arg281Gln | p.R281Q | Q4G148 | protein_coding | deleterious(0) | probably_damaging(1) | TCGA-C5-A1M8-01 | Cervix | cervical & endocervical cancer | Female | <65 | I/II | Unknown | Unknown | SD | |
| GXYLT1 | SNV | Missense_Mutation | novel | c.815N>G | p.Ser272Cys | p.S272C | Q4G148 | protein_coding | deleterious(0) | probably_damaging(0.997) | TCGA-C5-A8XI-01 | Cervix | cervical & endocervical cancer | Female | >=65 | I/II | Chemotherapy | cisplatin | SD |
| GXYLT1 | SNV | Missense_Mutation | c.562N>A | p.Glu188Lys | p.E188K | Q4G148 | protein_coding | tolerated(0.06) | benign(0.133) | TCGA-IR-A3LK-01 | Cervix | cervical & endocervical cancer | Female | >=65 | I/II | Chemotherapy | cisplatin | PD | |
| GXYLT1 | SNV | Missense_Mutation | c.242N>T | p.Cys81Phe | p.C81F | Q4G148 | protein_coding | tolerated(0.45) | benign(0.094) | TCGA-AU-6004-01 | Colorectum | colon adenocarcinoma | Female | >=65 | I/II | Unknown | Unknown | SD | |
| GXYLT1 | SNV | Missense_Mutation | c.1238A>G | p.Tyr413Cys | p.Y413C | Q4G148 | protein_coding | tolerated(0.07) | probably_damaging(0.912) | TCGA-CM-5861-01 | Colorectum | colon adenocarcinoma | Female | <65 | I/II | Unknown | Unknown | PD | |
| GXYLT1 | SNV | Missense_Mutation | c.276N>A | p.Asp92Glu | p.D92E | Q4G148 | protein_coding | tolerated(0.26) | benign(0.012) | TCGA-AG-A026-01 | Colorectum | rectum adenocarcinoma | Male | >=65 | I/II | Unknown | Unknown | PD |
| Page: 1 2 3 4 5 6 7 8 |
Top |
Related drugs of malignant transformation related genes |
| Identification of chemicals and drugs interact with genes involved in malignant transfromation |
| (DGIdb 4.0) |
| Entrez ID | Symbol | Category | Interaction Types | Drug Claim Name | Drug Name | PMIDs |
| Page: 1 |

Copyright 2023-Present -The University of Texas Health Science Center at Houston |