Schematic overview of the cellular and molecular mechanisms involved in the cancer progression, including the proposed cellular and molecular mechanisms in cancer cells trajectory. AT1: alveolar type 1 cells; AT2: alveolar type 2 cells; AAH: atypical adenomatous hyperplasia; AIS: adenocarcinoma in situ; MIA: minimally invasive adenocarcinoma; IA: invasive adenocarcinoma; EMT: epithelial-mesenchymal transition

Home

Download

Statistics

Help

Contact

Center for Computational Systems Medicine
leaf

Gene summary

leaf

Malignant transformation analysis

leaf

Malignant transformation related pathway analysis

leaf

Cell-cell communication analysis

leaf

Single-cell gene regulatory network inference analysis

leaf

Somatic mutation of malignant transformation related genes

leaf

Related drugs of malignant transformation related genes

Gene: GUK1

Gene summary for GUK1

check button Gene summary.

Gene informationSpeciesHuman
Gene symbol

GUK1

Gene ID

2987

Gene nameguanylate kinase 1
Gene AliasGMK
Cytomap1q42.13
Gene Typeprotein-coding
GO ID

GO:0006139

UniProtAcc

Q16774


Top

Malignant transformation analysis

check button Identification of the aberrant gene expression in precancerous and cancerous lesions by comparing the gene expression of stem-like cells in diseased tissues with normal stem cells
check button Malignant transformation involving gene list.
Entrez IDSymbolReplicatesSpeciesOrganTissueAdj P-valueLog2FCMalignancy
2987GUK1GSM4909281HumanBreastIDC1.58e-375.31e-010.21
2987GUK1GSM4909282HumanBreastIDC3.75e-032.25e-01-0.0288
2987GUK1GSM4909286HumanBreastIDC1.62e-093.02e-010.1081
2987GUK1GSM4909287HumanBreastIDC3.32e-082.91e-010.2057
2987GUK1GSM4909288HumanBreastIDC8.12e-062.18e-010.0988
2987GUK1GSM4909289HumanBreastIDC2.39e-024.20e-010.1064
2987GUK1GSM4909290HumanBreastIDC3.52e-235.61e-010.2096
2987GUK1GSM4909291HumanBreastIDC1.62e-094.20e-010.1753
2987GUK1GSM4909293HumanBreastIDC1.42e-052.93e-010.1581
2987GUK1GSM4909294HumanBreastIDC4.34e-334.18e-010.2022
2987GUK1GSM4909296HumanBreastIDC2.28e-332.35e-010.1524
2987GUK1GSM4909297HumanBreastIDC2.89e-31-3.62e-010.1517
2987GUK1GSM4909301HumanBreastIDC1.54e-071.27e-010.1577
2987GUK1GSM4909302HumanBreastIDC8.09e-163.33e-010.1545
2987GUK1GSM4909304HumanBreastIDC6.97e-163.63e-010.1636
2987GUK1GSM4909306HumanBreastIDC3.62e-405.76e-010.1564
2987GUK1GSM4909307HumanBreastIDC3.86e-253.97e-010.1569
2987GUK1GSM4909308HumanBreastIDC1.01e-174.62e-010.158
2987GUK1GSM4909311HumanBreastIDC5.52e-57-3.43e-010.1534
2987GUK1GSM4909312HumanBreastIDC1.08e-228.54e-030.1552
Page: 1 2 3 4 5 6 7 8 9 10 11 12 13 14 15 

check button Transcriptomic changes along malignancy continuum.
TissueExpression DynamicsAbbreviation
BreastThe image shows the transcriptomic changes along malignancy continuum.log2FC in expression of this searched gene in stem-like cells from each diseased tissue sample relative to stem-like cells in normal samples in each tissue plotted against the malignancy continuum. Samples are colored based on if they are from different disease stage.
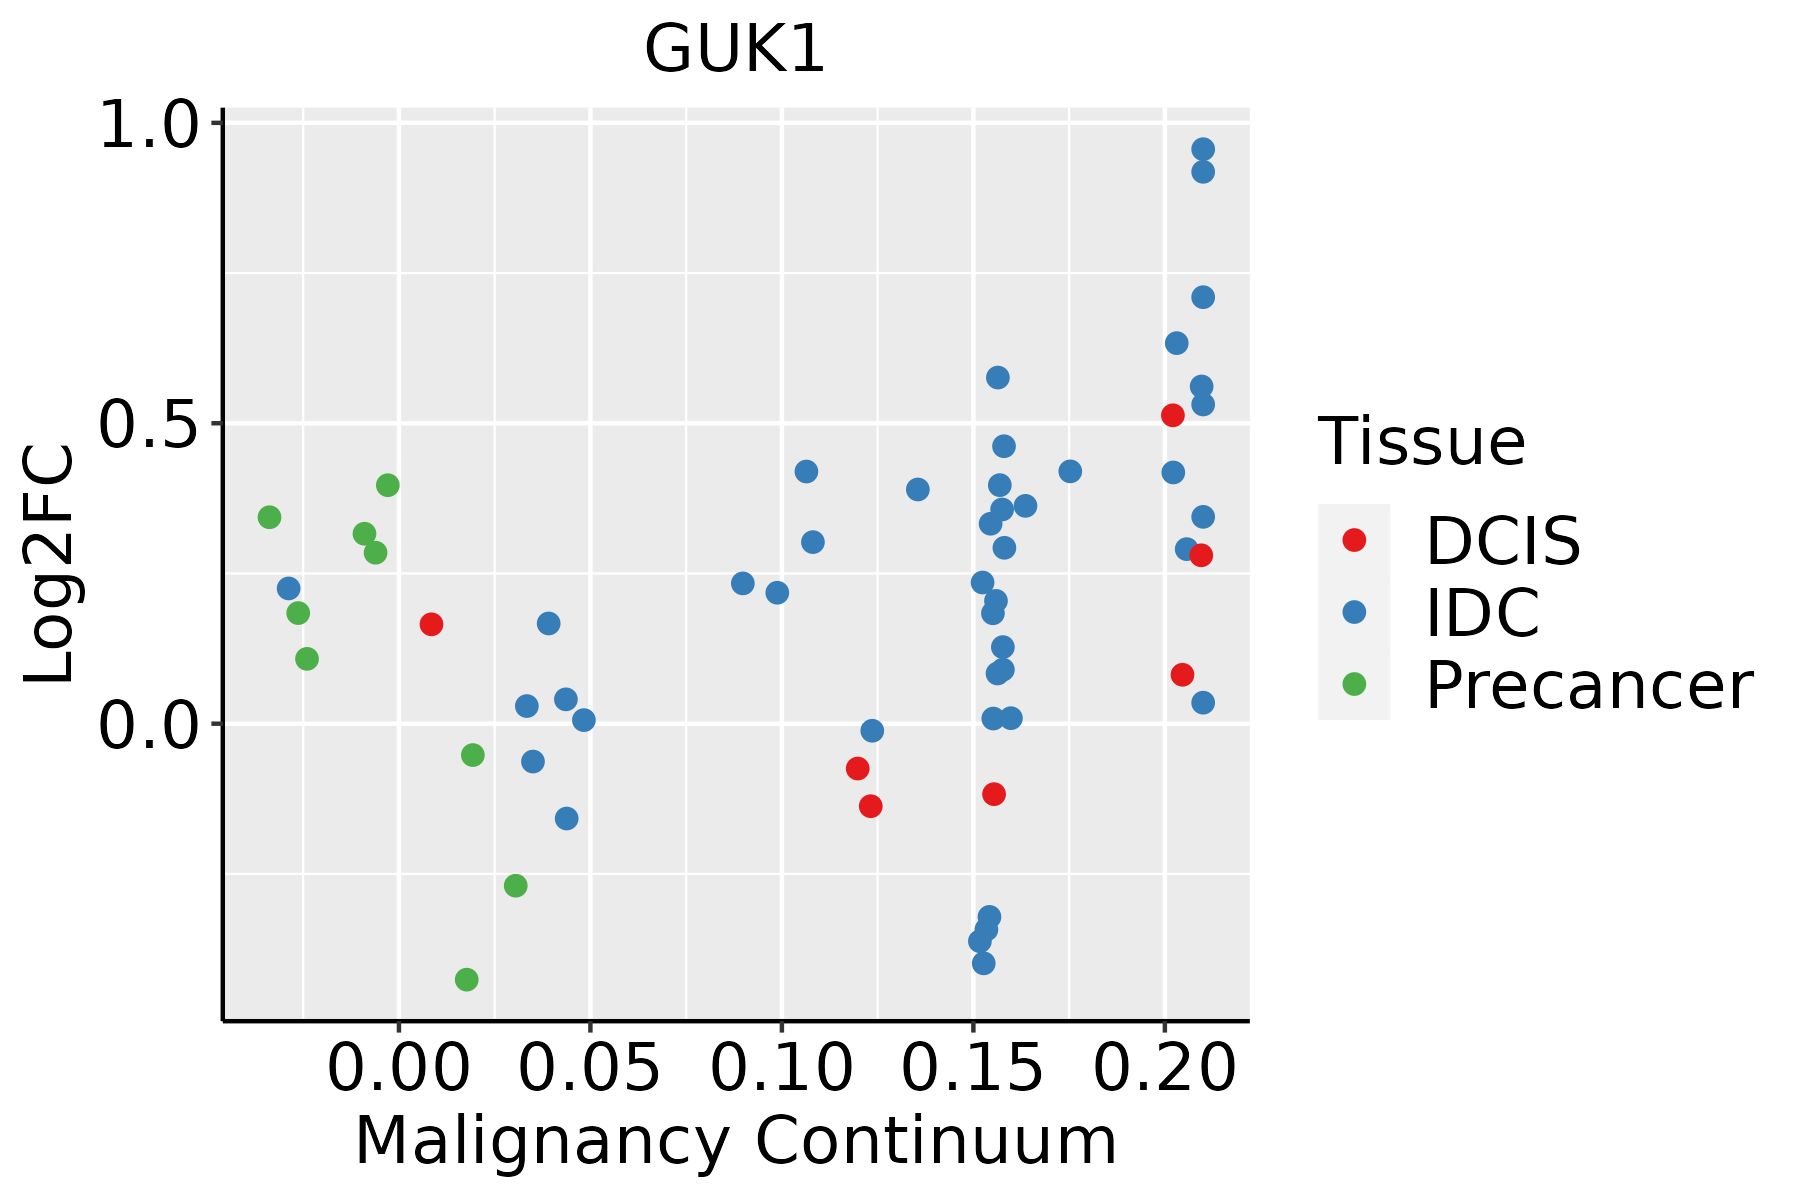
IDC: Invasive ductal carcinoma
DCIS: Ductal carcinoma in situ
Precancer(BRCA1-mut): Precancerous lesion from BRCA1 mutation carriers
CervixThe image shows the transcriptomic changes along malignancy continuum.log2FC in expression of this searched gene in stem-like cells from each diseased tissue sample relative to stem-like cells in normal samples in each tissue plotted against the malignancy continuum. Samples are colored based on if they are from different disease stage.CC: Cervix cancer
HSIL_HPV: HPV-infected high-grade squamous intraepithelial lesions
N_HPV: HPV-infected normal cervix
Colorectum (GSE201348)The image shows the transcriptomic changes along malignancy continuum.log2FC in expression of this searched gene in stem-like cells from each diseased tissue sample relative to stem-like cells in normal samples in each tissue plotted against the malignancy continuum. Samples are colored based on if they are from different disease stage.FAP: Familial adenomatous polyposis
CRC: Colorectal cancer
Colorectum (HTA11)The image shows the transcriptomic changes along malignancy continuum.log2FC in expression of this searched gene in stem-like cells from each diseased tissue sample relative to stem-like cells in normal samples in each tissue plotted against the malignancy continuum. Samples are colored based on if they are from different disease stage.AD: Adenomas
SER: Sessile serrated lesions
MSI-H: Microsatellite-high colorectal cancer
MSS: Microsatellite stable colorectal cancer
EndometriumThe image shows the transcriptomic changes along malignancy continuum.log2FC in expression of this searched gene in stem-like cells from each diseased tissue sample relative to stem-like cells in normal samples in each tissue plotted against the malignancy continuum. Samples are colored based on if they are from different disease stage.AEH: Atypical endometrial hyperplasia
EEC: Endometrioid Cancer
EsophagusThe image shows the transcriptomic changes along malignancy continuum.log2FC in expression of this searched gene in stem-like cells from each diseased tissue sample relative to stem-like cells in normal samples in each tissue plotted against the malignancy continuum. Samples are colored based on if they are from different disease stage.
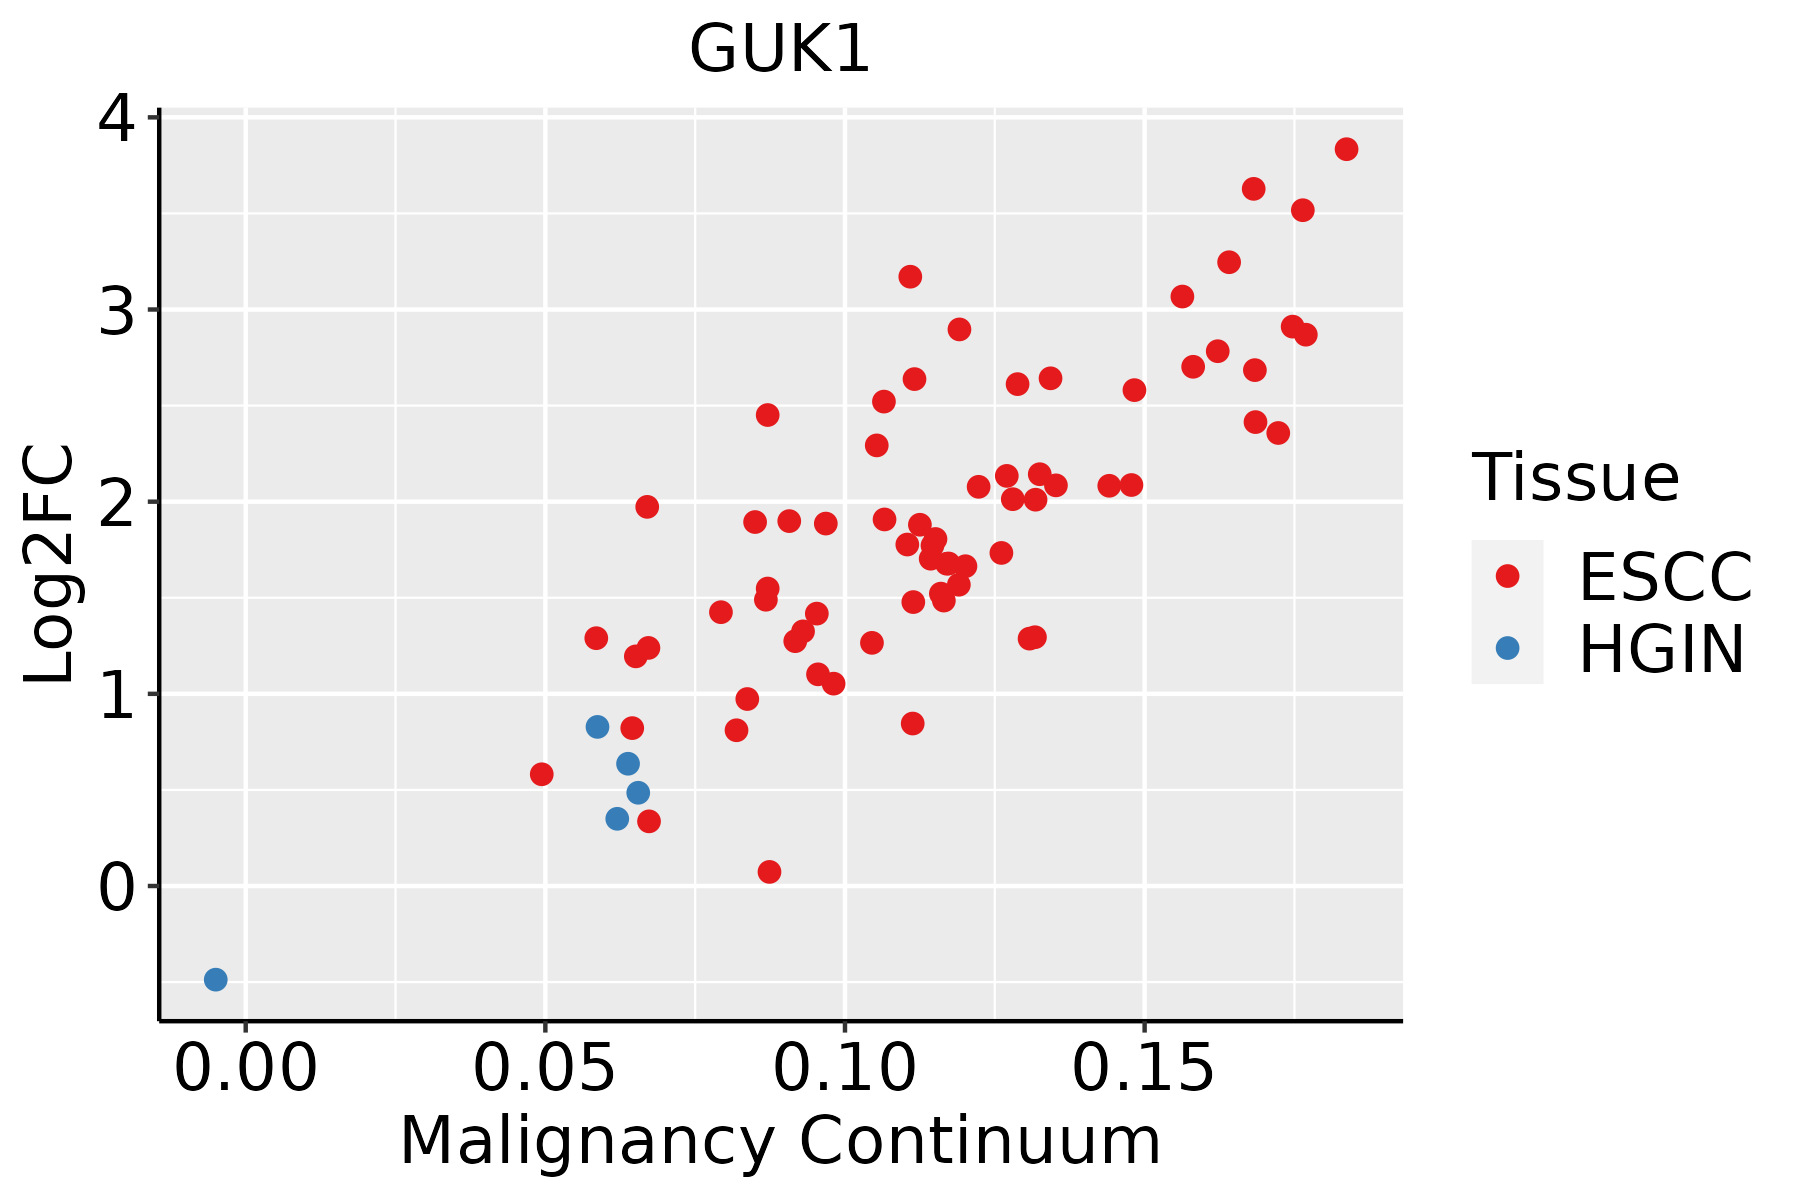
ESCC: Esophageal squamous cell carcinoma
HGIN: High-grade intraepithelial neoplasias
LGIN: Low-grade intraepithelial neoplasias
GCThe image shows the transcriptomic changes along malignancy continuum.log2FC in expression of this searched gene in stem-like cells from each diseased tissue sample relative to stem-like cells in normal samples in each tissue plotted against the malignancy continuum. Samples are colored based on if they are from different disease stage.
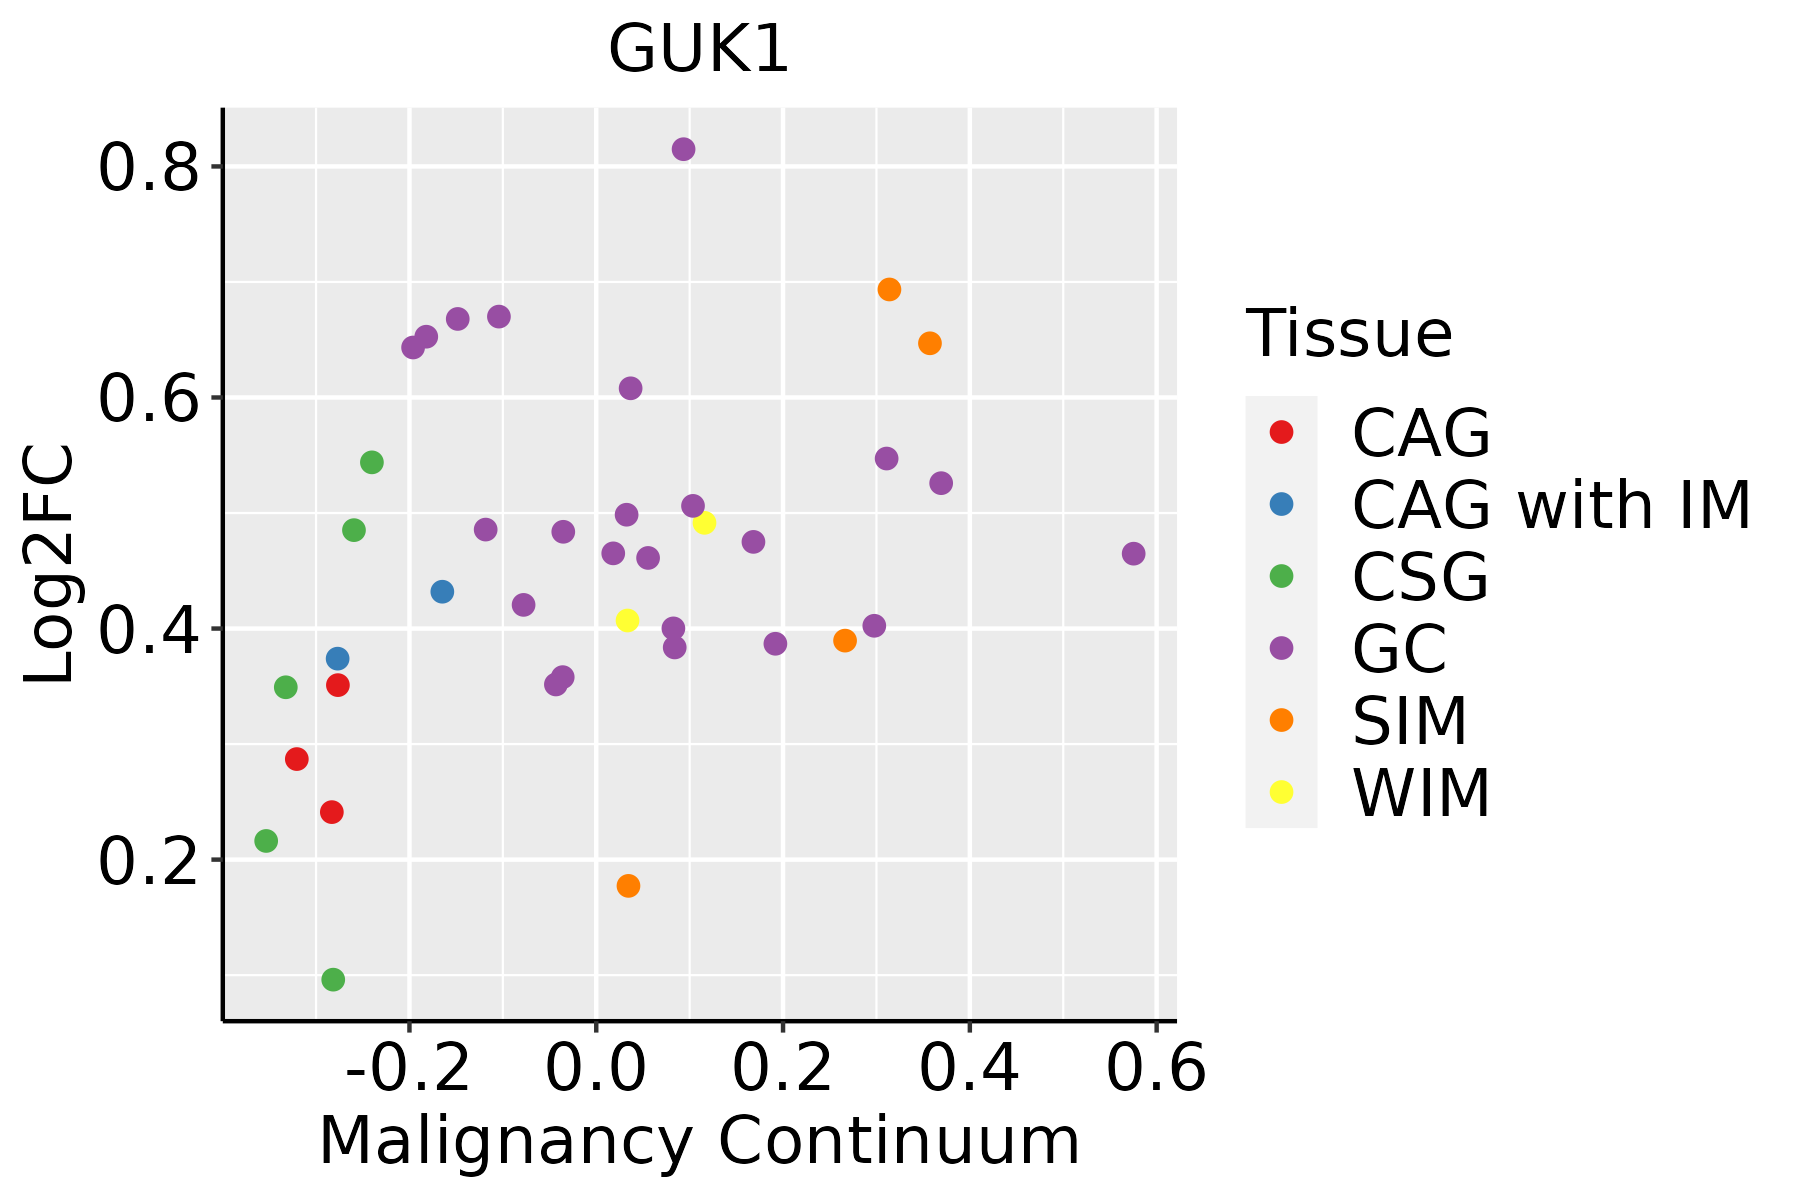
CAG: Chronic atrophic gastritis
CAG with IM: Chronic atrophic gastritis with intestinal metaplasia
CSG: Chronic superficial gastritis
GC: Gastric cancer
SIM: Severe intestinal metaplasia
WIM: Wild intestinal metaplasia
LiverThe image shows the transcriptomic changes along malignancy continuum.log2FC in expression of this searched gene in stem-like cells from each diseased tissue sample relative to stem-like cells in normal samples in each tissue plotted against the malignancy continuum. Samples are colored based on if they are from different disease stage.HCC: Hepatocellular carcinoma
NAFLD: Non-alcoholic fatty liver disease
Oral CavityThe image shows the transcriptomic changes along malignancy continuum.log2FC in expression of this searched gene in stem-like cells from each diseased tissue sample relative to stem-like cells in normal samples in each tissue plotted against the malignancy continuum. Samples are colored based on if they are from different disease stage.
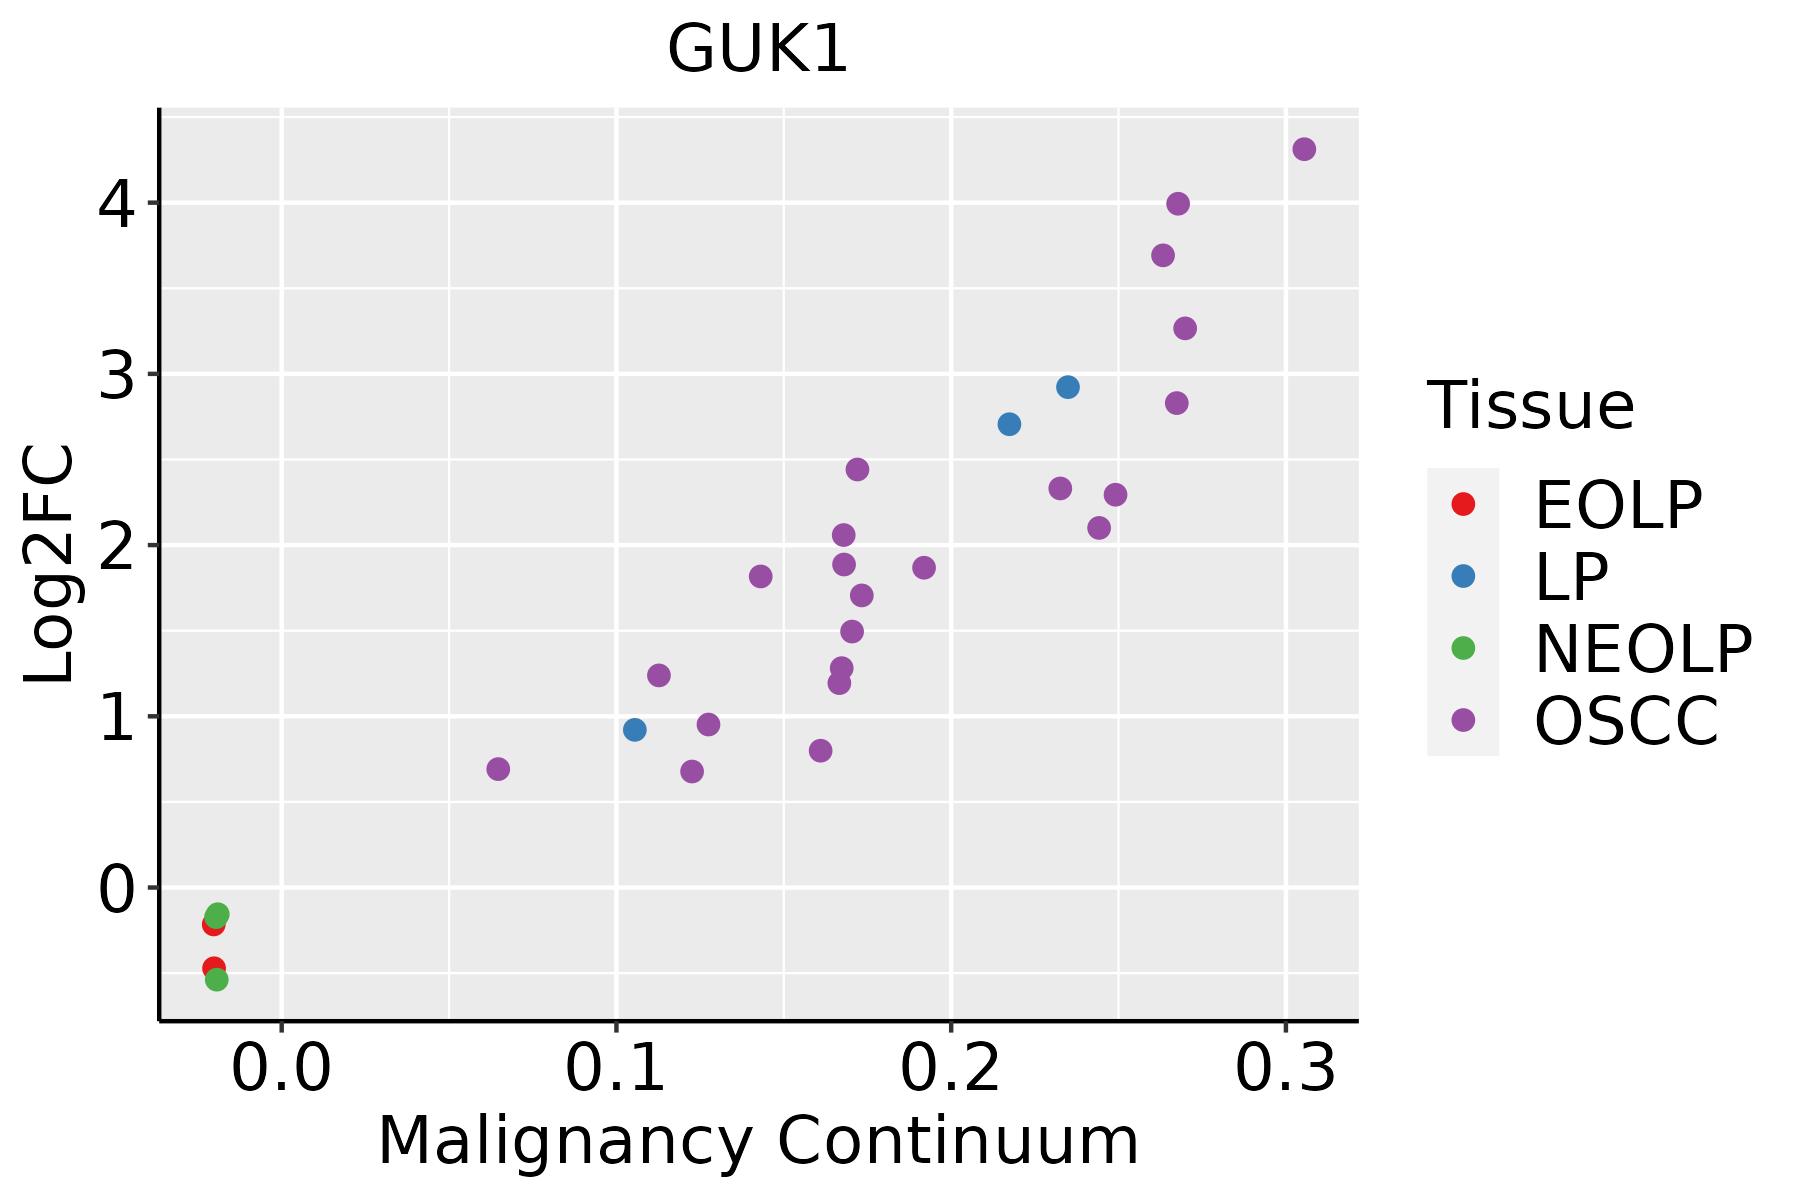
EOLP: Erosive Oral lichen planus
LP: leukoplakia
NEOLP: Non-erosive oral lichen planus
OSCC: Oral squamous cell carcinoma
ProstateThe image shows the transcriptomic changes along malignancy continuum.log2FC in expression of this searched gene in stem-like cells from each diseased tissue sample relative to stem-like cells in normal samples in each tissue plotted against the malignancy continuum. Samples are colored based on if they are from different disease stage.
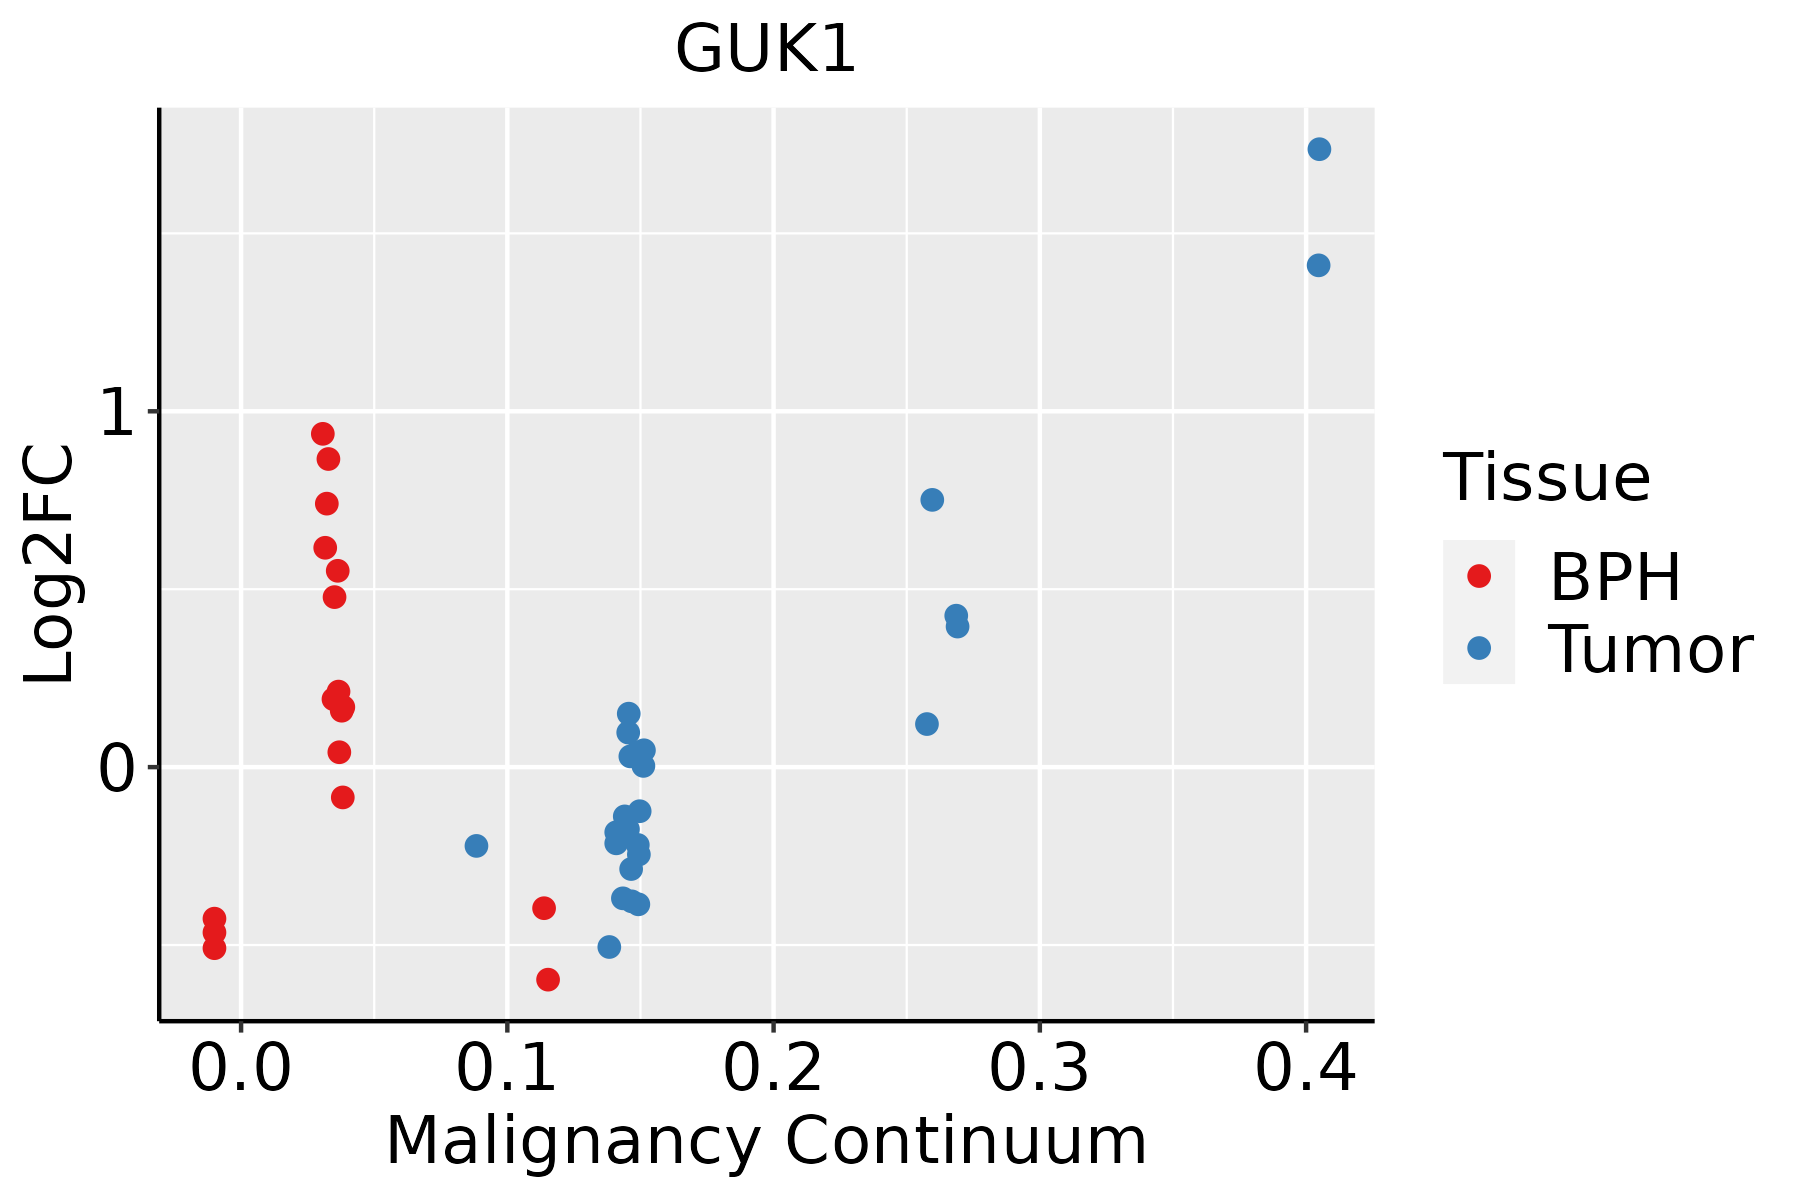
BPH: Benign Prostatic Hyperplasia
SkinThe image shows the transcriptomic changes along malignancy continuum.log2FC in expression of this searched gene in stem-like cells from each diseased tissue sample relative to stem-like cells in normal samples in each tissue plotted against the malignancy continuum. Samples are colored based on if they are from different disease stage.AK: Actinic keratosis
cSCC: Cutaneous squamous cell carcinoma
SCCIS:squamous cell carcinoma in situ
ThyroidThe image shows the transcriptomic changes along malignancy continuum.log2FC in expression of this searched gene in stem-like cells from each diseased tissue sample relative to stem-like cells in normal samples in each tissue plotted against the malignancy continuum. Samples are colored based on if they are from different disease stage.
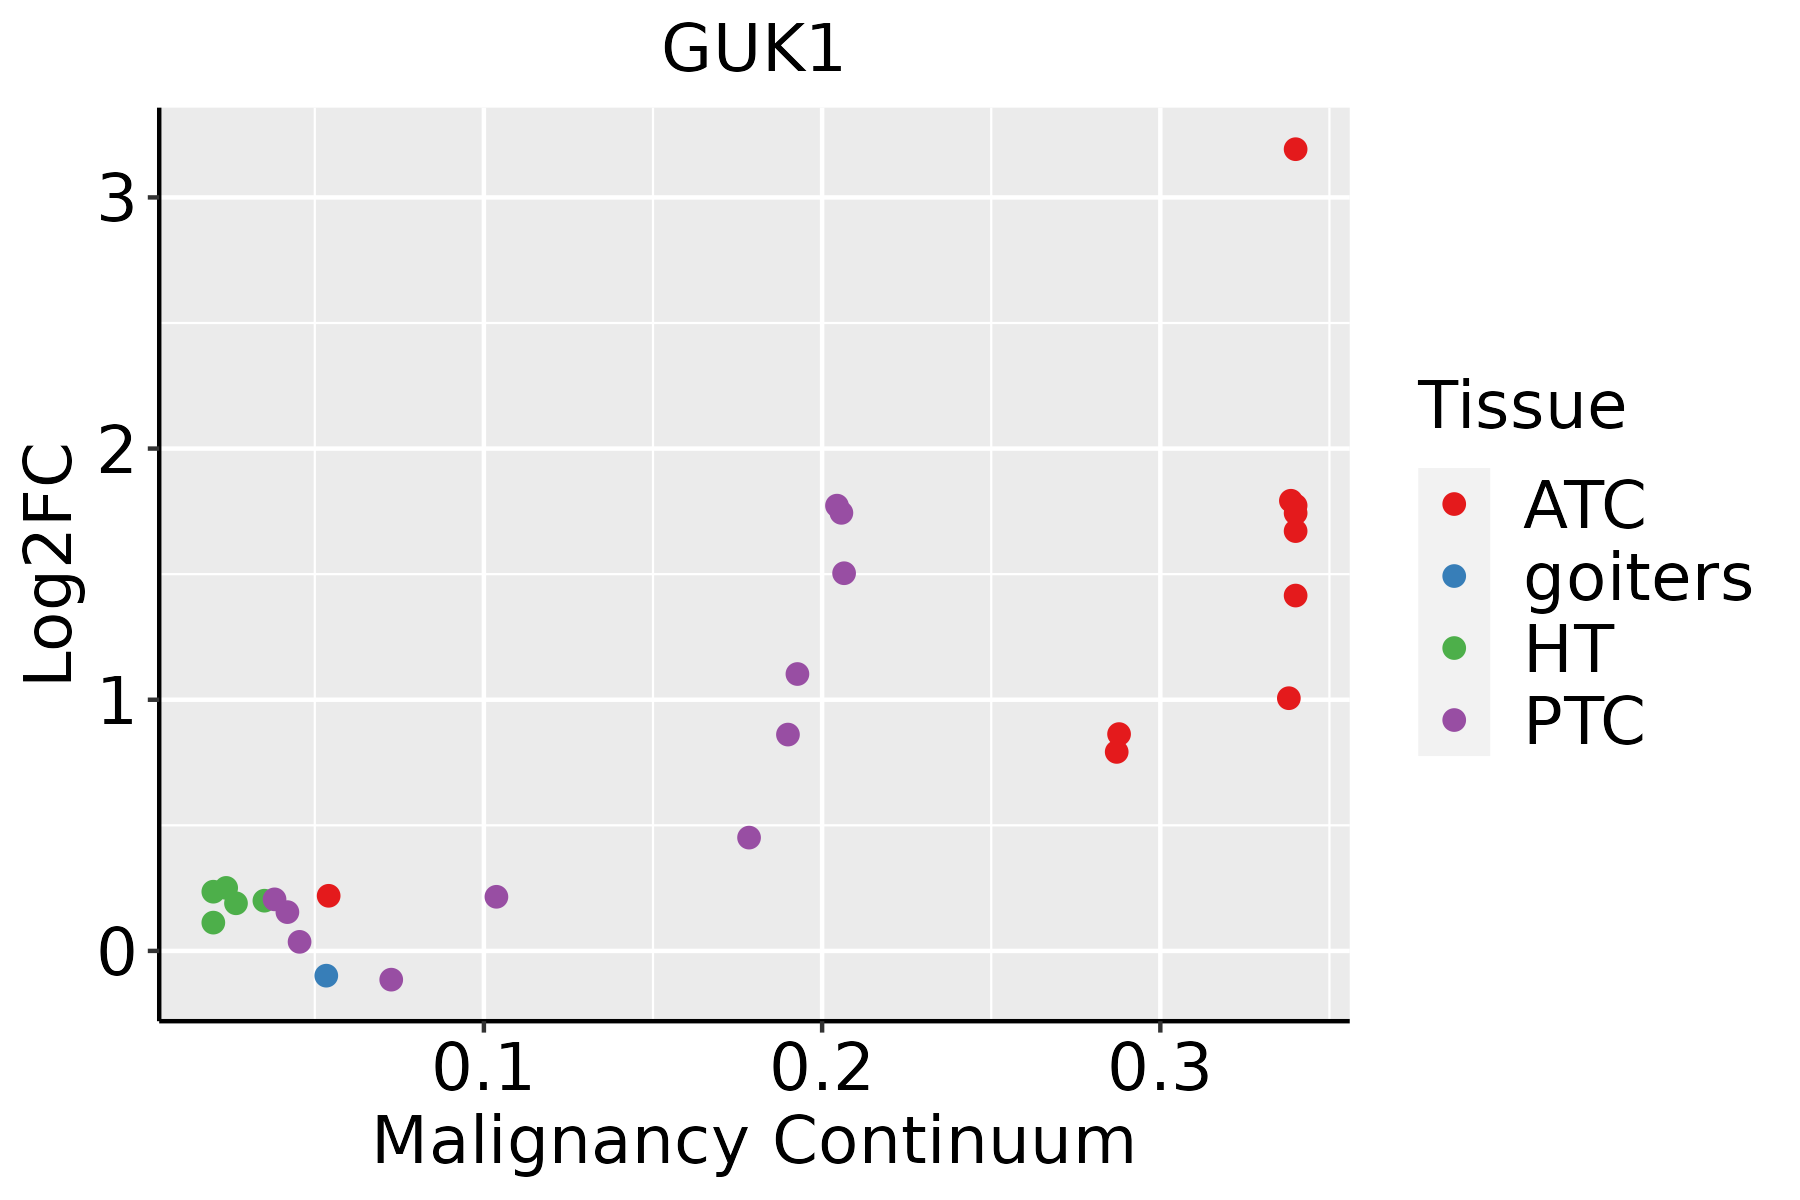
ATC: Anaplastic thyroid cancer
HT: Hashimoto's thyroiditis
PTC: Papillary thyroid cancer
∗log2FC in expression of this searched gene in stem-like cells from each diseased tissue sample relative to stem-like cells in normal samples in each tissue plotted against the malignancy continuum. Samples are colored based on if they are from different disease stage.

Top

Malignant transformation related pathway analysis

check buttonFind out the enriched GO biological processes and KEGG pathways involved in transition from healthy to precancer to cancer
check button Figure of enriched GO biological processes.
TissueDisease StageEnriched GO biological Processes
ColorectumADGO analysis - Figure of enriched GO biological processes: Top 15 enriched GO BP terms are showed in the bar plot of each disease state in each tissue. Each row represents a significant GO biological process which is colored according to the -log10(p.adjust).
ColorectumSERGO analysis - Figure of enriched GO biological processes: Top 15 enriched GO BP terms are showed in the bar plot of each disease state in each tissue. Each row represents a significant GO biological process which is colored according to the -log10(p.adjust).
ColorectumMSSGO analysis - Figure of enriched GO biological processes: Top 15 enriched GO BP terms are showed in the bar plot of each disease state in each tissue. Each row represents a significant GO biological process which is colored according to the -log10(p.adjust).
ColorectumMSI-HGO analysis - Figure of enriched GO biological processes: Top 15 enriched GO BP terms are showed in the bar plot of each disease state in each tissue. Each row represents a significant GO biological process which is colored according to the -log10(p.adjust).
ColorectumFAPGO analysis - Figure of enriched GO biological processes: Top 15 enriched GO BP terms are showed in the bar plot of each disease state in each tissue. Each row represents a significant GO biological process which is colored according to the -log10(p.adjust).
∗Top 15 enriched GO BP terms are showed in the bar plot of each disease state in each tissue. Each row represents a significant GO biological process which is colored according to the -log10(p.adjust).
Page: 1 2 3 4 5 6 7 8 9 

check button Enriched GO biological processes.
GO IDTissueDisease StageDescriptionGene RatioBg Ratiopvaluep.adjustCount
GO:00460349BreastPrecancerATP metabolic process82/1080277/187231.94e-365.19e-3382
GO:00091448BreastPrecancerpurine nucleoside triphosphate metabolic process24/108088/187239.66e-111.03e-0824
GO:00091418BreastPrecancernucleoside triphosphate metabolic process26/1080112/187237.72e-106.66e-0826
GO:00196938BreastPrecancerribose phosphate metabolic process49/1080396/187233.81e-071.78e-0549
GO:00091528BreastPrecancerpurine ribonucleotide biosynthetic process28/1080169/187234.17e-071.89e-0528
GO:00463907BreastPrecancerribose phosphate biosynthetic process30/1080190/187234.75e-072.11e-0530
GO:00092607BreastPrecancerribonucleotide biosynthetic process29/1080182/187236.05e-072.55e-0529
GO:00091509BreastPrecancerpurine ribonucleotide metabolic process46/1080368/187236.47e-072.71e-0546
GO:00091179BreastPrecancernucleotide metabolic process56/1080489/187237.40e-073.00e-0556
GO:00092598BreastPrecancerribonucleotide metabolic process47/1080385/187239.69e-073.84e-0547
GO:00469398BreastPrecancernucleotide phosphorylation20/1080101/187231.07e-064.18e-0520
GO:00067539BreastPrecancernucleoside phosphate metabolic process56/1080497/187231.24e-064.70e-0556
GO:00061639BreastPrecancerpurine nucleotide metabolic process47/1080396/187232.14e-067.50e-0547
GO:00091858BreastPrecancerribonucleoside diphosphate metabolic process20/1080106/187232.37e-068.17e-0520
GO:00061647BreastPrecancerpurine nucleotide biosynthetic process28/1080191/187235.04e-061.52e-0428
GO:00091328BreastPrecancernucleoside diphosphate metabolic process21/1080124/187237.98e-062.17e-0421
GO:00725219BreastPrecancerpurine-containing compound metabolic process47/1080416/187238.19e-062.20e-0447
GO:00725227BreastPrecancerpurine-containing compound biosynthetic process28/1080200/187231.23e-053.17e-0428
GO:00091359BreastPrecancerpurine nucleoside diphosphate metabolic process18/1080103/187232.24e-055.20e-0418
GO:00091799BreastPrecancerpurine ribonucleoside diphosphate metabolic process18/1080103/187232.24e-055.20e-0418
Page: 1 2 3 4 5 6 7 8 9 10 11 12 13 14 15 16 17 18 19 20 21 22 23 24 25 26 27 28 29 30 31 32 33 34 35 36 

check button Enriched KEGG pathways.
Pathway IDTissueDisease StageDescriptionGene RatioBg Ratiopvaluep.adjustqvalueCount
hsa012325EsophagusESCCNucleotide metabolism59/420585/84651.67e-046.58e-043.37e-0459
hsa0123212EsophagusESCCNucleotide metabolism59/420585/84651.67e-046.58e-043.37e-0459
hsa01232LiverCirrhoticNucleotide metabolism39/253085/84651.27e-036.73e-034.15e-0339
hsa012321LiverCirrhoticNucleotide metabolism39/253085/84651.27e-036.73e-034.15e-0339
hsa012322LiverHCCNucleotide metabolism59/402085/84653.30e-051.88e-041.04e-0459
hsa012323LiverHCCNucleotide metabolism59/402085/84653.30e-051.88e-041.04e-0459
hsa012324Oral cavityOSCCNucleotide metabolism54/370485/84651.78e-045.95e-043.03e-0454
hsa0123211Oral cavityOSCCNucleotide metabolism54/370485/84651.78e-045.95e-043.03e-0454
hsa0123221Oral cavityLPNucleotide metabolism42/241885/84653.62e-052.36e-041.52e-0442
hsa0123231Oral cavityLPNucleotide metabolism42/241885/84653.62e-052.36e-041.52e-0442
Page: 1 

Top

Cell-cell communication analysis

check buttonIdentification of potential cell-cell interactions between two cell types and their ligand-receptor pairs for different disease states
LigandReceptorLRpairPathwayTissueDisease Stage
Page: 1 

Top

Single-cell gene regulatory network inference analysis

check buttonFind out the significant the regulons (TFs) and the target genes of each regulon across cell types for different disease states
TFCell TypeTissueDisease StageTarget GeneRSSRegulon Activity
∗The dot plots of a searched regulon are shown for all cell subpopulations in each disease state of each tissue based on the regulon specific score inferred using pySCENIC and by calculating the average expression.
Page: 1 

Top

Somatic mutation of malignant transformation related genes

check buttonAnnotation of somatic variants for genes involved in malignant transformation
Hugo SymbolVariant ClassVariant ClassificationdbSNP RSHGVScHGVSpHGVSp ShortSWISSPROTBIOTYPESIFTPolyPhenTumor Sample BarcodeTissueHistologySexAgeStageTherapy TypesDrugsOutcome
GUK1SNVMissense_Mutationc.417C>Gp.Ile139Metp.I139MQ16774protein_codingdeleterious(0.04)benign(0.301)TCGA-AC-A23H-01Breastbreast invasive carcinomaFemale>=65I/IIUnknownUnknownPD
GUK1insertionFrame_Shift_Insnovelc.606_607insCAGGACCAGGGCAGCAGp.Ile209ArgfsTer66p.I209Rfs*66Q16774protein_codingTCGA-OL-A6VO-01Breastbreast invasive carcinomaFemale<65I/IIChemotherapytaxotereCR
GUK1SNVMissense_Mutationrs752446312c.350N>Ap.Arg117Hisp.R117HQ16774protein_codingdeleterious(0)probably_damaging(0.946)TCGA-A5-A7WJ-01Endometriumuterine corpus endometrioid carcinomaFemale<65I/IIUnknownUnknownSD
GUK1SNVMissense_Mutationc.565N>Tp.Arg189Cysp.R189CQ16774protein_codingtolerated_low_confidence(0.29)benign(0.118)TCGA-AP-A0LM-01Endometriumuterine corpus endometrioid carcinomaFemale<65III/IVChemotherapycisplatinSD
GUK1SNVMissense_Mutationc.340N>Ap.Ala114Thrp.A114TQ16774protein_codingtolerated(0.17)benign(0.062)TCGA-AX-A05S-01Endometriumuterine corpus endometrioid carcinomaFemale>=65III/IVUnspecificCarboplatin & PaclitaxelPD
GUK1SNVMissense_Mutationrs575750582c.311C>Tp.Thr104Metp.T104MQ16774protein_codingdeleterious(0)probably_damaging(1)TCGA-B5-A3FC-01Endometriumuterine corpus endometrioid carcinomaFemale<65I/IIUnknownUnknownSD
GUK1SNVMissense_Mutationc.652N>Tp.Arg218Trpp.R218WQ16774protein_codingtolerated_low_confidence(0.14)possibly_damaging(0.685)TCGA-BG-A0M7-01Endometriumuterine corpus endometrioid carcinomaFemale<65III/IVChemotherapycarboplatinSD
GUK1SNVMissense_Mutationrs770258206c.257N>Cp.Ile86Thrp.I86TQ16774protein_codingdeleterious(0)probably_damaging(0.967)TCGA-BG-A220-01Endometriumuterine corpus endometrioid carcinomaFemale>=65I/IIUnknownUnknownSD
GUK1SNVMissense_Mutationc.286N>Ap.Glu96Lysp.E96KQ16774protein_codingtolerated(0.07)benign(0.122)TCGA-D1-A103-01Endometriumuterine corpus endometrioid carcinomaFemale>=65I/IIUnknownUnknownSD
GUK1SNVMissense_Mutationrs752446312c.350N>Ap.Arg117Hisp.R117HQ16774protein_codingdeleterious(0)probably_damaging(0.946)TCGA-DF-A2KU-01Endometriumuterine corpus endometrioid carcinomaFemaleUnknownI/IIUnknownUnknownSD
Page: 1 2 3 

Top

Related drugs of malignant transformation related genes

check buttonIdentification of chemicals and drugs interact with genes involved in malignant transfromation
(DGIdb 4.0)
Entrez IDSymbolCategoryInteraction TypesDrug Claim NameDrug NamePMIDs
Page: 1