
|
|||||
|
 | |
| |
| |
| |
| |
| |
|
Gene: GUF1 |
Gene summary for GUF1 |
| Gene information | Species | Human | Gene symbol | GUF1 | Gene ID | 60558 |
| Gene name | GTP binding elongation factor GUF1 | |
| Gene Alias | DEE40 | |
| Cytomap | 4p12 | |
| Gene Type | protein-coding | GO ID | GO:0006412 | UniProtAcc | A0A024R9T3 |
Top |
Malignant transformation analysis |
| Identification of the aberrant gene expression in precancerous and cancerous lesions by comparing the gene expression of stem-like cells in diseased tissues with normal stem cells |
| Entrez ID | Symbol | Replicates | Species | Organ | Tissue | Adj P-value | Log2FC | Malignancy |
| 60558 | GUF1 | HCC1_Meng | Human | Liver | HCC | 1.54e-38 | 1.05e-01 | 0.0246 |
| 60558 | GUF1 | HCC2_Meng | Human | Liver | HCC | 2.12e-09 | 6.50e-02 | 0.0107 |
| 60558 | GUF1 | HCC1 | Human | Liver | HCC | 6.19e-04 | 2.79e+00 | 0.5336 |
| 60558 | GUF1 | HCC2 | Human | Liver | HCC | 1.86e-14 | 4.01e+00 | 0.5341 |
| 60558 | GUF1 | S015 | Human | Liver | HCC | 8.93e-07 | 3.49e-01 | 0.2375 |
| 60558 | GUF1 | S016 | Human | Liver | HCC | 1.48e-03 | 1.70e-01 | 0.2243 |
| 60558 | GUF1 | S028 | Human | Liver | HCC | 1.19e-09 | 3.84e-01 | 0.2503 |
| 60558 | GUF1 | S029 | Human | Liver | HCC | 5.94e-07 | 3.09e-01 | 0.2581 |
| 60558 | GUF1 | C04 | Human | Oral cavity | OSCC | 4.94e-08 | 5.56e-01 | 0.2633 |
| 60558 | GUF1 | C21 | Human | Oral cavity | OSCC | 1.93e-27 | 7.89e-01 | 0.2678 |
| 60558 | GUF1 | C30 | Human | Oral cavity | OSCC | 1.10e-10 | 6.90e-01 | 0.3055 |
| 60558 | GUF1 | C46 | Human | Oral cavity | OSCC | 5.43e-07 | 2.21e-01 | 0.1673 |
| 60558 | GUF1 | C51 | Human | Oral cavity | OSCC | 2.91e-02 | 2.71e-01 | 0.2674 |
| 60558 | GUF1 | C57 | Human | Oral cavity | OSCC | 7.08e-04 | 2.19e-01 | 0.1679 |
| 60558 | GUF1 | LN22 | Human | Oral cavity | OSCC | 2.33e-04 | 7.73e-01 | 0.1733 |
| 60558 | GUF1 | SYSMH1 | Human | Oral cavity | OSCC | 8.98e-05 | 1.98e-01 | 0.1127 |
| 60558 | GUF1 | SYSMH2 | Human | Oral cavity | OSCC | 6.43e-05 | 1.18e-01 | 0.2326 |
| 60558 | GUF1 | SYSMH3 | Human | Oral cavity | OSCC | 7.01e-13 | 2.87e-01 | 0.2442 |
| 60558 | GUF1 | SYSMH5 | Human | Oral cavity | OSCC | 3.19e-03 | 1.40e-01 | 0.0647 |
| 60558 | GUF1 | male-WTA | Human | Thyroid | PTC | 5.15e-17 | 8.50e-02 | 0.1037 |
| Page: 1 2 |
| Tissue | Expression Dynamics | Abbreviation |
| Liver |  | HCC: Hepatocellular carcinoma |
| NAFLD: Non-alcoholic fatty liver disease | ||
| Oral Cavity | 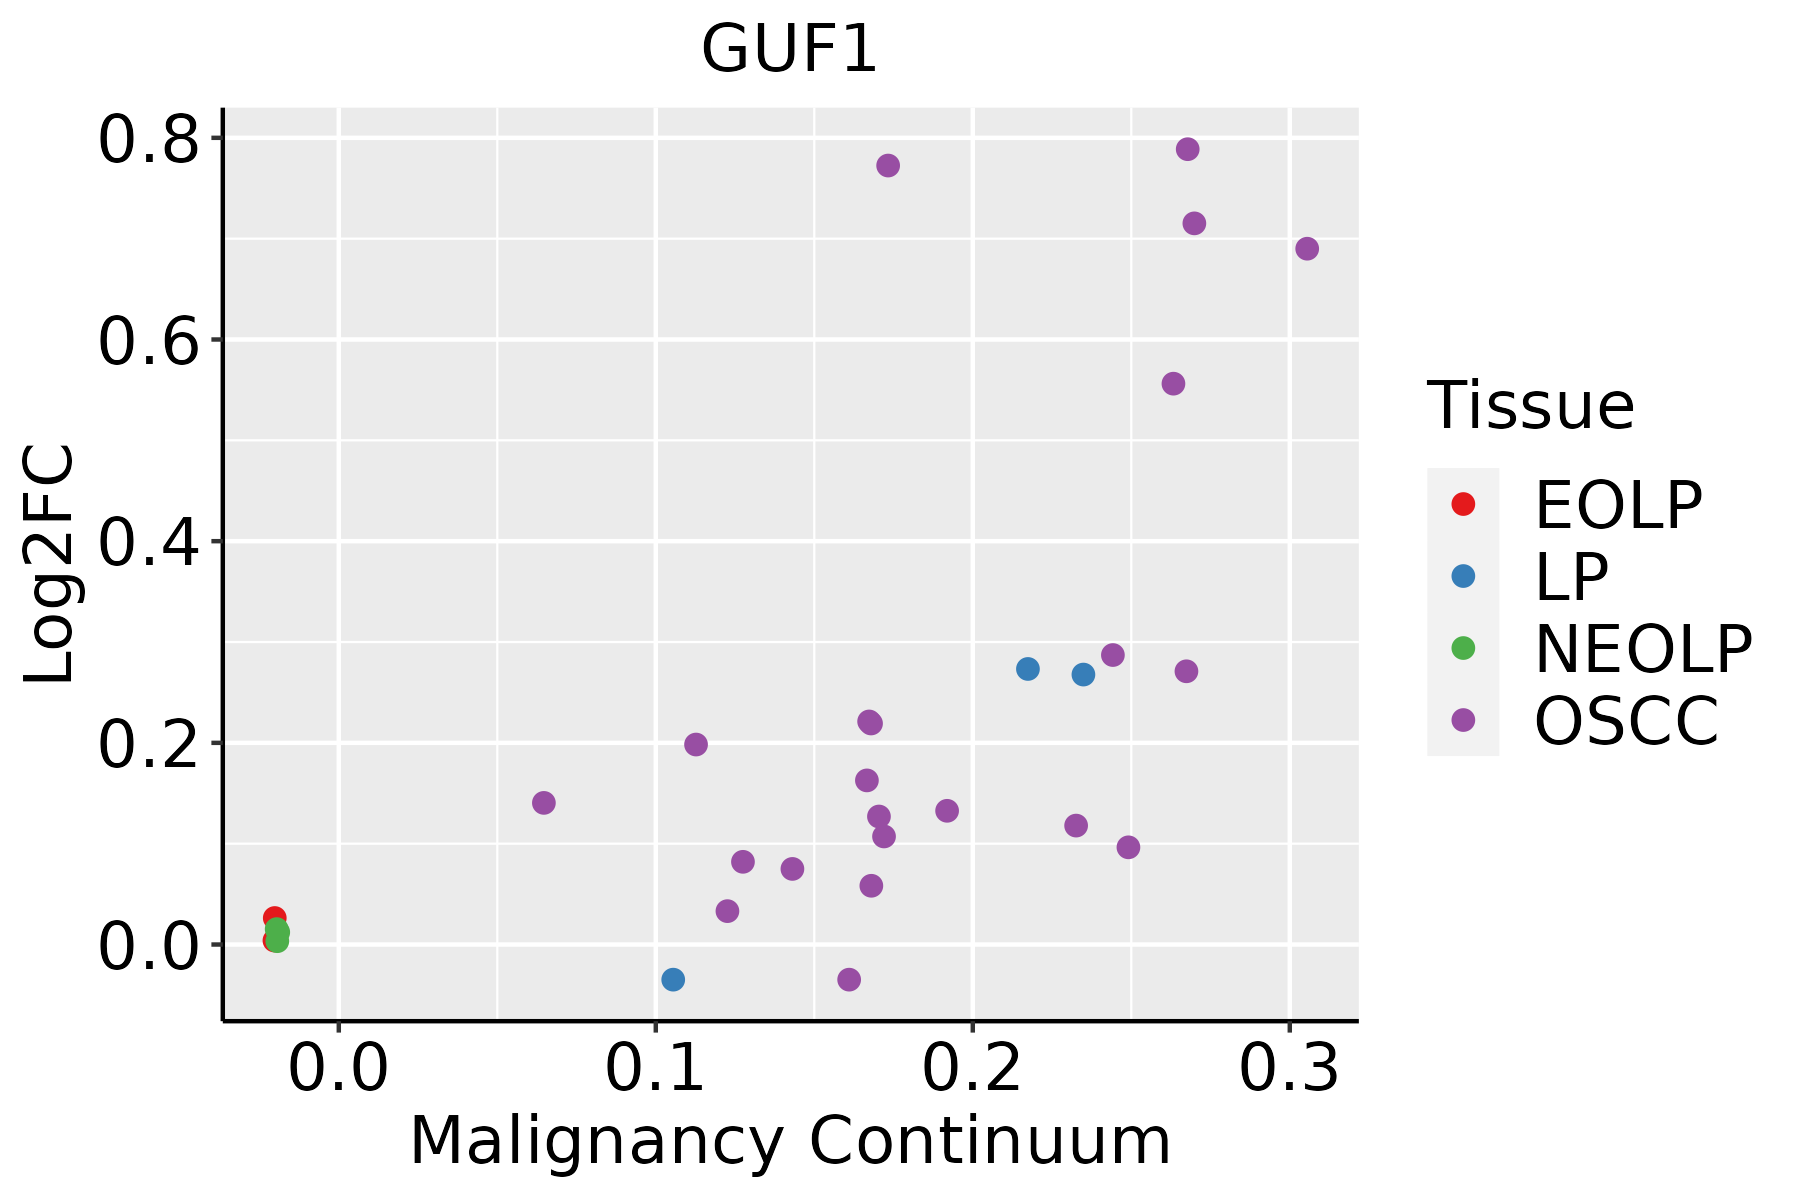 | EOLP: Erosive Oral lichen planus |
| LP: leukoplakia | ||
| NEOLP: Non-erosive oral lichen planus | ||
| OSCC: Oral squamous cell carcinoma | ||
| Thyroid | 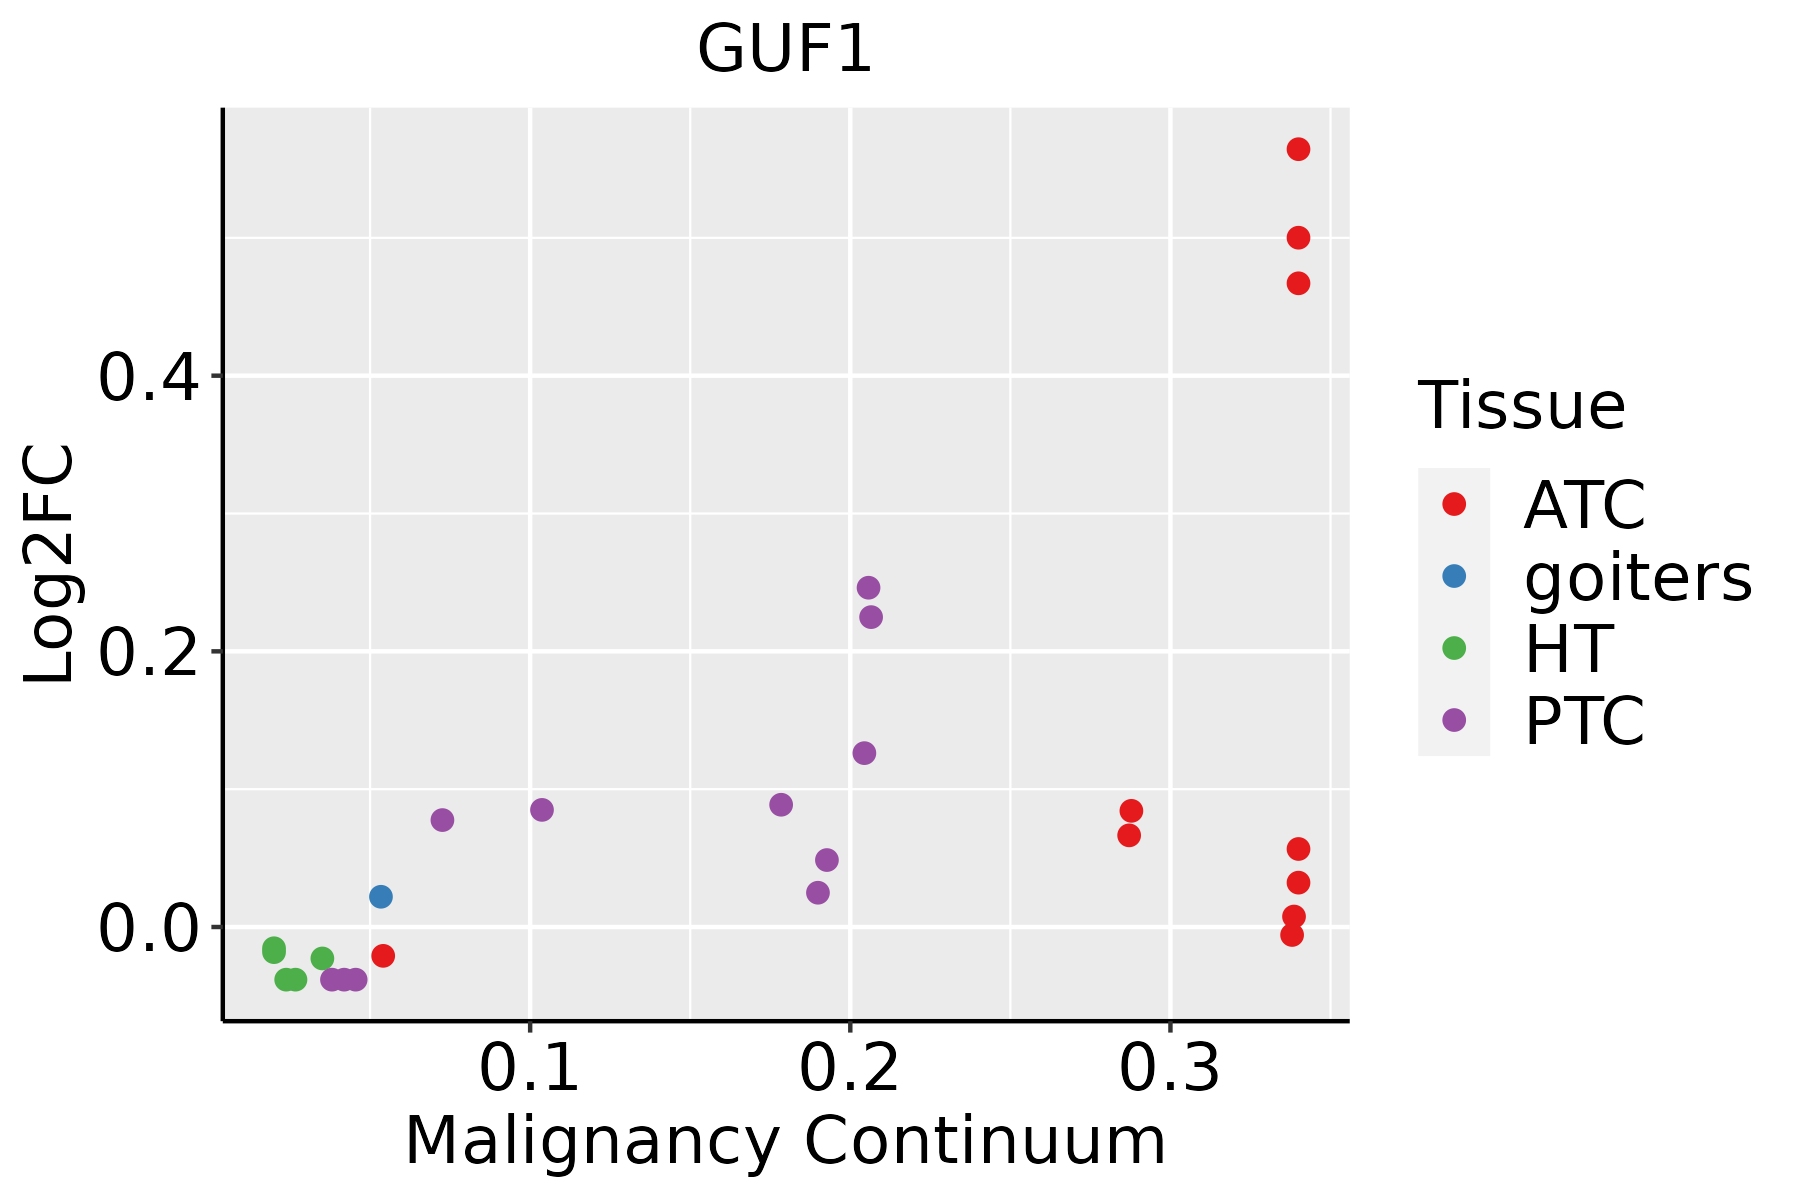 | ATC: Anaplastic thyroid cancer |
| HT: Hashimoto's thyroiditis | ||
| PTC: Papillary thyroid cancer |
| ∗log2FC in expression of this searched gene in stem-like cells from each diseased tissue sample relative to stem-like cells in normal samples in each tissue plotted against the malignancy continuum. Samples are colored based on if they are from different disease stage. |
Top |
Malignant transformation related pathway analysis |
| Find out the enriched GO biological processes and KEGG pathways involved in transition from healthy to precancer to cancer |
| Tissue | Disease Stage | Enriched GO biological Processes |
| Colorectum | AD |  |
| Colorectum | SER |  |
| Colorectum | MSS |  |
| Colorectum | MSI-H |  |
| Colorectum | FAP |  |
| ∗Top 15 enriched GO BP terms are showed in the bar plot of each disease state in each tissue. Each row represents a significant GO biological process which is colored according to the -log10(p.adjust). |
| Page: 1 2 3 4 5 6 7 8 9 |
| GO ID | Tissue | Disease Stage | Description | Gene Ratio | Bg Ratio | pvalue | p.adjust | Count |
| GO:000641722 | Liver | HCC | regulation of translation | 287/7958 | 468/18723 | 8.79e-17 | 8.08e-15 | 287 |
| GO:004572712 | Liver | HCC | positive regulation of translation | 97/7958 | 136/18723 | 8.51e-12 | 3.55e-10 | 97 |
| GO:003425022 | Liver | HCC | positive regulation of cellular amide metabolic process | 110/7958 | 162/18723 | 5.14e-11 | 1.92e-09 | 110 |
| GO:000641720 | Oral cavity | OSCC | regulation of translation | 274/7305 | 468/18723 | 4.39e-18 | 4.63e-16 | 274 |
| GO:004572719 | Oral cavity | OSCC | positive regulation of translation | 101/7305 | 136/18723 | 5.85e-17 | 4.94e-15 | 101 |
| GO:003425019 | Oral cavity | OSCC | positive regulation of cellular amide metabolic process | 115/7305 | 162/18723 | 1.28e-16 | 1.05e-14 | 115 |
| GO:0006417113 | Thyroid | PTC | regulation of translation | 236/5968 | 468/18723 | 2.70e-17 | 2.52e-15 | 236 |
| GO:0034250113 | Thyroid | PTC | positive regulation of cellular amide metabolic process | 98/5968 | 162/18723 | 5.26e-14 | 3.04e-12 | 98 |
| GO:0045727113 | Thyroid | PTC | positive regulation of translation | 84/5968 | 136/18723 | 6.52e-13 | 3.08e-11 | 84 |
| GO:000641735 | Thyroid | ATC | regulation of translation | 236/6293 | 468/18723 | 2.39e-14 | 1.34e-12 | 236 |
| GO:004572733 | Thyroid | ATC | positive regulation of translation | 85/6293 | 136/18723 | 4.71e-12 | 1.84e-10 | 85 |
| GO:003425034 | Thyroid | ATC | positive regulation of cellular amide metabolic process | 97/6293 | 162/18723 | 5.97e-12 | 2.30e-10 | 97 |
| Page: 1 |
| Pathway ID | Tissue | Disease Stage | Description | Gene Ratio | Bg Ratio | pvalue | p.adjust | qvalue | Count |
| Page: 1 |
Top |
Cell-cell communication analysis |
| Identification of potential cell-cell interactions between two cell types and their ligand-receptor pairs for different disease states |
| Ligand | Receptor | LRpair | Pathway | Tissue | Disease Stage |
| Page: 1 |
Top |
Single-cell gene regulatory network inference analysis |
| Find out the significant the regulons (TFs) and the target genes of each regulon across cell types for different disease states |
| TF | Cell Type | Tissue | Disease Stage | Target Gene | RSS | Regulon Activity |
| ∗The dot plots of a searched regulon are shown for all cell subpopulations in each disease state of each tissue based on the regulon specific score inferred using pySCENIC and by calculating the average expression. |
| Page: 1 |
Top |
Somatic mutation of malignant transformation related genes |
| Annotation of somatic variants for genes involved in malignant transformation |
| Hugo Symbol | Variant Class | Variant Classification | dbSNP RS | HGVSc | HGVSp | HGVSp Short | SWISSPROT | BIOTYPE | SIFT | PolyPhen | Tumor Sample Barcode | Tissue | Histology | Sex | Age | Stage | Therapy Types | Drugs | Outcome |
| GUF1 | SNV | Missense_Mutation | rs575851684 | c.256N>A | p.Asp86Asn | p.D86N | Q8N442 | protein_coding | deleterious(0) | probably_damaging(0.999) | TCGA-A2-A04P-01 | Breast | breast invasive carcinoma | Female | <65 | III/IV | Chemotherapy | taxol | PD |
| GUF1 | SNV | Missense_Mutation | c.1793N>A | p.Ala598Glu | p.A598E | Q8N442 | protein_coding | tolerated(0.06) | probably_damaging(0.979) | TCGA-A8-A09I-01 | Breast | breast invasive carcinoma | Female | >=65 | I/II | Hormone Therapy | anastrozole | SD | |
| GUF1 | SNV | Missense_Mutation | c.1579N>A | p.Asp527Asn | p.D527N | Q8N442 | protein_coding | tolerated(0.06) | probably_damaging(0.999) | TCGA-AC-A23H-01 | Breast | breast invasive carcinoma | Female | >=65 | I/II | Unknown | Unknown | PD | |
| GUF1 | SNV | Missense_Mutation | novel | c.319A>G | p.Lys107Glu | p.K107E | Q8N442 | protein_coding | deleterious(0.02) | probably_damaging(0.975) | TCGA-AN-A046-01 | Breast | breast invasive carcinoma | Female | >=65 | I/II | Unknown | Unknown | SD |
| GUF1 | SNV | Missense_Mutation | c.425N>G | p.Pro142Arg | p.P142R | Q8N442 | protein_coding | deleterious(0) | probably_damaging(1) | TCGA-C8-A12M-01 | Breast | breast invasive carcinoma | Female | >=65 | I/II | Unknown | Unknown | SD | |
| GUF1 | insertion | Nonsense_Mutation | novel | c.505_506insGATACAAACTCTTCTTTCTATGATTCCTCCTCT | p.Glu169delinsGlyTyrLysLeuPhePheLeuTerPheLeuLeuTer | p.E169delinsGYKLFFL*FLL* | Q8N442 | protein_coding | TCGA-A8-A07U-01 | Breast | breast invasive carcinoma | Female | >=65 | III/IV | Chemotherapy | 5-fluorouracil | SD | ||
| GUF1 | deletion | Frame_Shift_Del | c.1927delN | p.Lys645SerfsTer2 | p.K645Sfs*2 | Q8N442 | protein_coding | TCGA-AN-A0AK-01 | Breast | breast invasive carcinoma | Female | >=65 | I/II | Unknown | Unknown | SD | |||
| GUF1 | deletion | Frame_Shift_Del | c.1927delN | p.Lys645SerfsTer2 | p.K645Sfs*2 | Q8N442 | protein_coding | TCGA-EA-A410-01 | Cervix | cervical & endocervical cancer | Female | <65 | I/II | Unknown | Unknown | SD | |||
| GUF1 | SNV | Missense_Mutation | rs116110746 | c.1754G>A | p.Arg585Gln | p.R585Q | Q8N442 | protein_coding | deleterious(0.01) | possibly_damaging(0.797) | TCGA-AA-3710-01 | Colorectum | colon adenocarcinoma | Female | >=65 | I/II | Unknown | Unknown | SD |
| GUF1 | SNV | Missense_Mutation | c.1692N>T | p.Glu564Asp | p.E564D | Q8N442 | protein_coding | tolerated(1) | benign(0.03) | TCGA-AA-3815-01 | Colorectum | colon adenocarcinoma | Female | >=65 | I/II | Unknown | Unknown | SD |
| Page: 1 2 3 4 5 6 7 8 9 |
Top |
Related drugs of malignant transformation related genes |
| Identification of chemicals and drugs interact with genes involved in malignant transfromation |
| (DGIdb 4.0) |
| Entrez ID | Symbol | Category | Interaction Types | Drug Claim Name | Drug Name | PMIDs |
| Page: 1 |

Copyright 2023-Present -The University of Texas Health Science Center at Houston |