
|
|||||
|
 | |
| |
| |
| |
| |
| |
|
Gene: GUCY2C |
Gene summary for GUCY2C |
| Gene information | Species | Human | Gene symbol | GUCY2C | Gene ID | 2984 |
| Gene name | guanylate cyclase 2C | |
| Gene Alias | DIAR6 | |
| Cytomap | 12p12.3 | |
| Gene Type | protein-coding | GO ID | GO:0006139 | UniProtAcc | P25092 |
Top |
Malignant transformation analysis |
| Identification of the aberrant gene expression in precancerous and cancerous lesions by comparing the gene expression of stem-like cells in diseased tissues with normal stem cells |
| Entrez ID | Symbol | Replicates | Species | Organ | Tissue | Adj P-value | Log2FC | Malignancy |
| 2984 | GUCY2C | HTA11_3410_2000001011 | Human | Colorectum | AD | 1.53e-10 | -4.55e-01 | 0.0155 |
| 2984 | GUCY2C | HTA11_347_2000001011 | Human | Colorectum | AD | 2.71e-02 | 4.43e-01 | -0.1954 |
| 2984 | GUCY2C | HTA11_3361_2000001011 | Human | Colorectum | AD | 6.89e-06 | -5.33e-01 | -0.1207 |
| 2984 | GUCY2C | HTA11_696_2000001011 | Human | Colorectum | AD | 2.29e-03 | -3.14e-01 | -0.1464 |
| 2984 | GUCY2C | HTA11_99999970781_79442 | Human | Colorectum | MSS | 4.25e-06 | -3.40e-01 | 0.294 |
| 2984 | GUCY2C | HTA11_99999965104_69814 | Human | Colorectum | MSS | 1.97e-03 | 5.58e-01 | 0.281 |
| 2984 | GUCY2C | HTA11_99999974143_84620 | Human | Colorectum | MSS | 1.63e-04 | -3.95e-01 | 0.3005 |
| 2984 | GUCY2C | F007 | Human | Colorectum | FAP | 2.47e-02 | -3.16e-01 | 0.1176 |
| 2984 | GUCY2C | A001-C-207 | Human | Colorectum | FAP | 2.70e-04 | -2.92e-01 | 0.1278 |
| 2984 | GUCY2C | A015-C-203 | Human | Colorectum | FAP | 1.13e-32 | -4.31e-01 | -0.1294 |
| 2984 | GUCY2C | A015-C-204 | Human | Colorectum | FAP | 1.04e-07 | -4.28e-01 | -0.0228 |
| 2984 | GUCY2C | A014-C-040 | Human | Colorectum | FAP | 1.58e-02 | -1.72e-02 | -0.1184 |
| 2984 | GUCY2C | A002-C-201 | Human | Colorectum | FAP | 1.29e-11 | -3.27e-01 | 0.0324 |
| 2984 | GUCY2C | A002-C-203 | Human | Colorectum | FAP | 2.43e-06 | -2.09e-01 | 0.2786 |
| 2984 | GUCY2C | A001-C-119 | Human | Colorectum | FAP | 9.64e-06 | -3.97e-01 | -0.1557 |
| 2984 | GUCY2C | A001-C-108 | Human | Colorectum | FAP | 3.28e-24 | -3.39e-01 | -0.0272 |
| 2984 | GUCY2C | A002-C-205 | Human | Colorectum | FAP | 4.93e-24 | -5.61e-01 | -0.1236 |
| 2984 | GUCY2C | A001-C-104 | Human | Colorectum | FAP | 4.42e-06 | -3.46e-01 | 0.0184 |
| 2984 | GUCY2C | A015-C-006 | Human | Colorectum | FAP | 3.14e-16 | -5.25e-01 | -0.0994 |
| 2984 | GUCY2C | A015-C-106 | Human | Colorectum | FAP | 5.00e-12 | -3.38e-01 | -0.0511 |
| Page: 1 2 |
| Tissue | Expression Dynamics | Abbreviation |
| Colorectum (GSE201348) | 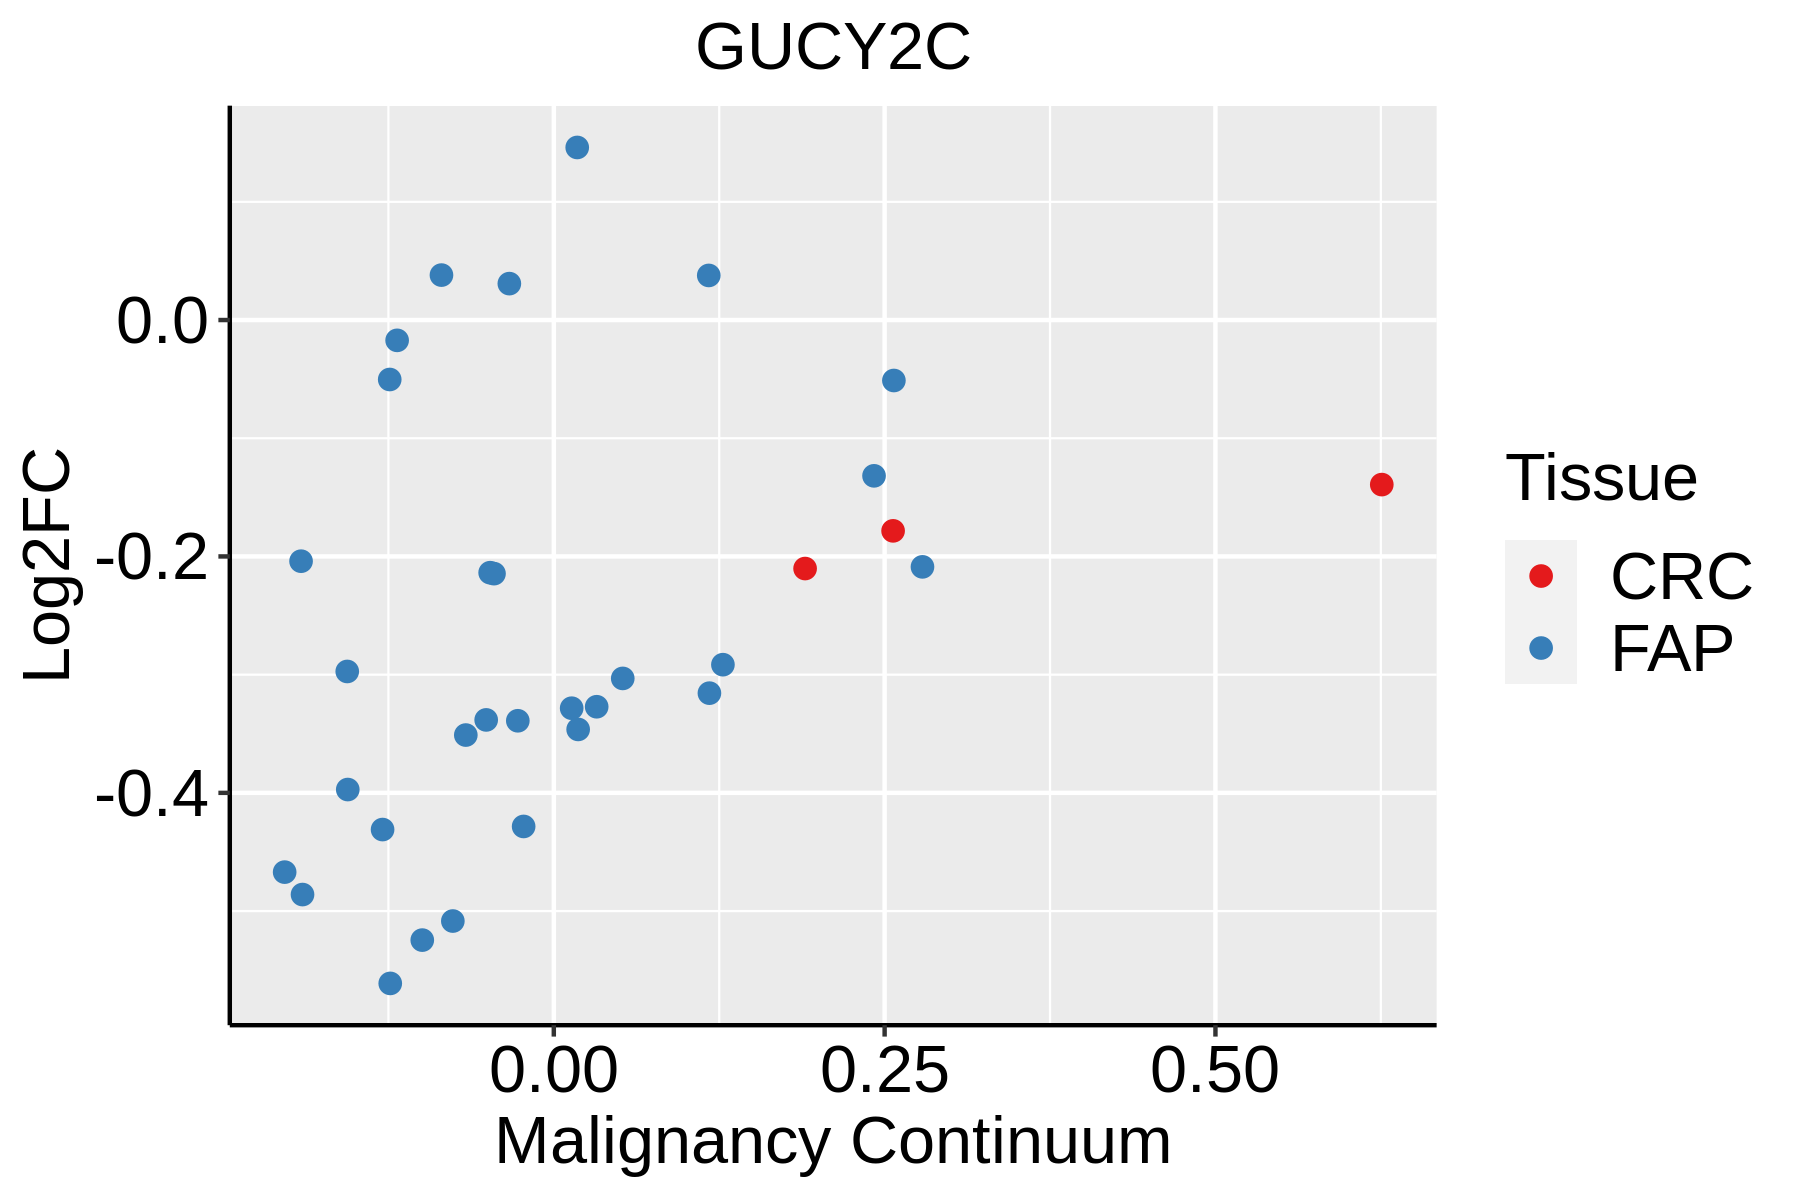 | FAP: Familial adenomatous polyposis |
| CRC: Colorectal cancer | ||
| Colorectum (HTA11) |  | AD: Adenomas |
| SER: Sessile serrated lesions | ||
| MSI-H: Microsatellite-high colorectal cancer | ||
| MSS: Microsatellite stable colorectal cancer |
| ∗log2FC in expression of this searched gene in stem-like cells from each diseased tissue sample relative to stem-like cells in normal samples in each tissue plotted against the malignancy continuum. Samples are colored based on if they are from different disease stage. |
Top |
Malignant transformation related pathway analysis |
| Find out the enriched GO biological processes and KEGG pathways involved in transition from healthy to precancer to cancer |
| Tissue | Disease Stage | Enriched GO biological Processes |
| Colorectum | AD |  |
| Colorectum | SER |  |
| Colorectum | MSS |  |
| Colorectum | MSI-H |  |
| Colorectum | FAP |  |
| ∗Top 15 enriched GO BP terms are showed in the bar plot of each disease state in each tissue. Each row represents a significant GO biological process which is colored according to the -log10(p.adjust). |
| Page: 1 2 3 4 5 6 7 8 9 |
| GO ID | Tissue | Disease Stage | Description | Gene Ratio | Bg Ratio | pvalue | p.adjust | Count |
| GO:0009150 | Colorectum | AD | purine ribonucleotide metabolic process | 142/3918 | 368/18723 | 4.29e-15 | 1.17e-12 | 142 |
| GO:0006163 | Colorectum | AD | purine nucleotide metabolic process | 149/3918 | 396/18723 | 1.08e-14 | 2.80e-12 | 149 |
| GO:0072521 | Colorectum | AD | purine-containing compound metabolic process | 153/3918 | 416/18723 | 4.34e-14 | 1.01e-11 | 153 |
| GO:0009259 | Colorectum | AD | ribonucleotide metabolic process | 144/3918 | 385/18723 | 5.25e-14 | 1.13e-11 | 144 |
| GO:0019693 | Colorectum | AD | ribose phosphate metabolic process | 145/3918 | 396/18723 | 3.01e-13 | 5.71e-11 | 145 |
| GO:0009117 | Colorectum | AD | nucleotide metabolic process | 168/3918 | 489/18723 | 2.20e-12 | 3.36e-10 | 168 |
| GO:0006753 | Colorectum | AD | nucleoside phosphate metabolic process | 169/3918 | 497/18723 | 4.99e-12 | 6.98e-10 | 169 |
| GO:0009152 | Colorectum | AD | purine ribonucleotide biosynthetic process | 64/3918 | 169/18723 | 3.09e-07 | 1.22e-05 | 64 |
| GO:0009636 | Colorectum | AD | response to toxic substance | 88/3918 | 262/18723 | 1.12e-06 | 3.72e-05 | 88 |
| GO:0009260 | Colorectum | AD | ribonucleotide biosynthetic process | 66/3918 | 182/18723 | 1.25e-06 | 4.02e-05 | 66 |
| GO:0046390 | Colorectum | AD | ribose phosphate biosynthetic process | 67/3918 | 190/18723 | 3.21e-06 | 9.05e-05 | 67 |
| GO:0006164 | Colorectum | AD | purine nucleotide biosynthetic process | 66/3918 | 191/18723 | 8.22e-06 | 1.97e-04 | 66 |
| GO:0072522 | Colorectum | AD | purine-containing compound biosynthetic process | 68/3918 | 200/18723 | 1.12e-05 | 2.55e-04 | 68 |
| GO:1901293 | Colorectum | AD | nucleoside phosphate biosynthetic process | 80/3918 | 256/18723 | 6.31e-05 | 1.05e-03 | 80 |
| GO:0009165 | Colorectum | AD | nucleotide biosynthetic process | 79/3918 | 254/18723 | 8.33e-05 | 1.30e-03 | 79 |
| GO:00061632 | Colorectum | MSS | purine nucleotide metabolic process | 128/3467 | 396/18723 | 2.04e-11 | 3.02e-09 | 128 |
| GO:00091502 | Colorectum | MSS | purine ribonucleotide metabolic process | 121/3467 | 368/18723 | 2.08e-11 | 3.02e-09 | 121 |
| GO:00725212 | Colorectum | MSS | purine-containing compound metabolic process | 132/3467 | 416/18723 | 4.13e-11 | 4.86e-09 | 132 |
| GO:00092592 | Colorectum | MSS | ribonucleotide metabolic process | 123/3467 | 385/18723 | 1.17e-10 | 1.20e-08 | 123 |
| GO:00196932 | Colorectum | MSS | ribose phosphate metabolic process | 124/3467 | 396/18723 | 4.11e-10 | 3.49e-08 | 124 |
| Page: 1 2 3 |
| Pathway ID | Tissue | Disease Stage | Description | Gene Ratio | Bg Ratio | pvalue | p.adjust | qvalue | Count |
| Page: 1 |
Top |
Cell-cell communication analysis |
| Identification of potential cell-cell interactions between two cell types and their ligand-receptor pairs for different disease states |
| Ligand | Receptor | LRpair | Pathway | Tissue | Disease Stage |
| GUCA2A | GUCY2C | GUCA2A_GUCY2C | GUCA | CRC | AD |
| GUCA2A | GUCY2C | GUCA2A_GUCY2C | GUCA | CRC | ADJ |
| GUCA2B | GUCY2C | GUCA2B_GUCY2C | GUCA | CRC | ADJ |
| GUCA2A | GUCY2C | GUCA2A_GUCY2C | GUCA | CRC | FAP |
| GUCA2A | GUCY2C | GUCA2A_GUCY2C | GUCA | CRC | Healthy |
| GUCA2A | GUCY2C | GUCA2A_GUCY2C | GUCA | CRC | MSS |
| GUCA2A | GUCY2C | GUCA2A_GUCY2C | GUCA | CRC | SER |
| GUCA2B | GUCY2C | GUCA2B_GUCY2C | GUCA | CRC | SER |
| Page: 1 |
Top |
Single-cell gene regulatory network inference analysis |
| Find out the significant the regulons (TFs) and the target genes of each regulon across cell types for different disease states |
| TF | Cell Type | Tissue | Disease Stage | Target Gene | RSS | Regulon Activity |
| ∗The dot plots of a searched regulon are shown for all cell subpopulations in each disease state of each tissue based on the regulon specific score inferred using pySCENIC and by calculating the average expression. |
| Page: 1 |
Top |
Somatic mutation of malignant transformation related genes |
| Annotation of somatic variants for genes involved in malignant transformation |
| Hugo Symbol | Variant Class | Variant Classification | dbSNP RS | HGVSc | HGVSp | HGVSp Short | SWISSPROT | BIOTYPE | SIFT | PolyPhen | Tumor Sample Barcode | Tissue | Histology | Sex | Age | Stage | Therapy Types | Drugs | Outcome |
| GUCY2C | SNV | Missense_Mutation | c.1505G>A | p.Arg502Lys | p.R502K | P25092 | protein_coding | tolerated(0.3) | benign(0.053) | TCGA-A2-A04W-01 | Breast | breast invasive carcinoma | Female | <65 | I/II | Chemotherapy | cytoxan | SD | |
| GUCY2C | SNV | Missense_Mutation | c.1645N>T | p.Gly549Cys | p.G549C | P25092 | protein_coding | deleterious(0) | probably_damaging(1) | TCGA-A2-A0EQ-01 | Breast | breast invasive carcinoma | Female | <65 | I/II | Chemotherapy | adriamycin | SD | |
| GUCY2C | SNV | Missense_Mutation | c.387N>G | p.Phe129Leu | p.F129L | P25092 | protein_coding | tolerated(0.07) | possibly_damaging(0.676) | TCGA-A8-A07I-01 | Breast | breast invasive carcinoma | Female | >=65 | III/IV | Chemotherapy | 5-fluorouracil | CR | |
| GUCY2C | SNV | Missense_Mutation | c.1661N>G | p.Asp554Gly | p.D554G | P25092 | protein_coding | deleterious(0.01) | probably_damaging(0.974) | TCGA-A8-A08S-01 | Breast | breast invasive carcinoma | Female | >=65 | I/II | Hormone Therapy | anastrozole | SD | |
| GUCY2C | SNV | Missense_Mutation | novel | c.2336T>C | p.Val779Ala | p.V779A | P25092 | protein_coding | deleterious(0) | probably_damaging(0.997) | TCGA-AC-A62V-01 | Breast | breast invasive carcinoma | Male | <65 | III/IV | Targeted Molecular therapy | denosumab | PD |
| GUCY2C | SNV | Missense_Mutation | novel | c.2318N>A | p.Arg773Gln | p.R773Q | P25092 | protein_coding | deleterious(0.02) | possibly_damaging(0.769) | TCGA-AN-A046-01 | Breast | breast invasive carcinoma | Female | >=65 | I/II | Unknown | Unknown | SD |
| GUCY2C | SNV | Missense_Mutation | c.2797G>A | p.Val933Met | p.V933M | P25092 | protein_coding | deleterious(0) | probably_damaging(1) | TCGA-AN-A0AK-01 | Breast | breast invasive carcinoma | Female | >=65 | I/II | Unknown | Unknown | SD | |
| GUCY2C | SNV | Missense_Mutation | c.690G>T | p.Lys230Asn | p.K230N | P25092 | protein_coding | tolerated(0.16) | benign(0.049) | TCGA-AQ-A0Y5-01 | Breast | breast invasive carcinoma | Female | >=65 | III/IV | Chemotherapy | cytoxan | SD | |
| GUCY2C | SNV | Missense_Mutation | novel | c.362N>T | p.Gly121Val | p.G121V | P25092 | protein_coding | deleterious(0) | probably_damaging(1) | TCGA-B6-A40B-01 | Breast | breast invasive carcinoma | Female | >=65 | I/II | Unknown | Unknown | SD |
| GUCY2C | SNV | Missense_Mutation | novel | c.601G>A | p.Asp201Asn | p.D201N | P25092 | protein_coding | tolerated(0.1) | possibly_damaging(0.719) | TCGA-BH-A1EW-01 | Breast | breast invasive carcinoma | Female | <65 | I/II | Unknown | Unknown | PD |
| Page: 1 2 3 4 5 6 7 8 9 10 11 12 13 |
Top |
Related drugs of malignant transformation related genes |
| Identification of chemicals and drugs interact with genes involved in malignant transfromation |
| (DGIdb 4.0) |
| Entrez ID | Symbol | Category | Interaction Types | Drug Claim Name | Drug Name | PMIDs |
| 2984 | GUCY2C | DRUGGABLE GENOME, KINASE | agonist | 178101714 | LINACLOTIDE | |
| 2984 | GUCY2C | DRUGGABLE GENOME, KINASE | agonist | 178101551 | ||
| 2984 | GUCY2C | DRUGGABLE GENOME, KINASE | agonist | 374883898 | DOLCANATIDE | |
| 2984 | GUCY2C | DRUGGABLE GENOME, KINASE | SP-333 | DOLCANATIDE | ||
| 2984 | GUCY2C | DRUGGABLE GENOME, KINASE | agonist | CHEMBL3301675 | LINACLOTIDE | |
| 2984 | GUCY2C | DRUGGABLE GENOME, KINASE | antibody | 252827376 | ||
| 2984 | GUCY2C | DRUGGABLE GENOME, KINASE | PLECANATIDE | PLECANATIDE | ||
| 2984 | GUCY2C | DRUGGABLE GENOME, KINASE | MLN0264 | INDUSATUMAB VEDOTIN | ||
| 2984 | GUCY2C | DRUGGABLE GENOME, KINASE | MD-1100 | LINACLOTIDE | ||
| 2984 | GUCY2C | DRUGGABLE GENOME, KINASE | ISIS-GCCRrx |
| Page: 1 2 |

Copyright 2023-Present -The University of Texas Health Science Center at Houston |