
|
|||||
|
 | |
| |
| |
| |
| |
| |
|
Gene: GUCY1A2 |
Gene summary for GUCY1A2 |
| Gene information | Species | Human | Gene symbol | GUCY1A2 | Gene ID | 2977 |
| Gene name | guanylate cyclase 1 soluble subunit alpha 2 | |
| Gene Alias | GC-SA2 | |
| Cytomap | 11q22.3 | |
| Gene Type | protein-coding | GO ID | GO:0006139 | UniProtAcc | P33402 |
Top |
Malignant transformation analysis |
| Identification of the aberrant gene expression in precancerous and cancerous lesions by comparing the gene expression of stem-like cells in diseased tissues with normal stem cells |
| Entrez ID | Symbol | Replicates | Species | Organ | Tissue | Adj P-value | Log2FC | Malignancy |
| 2977 | GUCY1A2 | ATC13 | Human | Thyroid | ATC | 6.99e-29 | 5.47e-01 | 0.34 |
| 2977 | GUCY1A2 | ATC2 | Human | Thyroid | ATC | 7.49e-03 | 3.66e-01 | 0.34 |
| 2977 | GUCY1A2 | ATC5 | Human | Thyroid | ATC | 6.62e-35 | 6.18e-01 | 0.34 |
| Page: 1 |
| Tissue | Expression Dynamics | Abbreviation |
| Thyroid | 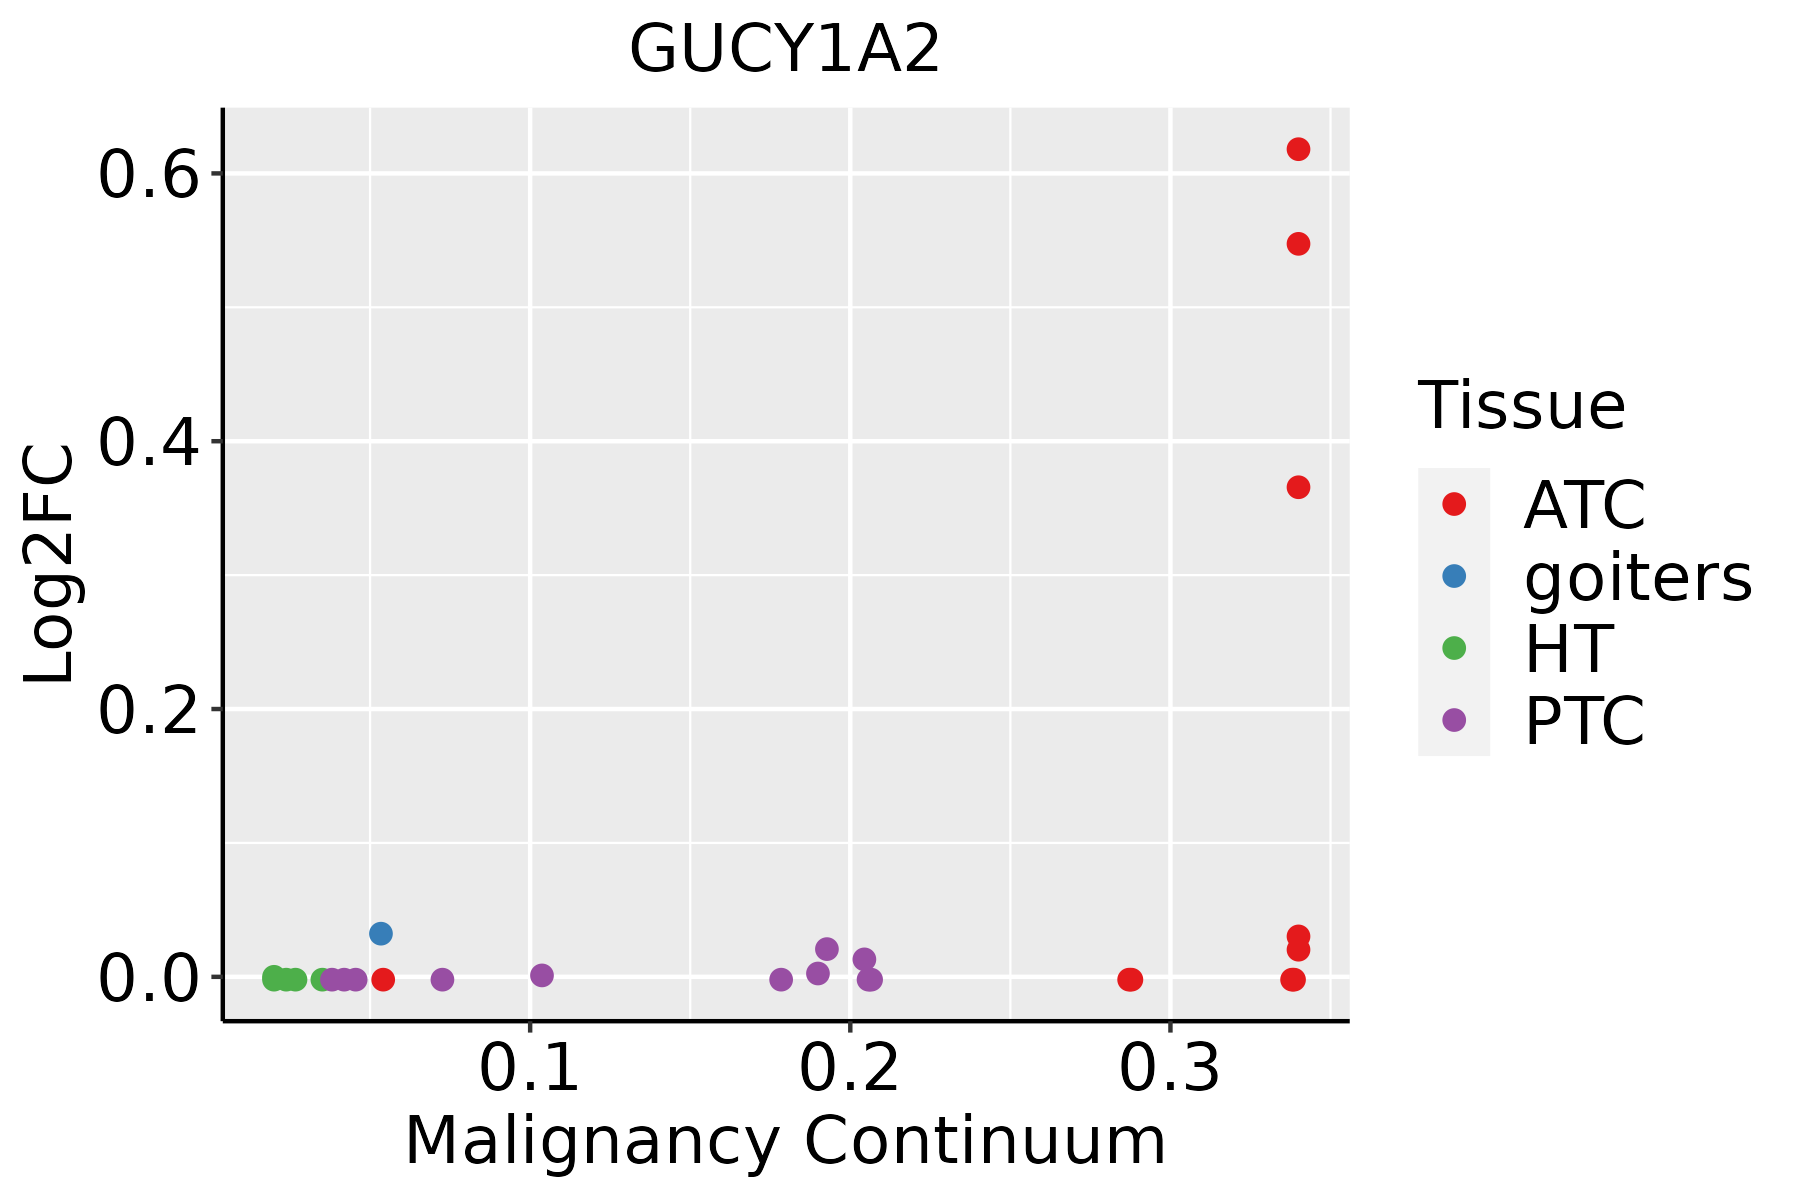 | ATC: Anaplastic thyroid cancer |
| HT: Hashimoto's thyroiditis | ||
| PTC: Papillary thyroid cancer |
| ∗log2FC in expression of this searched gene in stem-like cells from each diseased tissue sample relative to stem-like cells in normal samples in each tissue plotted against the malignancy continuum. Samples are colored based on if they are from different disease stage. |
Top |
Malignant transformation related pathway analysis |
| Find out the enriched GO biological processes and KEGG pathways involved in transition from healthy to precancer to cancer |
| Tissue | Disease Stage | Enriched GO biological Processes |
| Colorectum | AD |  |
| Colorectum | SER |  |
| Colorectum | MSS |  |
| Colorectum | MSI-H |  |
| Colorectum | FAP |  |
| ∗Top 15 enriched GO BP terms are showed in the bar plot of each disease state in each tissue. Each row represents a significant GO biological process which is colored according to the -log10(p.adjust). |
| Page: 1 2 3 4 5 6 7 8 9 |
| GO ID | Tissue | Disease Stage | Description | Gene Ratio | Bg Ratio | pvalue | p.adjust | Count |
| GO:001969328 | Thyroid | ATC | ribose phosphate metabolic process | 184/6293 | 396/18723 | 5.87e-08 | 1.05e-06 | 184 |
| GO:000915029 | Thyroid | ATC | purine ribonucleotide metabolic process | 172/6293 | 368/18723 | 9.58e-08 | 1.64e-06 | 172 |
| GO:000925928 | Thyroid | ATC | ribonucleotide metabolic process | 178/6293 | 385/18723 | 1.47e-07 | 2.39e-06 | 178 |
| GO:007252128 | Thyroid | ATC | purine-containing compound metabolic process | 189/6293 | 416/18723 | 2.83e-07 | 4.29e-06 | 189 |
| GO:0006753111 | Thyroid | ATC | nucleoside phosphate metabolic process | 219/6293 | 497/18723 | 5.92e-07 | 8.29e-06 | 219 |
| GO:0009117112 | Thyroid | ATC | nucleotide metabolic process | 215/6293 | 489/18723 | 9.09e-07 | 1.20e-05 | 215 |
| GO:000616328 | Thyroid | ATC | purine nucleotide metabolic process | 177/6293 | 396/18723 | 2.39e-06 | 2.82e-05 | 177 |
| GO:000915225 | Thyroid | ATC | purine ribonucleotide biosynthetic process | 84/6293 | 169/18723 | 1.05e-05 | 1.04e-04 | 84 |
| GO:004639025 | Thyroid | ATC | ribose phosphate biosynthetic process | 92/6293 | 190/18723 | 1.57e-05 | 1.46e-04 | 92 |
| GO:000926025 | Thyroid | ATC | ribonucleotide biosynthetic process | 88/6293 | 182/18723 | 2.55e-05 | 2.20e-04 | 88 |
| GO:007252223 | Thyroid | ATC | purine-containing compound biosynthetic process | 92/6293 | 200/18723 | 1.74e-04 | 1.18e-03 | 92 |
| GO:000616423 | Thyroid | ATC | purine nucleotide biosynthetic process | 87/6293 | 191/18723 | 3.83e-04 | 2.32e-03 | 87 |
| GO:190129318 | Thyroid | ATC | nucleoside phosphate biosynthetic process | 110/6293 | 256/18723 | 1.06e-03 | 5.58e-03 | 110 |
| GO:000916518 | Thyroid | ATC | nucleotide biosynthetic process | 109/6293 | 254/18723 | 1.17e-03 | 6.15e-03 | 109 |
| Page: 1 |
| Pathway ID | Tissue | Disease Stage | Description | Gene Ratio | Bg Ratio | pvalue | p.adjust | qvalue | Count |
| Page: 1 |
Top |
Cell-cell communication analysis |
| Identification of potential cell-cell interactions between two cell types and their ligand-receptor pairs for different disease states |
| Ligand | Receptor | LRpair | Pathway | Tissue | Disease Stage |
| Page: 1 |
Top |
Single-cell gene regulatory network inference analysis |
| Find out the significant the regulons (TFs) and the target genes of each regulon across cell types for different disease states |
| TF | Cell Type | Tissue | Disease Stage | Target Gene | RSS | Regulon Activity |
| ∗The dot plots of a searched regulon are shown for all cell subpopulations in each disease state of each tissue based on the regulon specific score inferred using pySCENIC and by calculating the average expression. |
| Page: 1 |
Top |
Somatic mutation of malignant transformation related genes |
| Annotation of somatic variants for genes involved in malignant transformation |
| Hugo Symbol | Variant Class | Variant Classification | dbSNP RS | HGVSc | HGVSp | HGVSp Short | SWISSPROT | BIOTYPE | SIFT | PolyPhen | Tumor Sample Barcode | Tissue | Histology | Sex | Age | Stage | Therapy Types | Drugs | Outcome |
| GUCY1A2 | SNV | Missense_Mutation | c.2047N>A | p.His683Asn | p.H683N | P33402 | protein_coding | tolerated(0.33) | possibly_damaging(0.583) | TCGA-A2-A0YT-01 | Breast | breast invasive carcinoma | Female | <65 | III/IV | Hormone Therapy | arimidex | SD | |
| GUCY1A2 | SNV | Missense_Mutation | novel | c.1355N>C | p.Val452Ala | p.V452A | P33402 | protein_coding | deleterious(0) | probably_damaging(0.99) | TCGA-A7-A6VW-01 | Breast | breast invasive carcinoma | Female | <65 | I/II | Chemotherapy | doxorubicin | CR |
| GUCY1A2 | SNV | Missense_Mutation | c.759G>A | p.Met253Ile | p.M253I | P33402 | protein_coding | tolerated(1) | benign(0.003) | TCGA-A8-A0A7-01 | Breast | breast invasive carcinoma | Female | <65 | I/II | Unknown | Unknown | SD | |
| GUCY1A2 | SNV | Missense_Mutation | novel | c.1180G>A | p.Ala394Thr | p.A394T | P33402 | protein_coding | tolerated(0.58) | benign(0.025) | TCGA-B6-A2IU-01 | Breast | breast invasive carcinoma | Female | <65 | I/II | Unknown | Unknown | PD |
| GUCY1A2 | SNV | Missense_Mutation | c.1477N>T | p.Leu493Phe | p.L493F | P33402 | protein_coding | deleterious(0) | probably_damaging(0.999) | TCGA-BH-A0DX-01 | Breast | breast invasive carcinoma | Female | <65 | I/II | Chemotherapy | taxotere | CR | |
| GUCY1A2 | SNV | Missense_Mutation | rs765520349 | c.1307N>A | p.Arg436Gln | p.R436Q | P33402 | protein_coding | deleterious(0.02) | possibly_damaging(0.843) | TCGA-EW-A1OV-01 | Breast | breast invasive carcinoma | Female | <65 | I/II | Chemotherapy | epirubicin | SD |
| GUCY1A2 | insertion | Nonsense_Mutation | novel | c.612_613insCCACTGAATGTAGTCAAACTATGAGAAATATA | p.Ala205ProfsTer8 | p.A205Pfs*8 | P33402 | protein_coding | TCGA-A8-A09C-01 | Breast | breast invasive carcinoma | Female | >=65 | I/II | Unknown | Unknown | SD | ||
| GUCY1A2 | insertion | In_Frame_Ins | novel | c.2037_2038insAATTTTAAAAATATTTTT | p.Glu679_Ser680insAsnPheLysAsnIlePhe | p.E679_S680insNFKNIF | P33402 | protein_coding | TCGA-AO-A03R-01 | Breast | breast invasive carcinoma | Female | <65 | I/II | Chemotherapy | doxorubicin | SD | ||
| GUCY1A2 | insertion | Nonsense_Mutation | novel | c.2036_2037insATAATT | p.Glu679_Ser680insTer | p.E679_S680ins* | P33402 | protein_coding | TCGA-AO-A03R-01 | Breast | breast invasive carcinoma | Female | <65 | I/II | Chemotherapy | doxorubicin | SD | ||
| GUCY1A2 | SNV | Missense_Mutation | c.325N>T | p.Leu109Phe | p.L109F | P33402 | protein_coding | tolerated(0.09) | possibly_damaging(0.823) | TCGA-C5-A2LS-01 | Cervix | cervical & endocervical cancer | Female | <65 | I/II | Unknown | Unknown | SD |
| Page: 1 2 3 4 5 6 7 8 9 10 11 12 13 14 15 |
Top |
Related drugs of malignant transformation related genes |
| Identification of chemicals and drugs interact with genes involved in malignant transfromation |
| (DGIdb 4.0) |
| Entrez ID | Symbol | Category | Interaction Types | Drug Claim Name | Drug Name | PMIDs |
| 2977 | GUCY1A2 | ENZYME, DRUGGABLE GENOME | activator | CHEMBL1200689 | NITRIC OXIDE | |
| 2977 | GUCY1A2 | ENZYME, DRUGGABLE GENOME | activator | CHEMBL1311 | ISOSORBIDE MONONITRATE | |
| 2977 | GUCY1A2 | ENZYME, DRUGGABLE GENOME | RIOCIGUAT | RIOCIGUAT | ||
| 2977 | GUCY1A2 | ENZYME, DRUGGABLE GENOME | NITRIC OXIDE | |||
| 2977 | GUCY1A2 | ENZYME, DRUGGABLE GENOME | NCX 4016 | |||
| 2977 | GUCY1A2 | ENZYME, DRUGGABLE GENOME | positive modulator | CHEMBL2107834 | RIOCIGUAT | |
| 2977 | GUCY1A2 | ENZYME, DRUGGABLE GENOME | activator | CHEMBL136478 | SODIUM NITROPRUSSIDE | |
| 2977 | GUCY1A2 | ENZYME, DRUGGABLE GENOME | activator | CHEMBL6622 | ISOSORBIDE DINITRATE | |
| 2977 | GUCY1A2 | ENZYME, DRUGGABLE GENOME | activator | CHEMBL730 | NITROGLYCERIN | |
| 2977 | GUCY1A2 | ENZYME, DRUGGABLE GENOME | NAPROXCINOD | NAPROXCINOD |
| Page: 1 2 |

Copyright 2023-Present -The University of Texas Health Science Center at Houston |