
|
|||||
|
 | |
| |
| |
| |
| |
| |
|
Gene: GUCD1 |
Gene summary for GUCD1 |
| Gene information | Species | Human | Gene symbol | GUCD1 | Gene ID | 83606 |
| Gene name | guanylyl cyclase domain containing 1 | |
| Gene Alias | C22orf13 | |
| Cytomap | 22q11.23 | |
| Gene Type | protein-coding | GO ID | GO:0003674 | UniProtAcc | A0A087WVD9 |
Top |
Malignant transformation analysis |
| Identification of the aberrant gene expression in precancerous and cancerous lesions by comparing the gene expression of stem-like cells in diseased tissues with normal stem cells |
| Entrez ID | Symbol | Replicates | Species | Organ | Tissue | Adj P-value | Log2FC | Malignancy |
| 83606 | GUCD1 | HTA11_2487_2000001011 | Human | Colorectum | SER | 2.77e-15 | 5.72e-01 | -0.1808 |
| 83606 | GUCD1 | HTA11_1938_2000001011 | Human | Colorectum | AD | 8.95e-09 | 3.30e-01 | -0.0811 |
| 83606 | GUCD1 | HTA11_78_2000001011 | Human | Colorectum | AD | 9.19e-08 | 2.63e-01 | -0.1088 |
| 83606 | GUCD1 | HTA11_347_2000001011 | Human | Colorectum | AD | 1.37e-25 | 5.19e-01 | -0.1954 |
| 83606 | GUCD1 | HTA11_411_2000001011 | Human | Colorectum | SER | 1.50e-08 | 1.05e+00 | -0.2602 |
| 83606 | GUCD1 | HTA11_2112_2000001011 | Human | Colorectum | SER | 4.98e-08 | 8.80e-01 | -0.2196 |
| 83606 | GUCD1 | HTA11_3361_2000001011 | Human | Colorectum | AD | 3.83e-11 | 4.40e-01 | -0.1207 |
| 83606 | GUCD1 | HTA11_83_2000001011 | Human | Colorectum | SER | 2.72e-07 | 3.33e-01 | -0.1526 |
| 83606 | GUCD1 | HTA11_696_2000001011 | Human | Colorectum | AD | 6.61e-20 | 4.70e-01 | -0.1464 |
| 83606 | GUCD1 | HTA11_866_2000001011 | Human | Colorectum | AD | 5.97e-07 | 2.86e-01 | -0.1001 |
| 83606 | GUCD1 | HTA11_1391_2000001011 | Human | Colorectum | AD | 8.84e-12 | 4.26e-01 | -0.059 |
| 83606 | GUCD1 | HTA11_2992_2000001011 | Human | Colorectum | SER | 8.76e-08 | 5.04e-01 | -0.1706 |
| 83606 | GUCD1 | HTA11_5212_2000001011 | Human | Colorectum | AD | 1.17e-08 | 4.70e-01 | -0.2061 |
| 83606 | GUCD1 | HTA11_546_2000001011 | Human | Colorectum | AD | 1.21e-02 | 2.13e-01 | -0.0842 |
| 83606 | GUCD1 | HTA11_7862_2000001011 | Human | Colorectum | AD | 7.90e-03 | 2.43e-01 | -0.0179 |
| 83606 | GUCD1 | HTA11_866_3004761011 | Human | Colorectum | AD | 3.48e-14 | 3.68e-01 | 0.096 |
| 83606 | GUCD1 | HTA11_8622_2000001021 | Human | Colorectum | SER | 1.32e-03 | 2.84e-01 | 0.0528 |
| 83606 | GUCD1 | HTA11_7663_2000001011 | Human | Colorectum | SER | 1.01e-04 | 4.59e-01 | 0.0131 |
| 83606 | GUCD1 | HTA11_6801_2000001011 | Human | Colorectum | SER | 3.75e-02 | 3.53e-01 | 0.0171 |
| 83606 | GUCD1 | HTA11_10711_2000001011 | Human | Colorectum | AD | 1.02e-02 | 1.59e-01 | 0.0338 |
| Page: 1 2 3 4 5 6 7 |
| Tissue | Expression Dynamics | Abbreviation |
| Colorectum (GSE201348) | 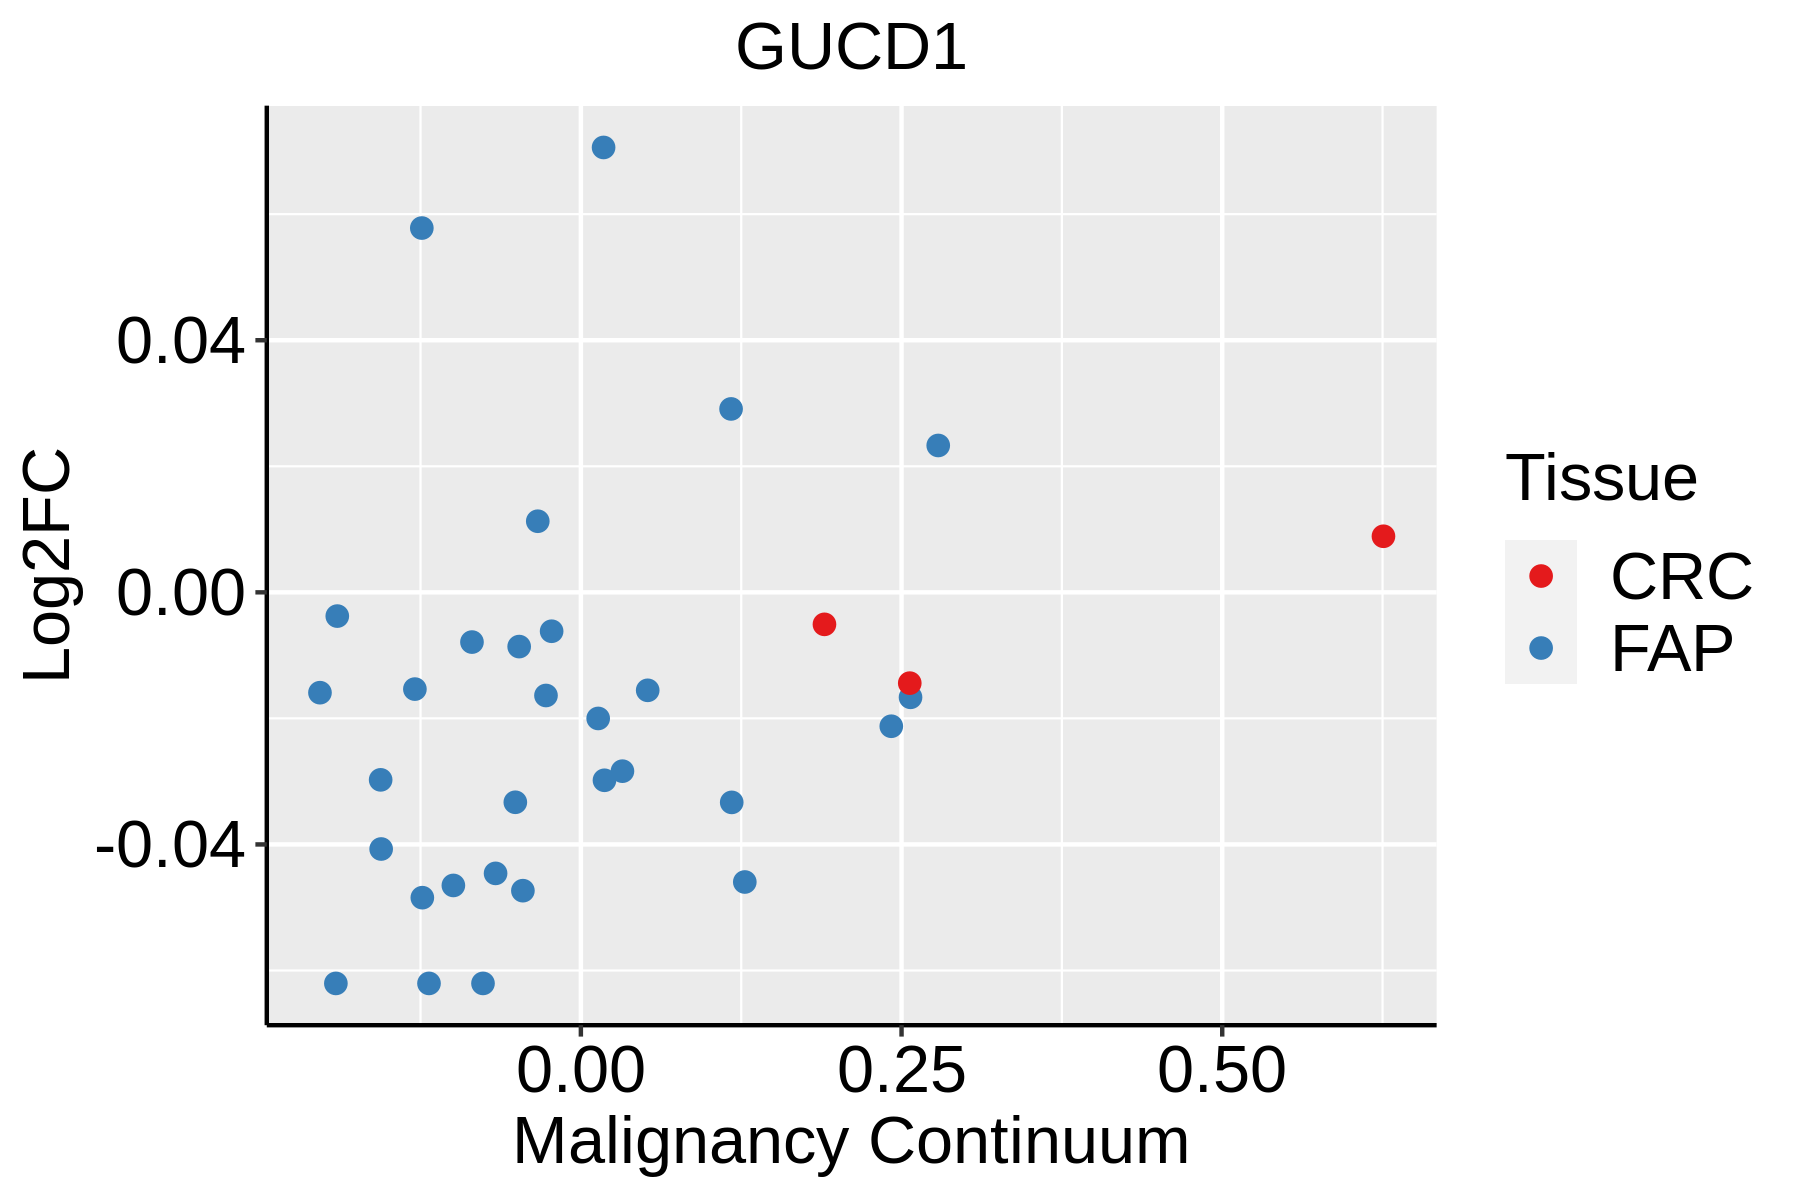 | FAP: Familial adenomatous polyposis |
| CRC: Colorectal cancer | ||
| Colorectum (HTA11) |  | AD: Adenomas |
| SER: Sessile serrated lesions | ||
| MSI-H: Microsatellite-high colorectal cancer | ||
| MSS: Microsatellite stable colorectal cancer | ||
| Esophagus | 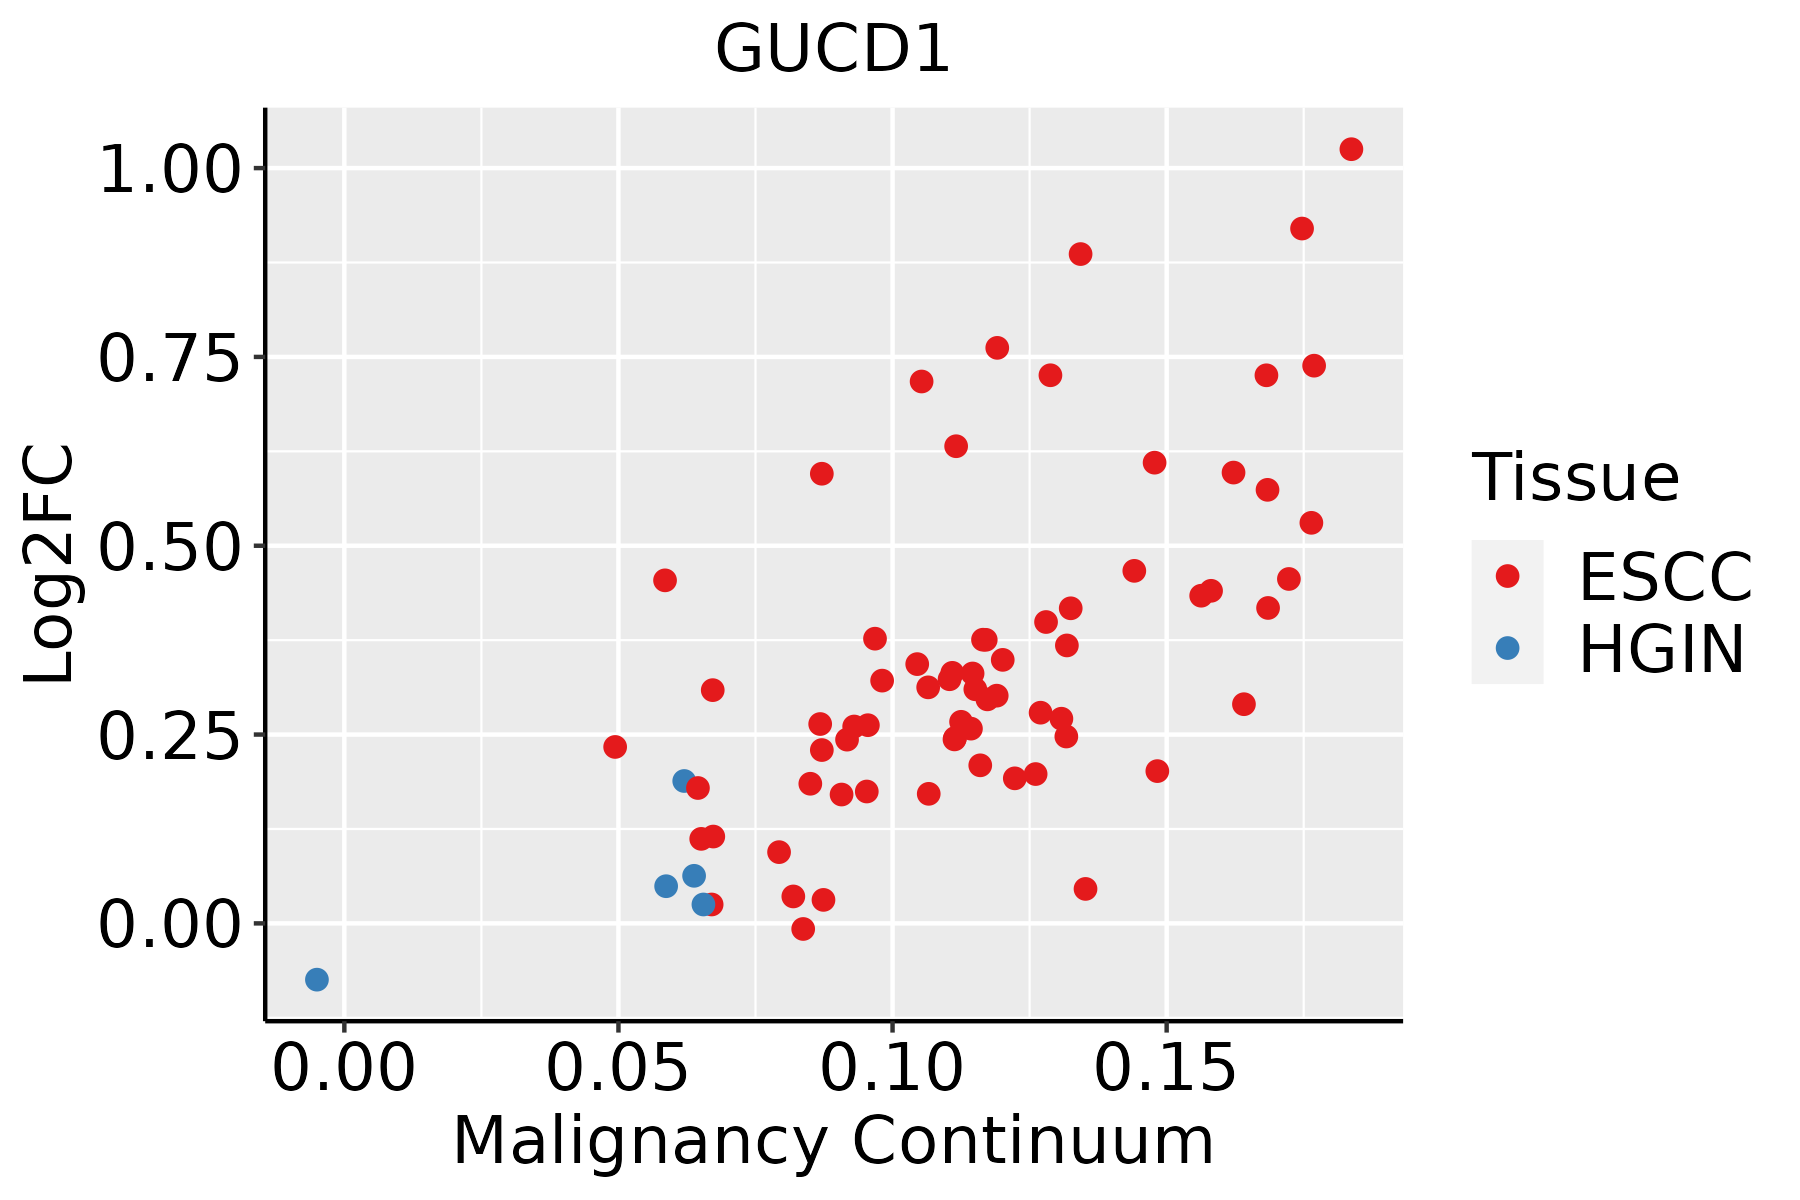 | ESCC: Esophageal squamous cell carcinoma |
| HGIN: High-grade intraepithelial neoplasias | ||
| LGIN: Low-grade intraepithelial neoplasias | ||
| Liver | 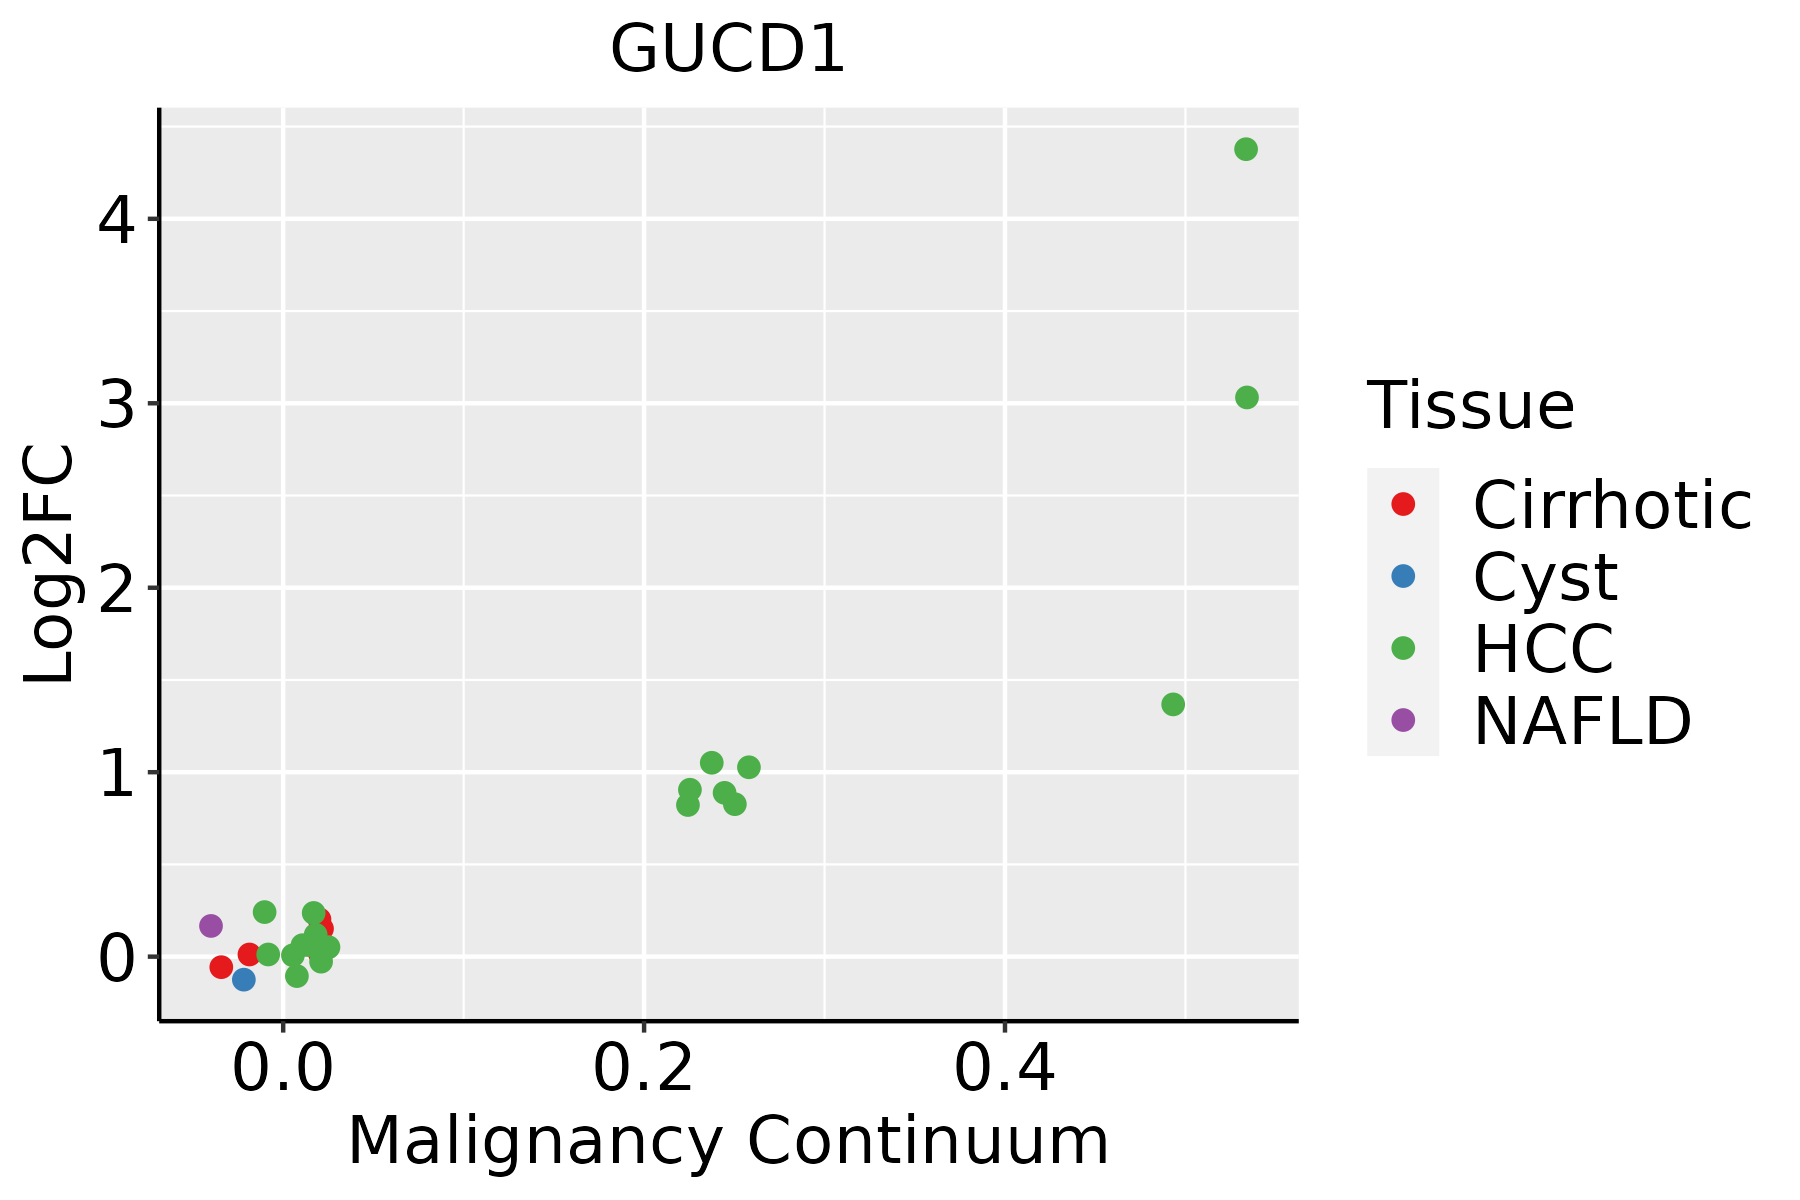 | HCC: Hepatocellular carcinoma |
| NAFLD: Non-alcoholic fatty liver disease | ||
| Oral Cavity | 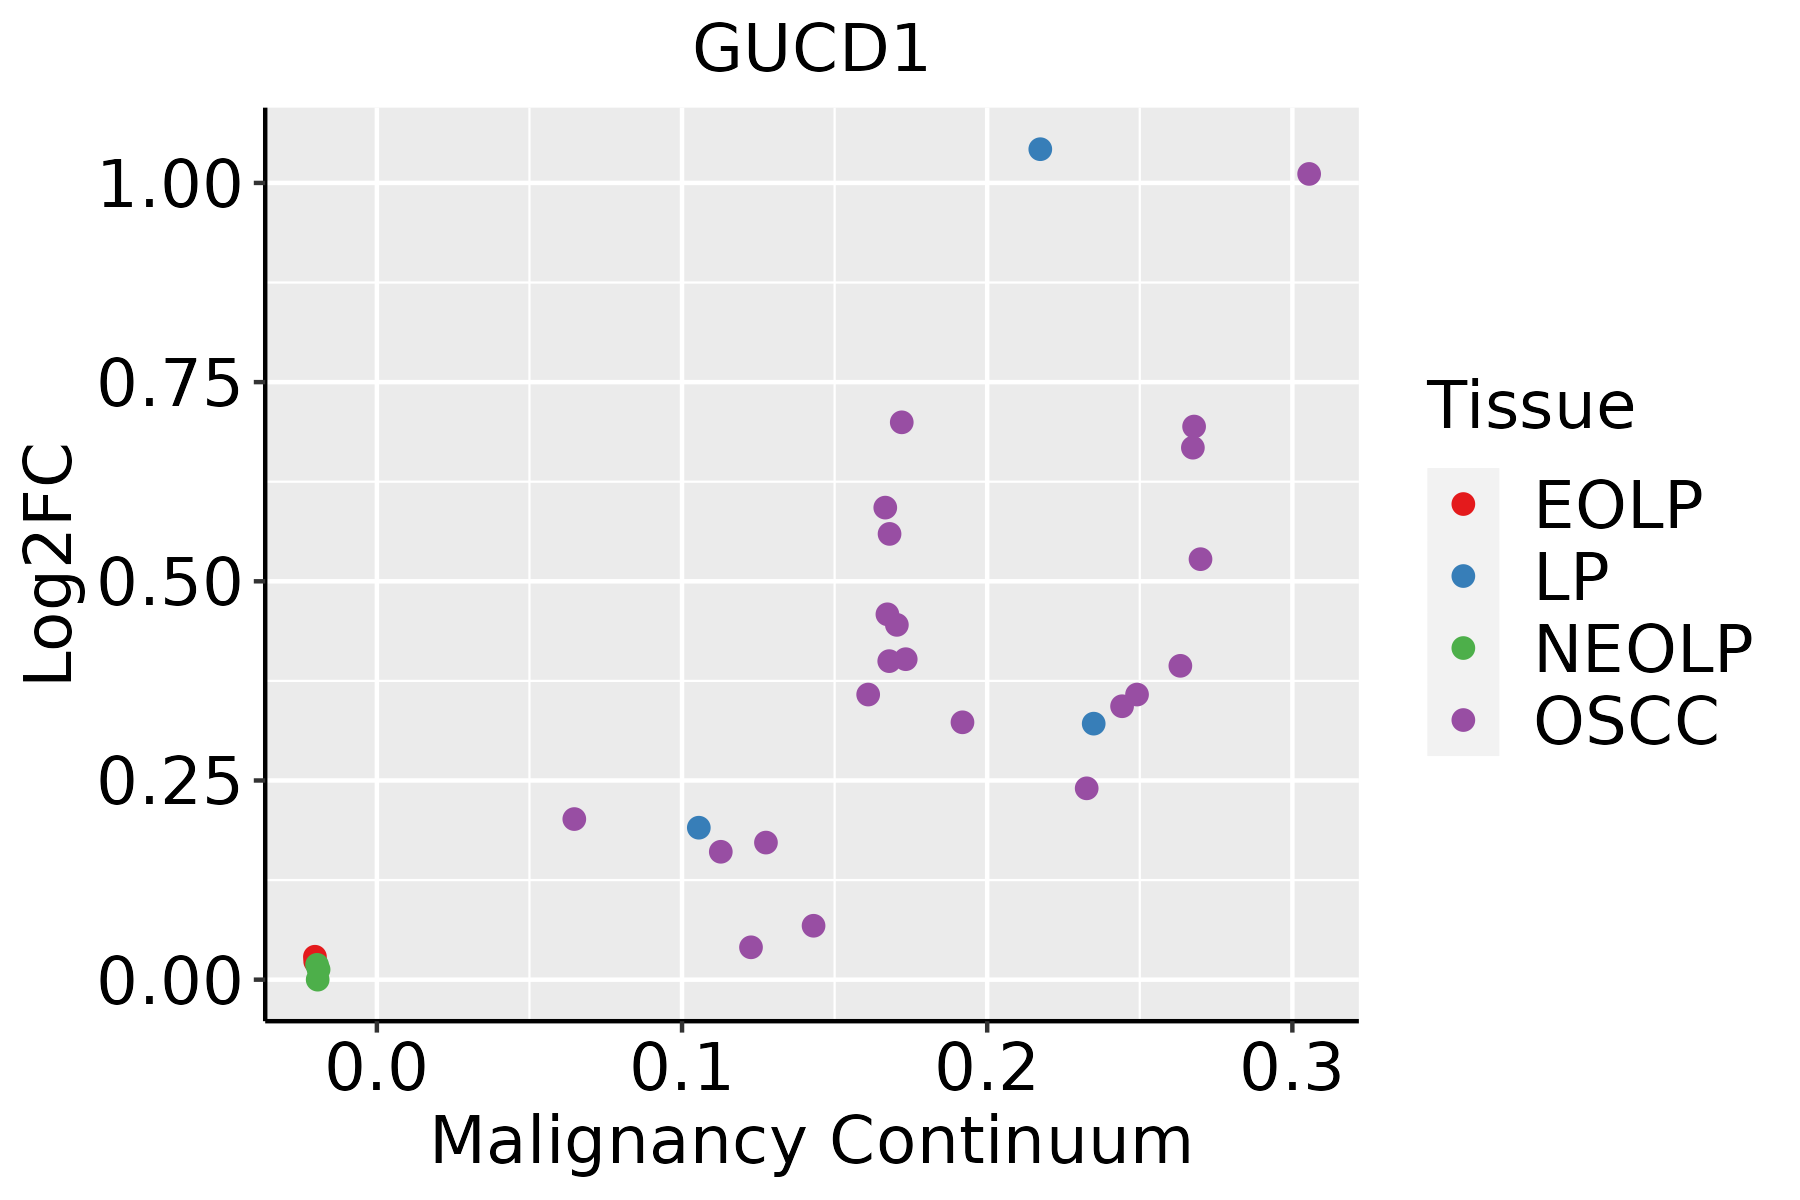 | EOLP: Erosive Oral lichen planus |
| LP: leukoplakia | ||
| NEOLP: Non-erosive oral lichen planus | ||
| OSCC: Oral squamous cell carcinoma | ||
| Skin |  | AK: Actinic keratosis |
| cSCC: Cutaneous squamous cell carcinoma | ||
| SCCIS:squamous cell carcinoma in situ |
| ∗log2FC in expression of this searched gene in stem-like cells from each diseased tissue sample relative to stem-like cells in normal samples in each tissue plotted against the malignancy continuum. Samples are colored based on if they are from different disease stage. |
Top |
Malignant transformation related pathway analysis |
| Find out the enriched GO biological processes and KEGG pathways involved in transition from healthy to precancer to cancer |
| Tissue | Disease Stage | Enriched GO biological Processes |
| Colorectum | AD |  |
| Colorectum | SER |  |
| Colorectum | MSS |  |
| Colorectum | MSI-H |  |
| Colorectum | FAP |  |
| ∗Top 15 enriched GO BP terms are showed in the bar plot of each disease state in each tissue. Each row represents a significant GO biological process which is colored according to the -log10(p.adjust). |
| Page: 1 2 3 4 5 6 7 8 9 |
| GO ID | Tissue | Disease Stage | Description | Gene Ratio | Bg Ratio | pvalue | p.adjust | Count |
| Page: 1 |
| Pathway ID | Tissue | Disease Stage | Description | Gene Ratio | Bg Ratio | pvalue | p.adjust | qvalue | Count |
| Page: 1 |
Top |
Cell-cell communication analysis |
| Identification of potential cell-cell interactions between two cell types and their ligand-receptor pairs for different disease states |
| Ligand | Receptor | LRpair | Pathway | Tissue | Disease Stage |
| Page: 1 |
Top |
Single-cell gene regulatory network inference analysis |
| Find out the significant the regulons (TFs) and the target genes of each regulon across cell types for different disease states |
| TF | Cell Type | Tissue | Disease Stage | Target Gene | RSS | Regulon Activity |
| ∗The dot plots of a searched regulon are shown for all cell subpopulations in each disease state of each tissue based on the regulon specific score inferred using pySCENIC and by calculating the average expression. |
| Page: 1 |
Top |
Somatic mutation of malignant transformation related genes |
| Annotation of somatic variants for genes involved in malignant transformation |
| Hugo Symbol | Variant Class | Variant Classification | dbSNP RS | HGVSc | HGVSp | HGVSp Short | SWISSPROT | BIOTYPE | SIFT | PolyPhen | Tumor Sample Barcode | Tissue | Histology | Sex | Age | Stage | Therapy Types | Drugs | Outcome |
| GUCD1 | SNV | Missense_Mutation | novel | c.515T>G | p.Phe172Cys | p.F172C | protein_coding | deleterious(0.02) | possibly_damaging(0.882) | TCGA-AN-A046-01 | Breast | breast invasive carcinoma | Female | >=65 | I/II | Unknown | Unknown | SD | |
| GUCD1 | SNV | Missense_Mutation | c.703N>T | p.Arg235Cys | p.R235C | protein_coding | deleterious(0.01) | benign(0.013) | TCGA-GM-A2D9-01 | Breast | breast invasive carcinoma | Female | >=65 | I/II | Hormone Therapy | arimidex | SD | ||
| GUCD1 | SNV | Missense_Mutation | rs747949402 | c.599N>G | p.His200Arg | p.H200R | protein_coding | tolerated(0.21) | possibly_damaging(0.457) | TCGA-A6-6780-01 | Colorectum | colon adenocarcinoma | Male | >=65 | I/II | Unknown | Unknown | SD | |
| GUCD1 | SNV | Missense_Mutation | novel | c.128N>T | p.Ala43Val | p.A43V | protein_coding | tolerated_low_confidence(0.3) | benign(0.003) | TCGA-CK-4951-01 | Colorectum | colon adenocarcinoma | Female | >=65 | I/II | Unknown | Unknown | PD | |
| GUCD1 | SNV | Missense_Mutation | novel | c.416N>A | p.Arg139His | p.R139H | protein_coding | tolerated(0.35) | benign(0.067) | TCGA-A5-A1OF-01 | Endometrium | uterine corpus endometrioid carcinoma | Female | <65 | I/II | Unknown | Unknown | SD | |
| GUCD1 | SNV | Missense_Mutation | novel | c.824N>C | p.Asn275Thr | p.N275T | protein_coding | tolerated(0.19) | possibly_damaging(0.889) | TCGA-A5-A2K5-01 | Endometrium | uterine corpus endometrioid carcinoma | Female | >=65 | I/II | Unknown | Unknown | SD | |
| GUCD1 | SNV | Missense_Mutation | c.863A>G | p.Asp288Gly | p.D288G | protein_coding | deleterious(0) | probably_damaging(0.987) | TCGA-AP-A0LM-01 | Endometrium | uterine corpus endometrioid carcinoma | Female | <65 | III/IV | Chemotherapy | cisplatin | SD | ||
| GUCD1 | SNV | Missense_Mutation | c.496A>G | p.Thr166Ala | p.T166A | protein_coding | tolerated(0.65) | benign(0.039) | TCGA-AP-A0LM-01 | Endometrium | uterine corpus endometrioid carcinoma | Female | <65 | III/IV | Chemotherapy | cisplatin | SD | ||
| GUCD1 | SNV | Missense_Mutation | rs141621665 | c.733N>A | p.Val245Met | p.V245M | protein_coding | deleterious(0) | probably_damaging(0.992) | TCGA-AP-A1DK-01 | Endometrium | uterine corpus endometrioid carcinoma | Female | <65 | I/II | Unknown | Unknown | SD | |
| GUCD1 | SNV | Missense_Mutation | rs191716304 | c.499N>T | p.Arg167Trp | p.R167W | protein_coding | deleterious(0) | probably_damaging(1) | TCGA-AX-A05U-01 | Endometrium | uterine corpus endometrioid carcinoma | Female | <65 | I/II | Unknown | Unknown | SD |
| Page: 1 2 3 |
Top |
Related drugs of malignant transformation related genes |
| Identification of chemicals and drugs interact with genes involved in malignant transfromation |
| (DGIdb 4.0) |
| Entrez ID | Symbol | Category | Interaction Types | Drug Claim Name | Drug Name | PMIDs |
| Page: 1 |

Copyright 2023-Present -The University of Texas Health Science Center at Houston |