
|
|||||
|
 | |
| |
| |
| |
| |
| |
|
Gene: GUCA2A |
Gene summary for GUCA2A |
| Gene information | Species | Human | Gene symbol | GUCA2A | Gene ID | 2980 |
| Gene name | guanylate cyclase activator 2A | |
| Gene Alias | GCAP-I | |
| Cytomap | 1p34.2 | |
| Gene Type | protein-coding | GO ID | GO:0006139 | UniProtAcc | Q02747 |
Top |
Malignant transformation analysis |
| Identification of the aberrant gene expression in precancerous and cancerous lesions by comparing the gene expression of stem-like cells in diseased tissues with normal stem cells |
| Entrez ID | Symbol | Replicates | Species | Organ | Tissue | Adj P-value | Log2FC | Malignancy |
| 2980 | GUCA2A | HTA11_3410_2000001011 | Human | Colorectum | AD | 4.43e-19 | -6.05e-01 | 0.0155 |
| 2980 | GUCA2A | HTA11_2487_2000001011 | Human | Colorectum | SER | 2.36e-05 | 1.52e+00 | -0.1808 |
| 2980 | GUCA2A | HTA11_1938_2000001011 | Human | Colorectum | AD | 2.36e-11 | -6.33e-01 | -0.0811 |
| 2980 | GUCA2A | HTA11_78_2000001011 | Human | Colorectum | AD | 4.32e-14 | -5.50e-01 | -0.1088 |
| 2980 | GUCA2A | HTA11_347_2000001011 | Human | Colorectum | AD | 3.02e-02 | 1.09e+00 | -0.1954 |
| 2980 | GUCA2A | HTA11_2112_2000001011 | Human | Colorectum | SER | 1.40e-02 | 2.03e+00 | -0.2196 |
| 2980 | GUCA2A | HTA11_3361_2000001011 | Human | Colorectum | AD | 6.94e-03 | 1.11e+00 | -0.1207 |
| 2980 | GUCA2A | HTA11_696_2000001011 | Human | Colorectum | AD | 6.87e-03 | 8.94e-01 | -0.1464 |
| 2980 | GUCA2A | HTA11_5212_2000001011 | Human | Colorectum | AD | 2.65e-12 | 2.54e+00 | -0.2061 |
| 2980 | GUCA2A | HTA11_5216_2000001011 | Human | Colorectum | SER | 1.35e-02 | 1.33e+00 | -0.1462 |
| 2980 | GUCA2A | HTA11_866_3004761011 | Human | Colorectum | AD | 1.95e-22 | -6.33e-01 | 0.096 |
| 2980 | GUCA2A | HTA11_8622_2000001021 | Human | Colorectum | SER | 3.48e-03 | -6.09e-01 | 0.0528 |
| 2980 | GUCA2A | HTA11_10623_2000001011 | Human | Colorectum | AD | 3.93e-03 | -5.89e-01 | -0.0177 |
| 2980 | GUCA2A | HTA11_10711_2000001011 | Human | Colorectum | AD | 5.59e-14 | -6.33e-01 | 0.0338 |
| 2980 | GUCA2A | HTA11_7696_3000711011 | Human | Colorectum | AD | 1.89e-27 | -6.29e-01 | 0.0674 |
| 2980 | GUCA2A | HTA11_6818_2000001011 | Human | Colorectum | AD | 2.76e-06 | -6.33e-01 | 0.0112 |
| 2980 | GUCA2A | HTA11_6818_2000001021 | Human | Colorectum | AD | 8.78e-11 | -6.33e-01 | 0.0588 |
| 2980 | GUCA2A | HTA11_99999970781_79442 | Human | Colorectum | MSS | 1.96e-15 | -5.96e-01 | 0.294 |
| 2980 | GUCA2A | HTA11_99999965104_69814 | Human | Colorectum | MSS | 5.08e-06 | -5.22e-01 | 0.281 |
| 2980 | GUCA2A | HTA11_99999971662_82457 | Human | Colorectum | MSS | 3.04e-21 | -6.18e-01 | 0.3859 |
| Page: 1 2 3 |
| Tissue | Expression Dynamics | Abbreviation |
| Colorectum (GSE201348) |  | FAP: Familial adenomatous polyposis |
| CRC: Colorectal cancer | ||
| Colorectum (HTA11) | 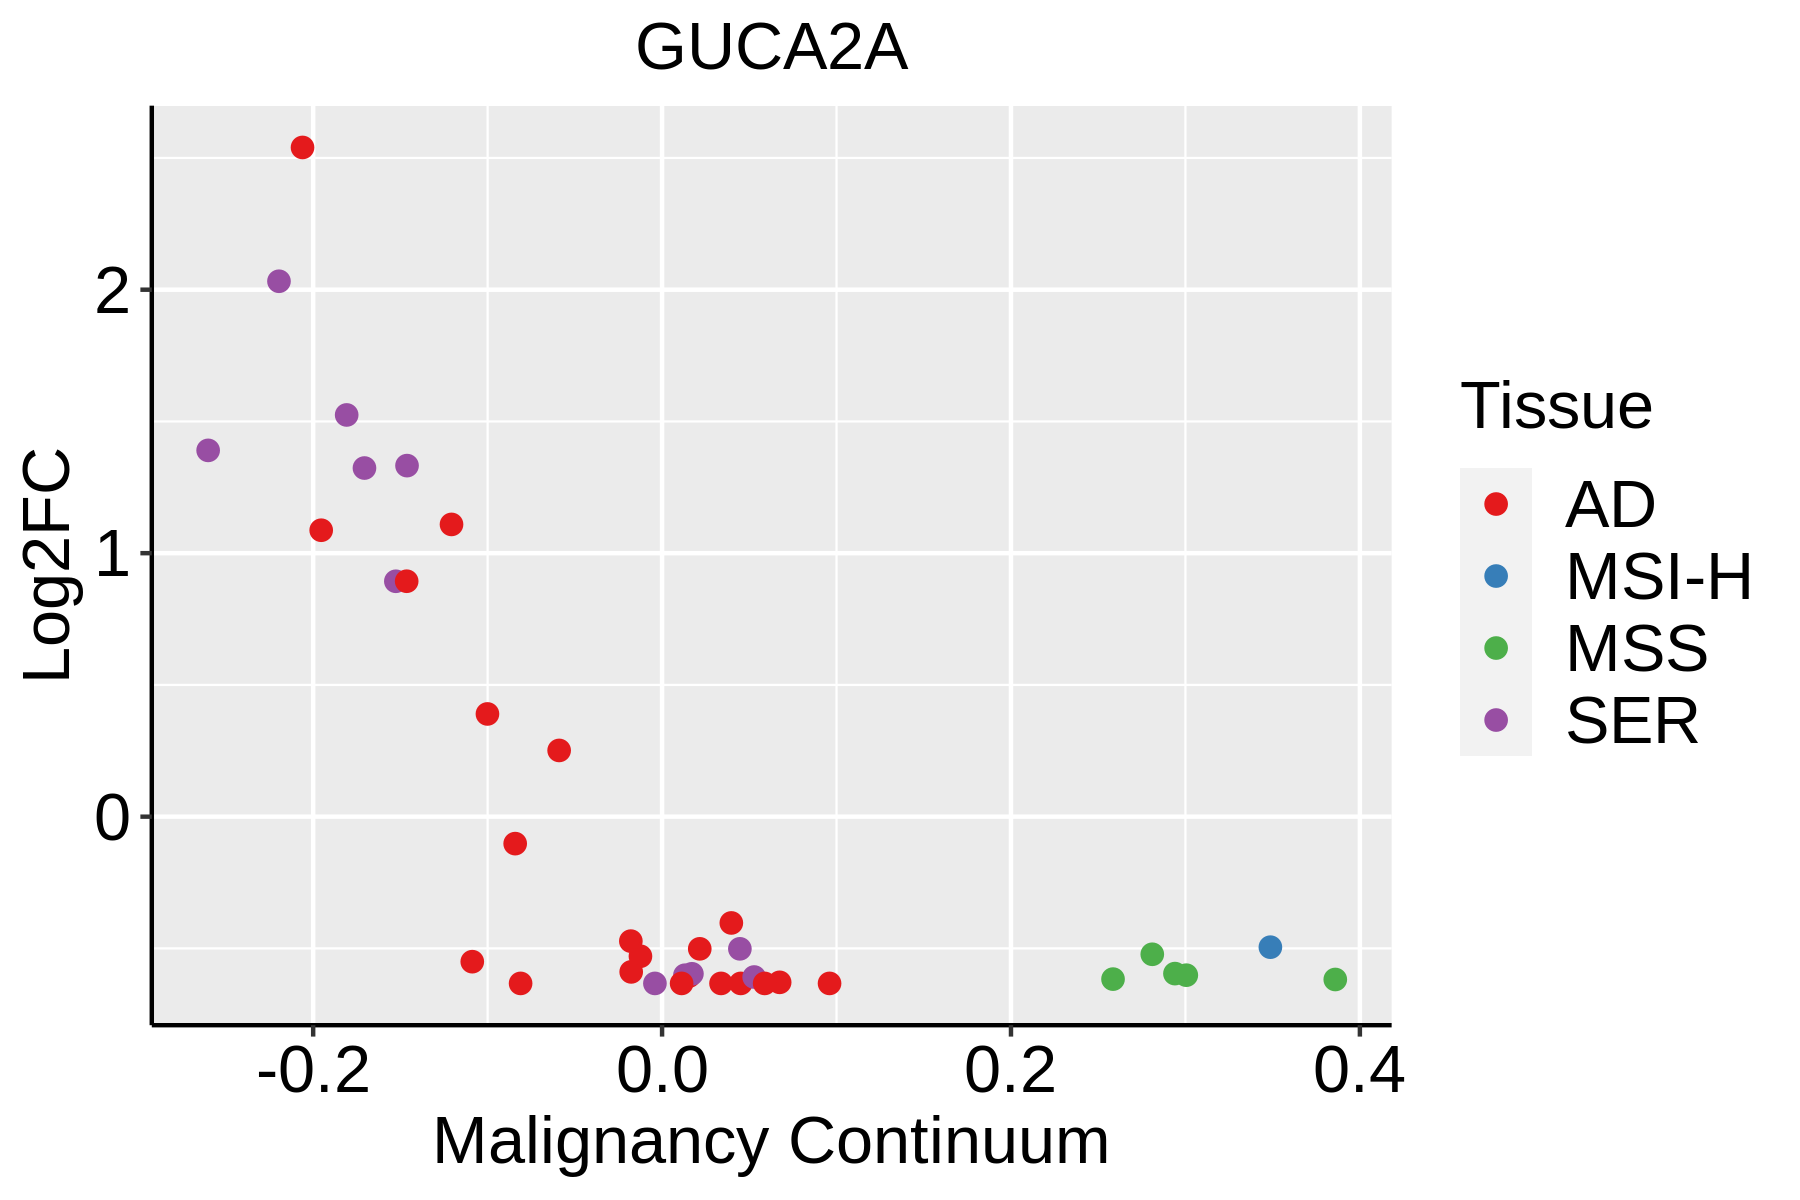 | AD: Adenomas |
| SER: Sessile serrated lesions | ||
| MSI-H: Microsatellite-high colorectal cancer | ||
| MSS: Microsatellite stable colorectal cancer |
| ∗log2FC in expression of this searched gene in stem-like cells from each diseased tissue sample relative to stem-like cells in normal samples in each tissue plotted against the malignancy continuum. Samples are colored based on if they are from different disease stage. |
Top |
Malignant transformation related pathway analysis |
| Find out the enriched GO biological processes and KEGG pathways involved in transition from healthy to precancer to cancer |
| Tissue | Disease Stage | Enriched GO biological Processes |
| Colorectum | AD |  |
| Colorectum | SER |  |
| Colorectum | MSS |  |
| Colorectum | MSI-H |  |
| Colorectum | FAP |  |
| ∗Top 15 enriched GO BP terms are showed in the bar plot of each disease state in each tissue. Each row represents a significant GO biological process which is colored according to the -log10(p.adjust). |
| Page: 1 2 3 4 5 6 7 8 9 |
| GO ID | Tissue | Disease Stage | Description | Gene Ratio | Bg Ratio | pvalue | p.adjust | Count |
| GO:0006163 | Colorectum | AD | purine nucleotide metabolic process | 149/3918 | 396/18723 | 1.08e-14 | 2.80e-12 | 149 |
| GO:0072521 | Colorectum | AD | purine-containing compound metabolic process | 153/3918 | 416/18723 | 4.34e-14 | 1.01e-11 | 153 |
| GO:0009117 | Colorectum | AD | nucleotide metabolic process | 168/3918 | 489/18723 | 2.20e-12 | 3.36e-10 | 168 |
| GO:0006753 | Colorectum | AD | nucleoside phosphate metabolic process | 169/3918 | 497/18723 | 4.99e-12 | 6.98e-10 | 169 |
| GO:0006164 | Colorectum | AD | purine nucleotide biosynthetic process | 66/3918 | 191/18723 | 8.22e-06 | 1.97e-04 | 66 |
| GO:0072522 | Colorectum | AD | purine-containing compound biosynthetic process | 68/3918 | 200/18723 | 1.12e-05 | 2.55e-04 | 68 |
| GO:1901293 | Colorectum | AD | nucleoside phosphate biosynthetic process | 80/3918 | 256/18723 | 6.31e-05 | 1.05e-03 | 80 |
| GO:0009165 | Colorectum | AD | nucleotide biosynthetic process | 79/3918 | 254/18723 | 8.33e-05 | 1.30e-03 | 79 |
| GO:0062012 | Colorectum | AD | regulation of small molecule metabolic process | 93/3918 | 334/18723 | 1.46e-03 | 1.24e-02 | 93 |
| GO:0045981 | Colorectum | AD | positive regulation of nucleotide metabolic process | 17/3918 | 43/18723 | 4.15e-03 | 2.87e-02 | 17 |
| GO:1900544 | Colorectum | AD | positive regulation of purine nucleotide metabolic process | 17/3918 | 43/18723 | 4.15e-03 | 2.87e-02 | 17 |
| GO:00061631 | Colorectum | SER | purine nucleotide metabolic process | 109/2897 | 396/18723 | 4.26e-10 | 5.44e-08 | 109 |
| GO:00725211 | Colorectum | SER | purine-containing compound metabolic process | 113/2897 | 416/18723 | 4.80e-10 | 5.68e-08 | 113 |
| GO:00091171 | Colorectum | SER | nucleotide metabolic process | 122/2897 | 489/18723 | 2.50e-08 | 1.76e-06 | 122 |
| GO:00067531 | Colorectum | SER | nucleoside phosphate metabolic process | 122/2897 | 497/18723 | 6.64e-08 | 4.33e-06 | 122 |
| GO:00725221 | Colorectum | SER | purine-containing compound biosynthetic process | 51/2897 | 200/18723 | 1.55e-04 | 3.01e-03 | 51 |
| GO:00061641 | Colorectum | SER | purine nucleotide biosynthetic process | 49/2897 | 191/18723 | 1.77e-04 | 3.30e-03 | 49 |
| GO:00091651 | Colorectum | SER | nucleotide biosynthetic process | 58/2897 | 254/18723 | 1.21e-03 | 1.38e-02 | 58 |
| GO:19012931 | Colorectum | SER | nucleoside phosphate biosynthetic process | 58/2897 | 256/18723 | 1.47e-03 | 1.59e-02 | 58 |
| GO:00061632 | Colorectum | MSS | purine nucleotide metabolic process | 128/3467 | 396/18723 | 2.04e-11 | 3.02e-09 | 128 |
| Page: 1 2 3 |
| Pathway ID | Tissue | Disease Stage | Description | Gene Ratio | Bg Ratio | pvalue | p.adjust | qvalue | Count |
| Page: 1 |
Top |
Cell-cell communication analysis |
| Identification of potential cell-cell interactions between two cell types and their ligand-receptor pairs for different disease states |
| Ligand | Receptor | LRpair | Pathway | Tissue | Disease Stage |
| GUCA2A | GUCY2C | GUCA2A_GUCY2C | GUCA | CRC | AD |
| GUCA2A | GUCY2C | GUCA2A_GUCY2C | GUCA | CRC | ADJ |
| GUCA2A | GUCY2C | GUCA2A_GUCY2C | GUCA | CRC | FAP |
| GUCA2A | GUCY2C | GUCA2A_GUCY2C | GUCA | CRC | Healthy |
| GUCA2A | GUCY2C | GUCA2A_GUCY2C | GUCA | CRC | MSS |
| GUCA2A | GUCY2C | GUCA2A_GUCY2C | GUCA | CRC | SER |
| Page: 1 |
Top |
Single-cell gene regulatory network inference analysis |
| Find out the significant the regulons (TFs) and the target genes of each regulon across cell types for different disease states |
| TF | Cell Type | Tissue | Disease Stage | Target Gene | RSS | Regulon Activity |
| ∗The dot plots of a searched regulon are shown for all cell subpopulations in each disease state of each tissue based on the regulon specific score inferred using pySCENIC and by calculating the average expression. |
| Page: 1 |
Top |
Somatic mutation of malignant transformation related genes |
| Annotation of somatic variants for genes involved in malignant transformation |
| Hugo Symbol | Variant Class | Variant Classification | dbSNP RS | HGVSc | HGVSp | HGVSp Short | SWISSPROT | BIOTYPE | SIFT | PolyPhen | Tumor Sample Barcode | Tissue | Histology | Sex | Age | Stage | Therapy Types | Drugs | Outcome |
| GUCA2A | SNV | Missense_Mutation | novel | c.120A>T | p.Lys40Asn | p.K40N | Q02747 | protein_coding | deleterious(0) | probably_damaging(0.977) | TCGA-EW-A3U0-01 | Breast | breast invasive carcinoma | Female | <65 | III/IV | Chemotherapy | cisplatin | CR |
| GUCA2A | SNV | Missense_Mutation | novel | c.286G>A | p.Glu96Lys | p.E96K | Q02747 | protein_coding | tolerated(0.52) | benign(0.025) | TCGA-AA-A00N-01 | Colorectum | colon adenocarcinoma | Male | >=65 | I/II | Unknown | Unknown | PD |
| GUCA2A | SNV | Missense_Mutation | novel | c.251N>G | p.Glu84Gly | p.E84G | Q02747 | protein_coding | deleterious(0.02) | possibly_damaging(0.583) | TCGA-A5-A0G1-01 | Endometrium | uterine corpus endometrioid carcinoma | Female | >=65 | I/II | Unknown | Unknown | SD |
| GUCA2A | SNV | Missense_Mutation | rs764772255 | c.292G>A | p.Ala98Thr | p.A98T | Q02747 | protein_coding | deleterious(0.01) | probably_damaging(0.998) | TCGA-AX-A1CE-01 | Endometrium | uterine corpus endometrioid carcinoma | Female | <65 | I/II | Unspecific | Paclitaxel | SD |
| GUCA2A | SNV | Missense_Mutation | rs182438227 | c.302N>T | p.Pro101Leu | p.P101L | Q02747 | protein_coding | deleterious(0.02) | possibly_damaging(0.859) | TCGA-B5-A5OE-01 | Endometrium | uterine corpus endometrioid carcinoma | Female | >=65 | III/IV | Chemotherapy | carboplatin | SD |
| GUCA2A | SNV | Missense_Mutation | novel | c.148G>T | p.Val50Phe | p.V50F | Q02747 | protein_coding | tolerated(0.4) | benign(0.06) | TCGA-DD-A4NS-01 | Liver | liver hepatocellular carcinoma | Female | <65 | I/II | Targeted Molecular therapy | sorafenib | PD |
| GUCA2A | SNV | Missense_Mutation | novel | c.147G>T | p.Arg49Ser | p.R49S | Q02747 | protein_coding | tolerated(0.35) | benign(0.005) | TCGA-DD-A4NS-01 | Liver | liver hepatocellular carcinoma | Female | <65 | I/II | Targeted Molecular therapy | sorafenib | PD |
| GUCA2A | SNV | Missense_Mutation | novel | c.237G>T | p.Lys79Asn | p.K79N | Q02747 | protein_coding | deleterious(0.01) | possibly_damaging(0.759) | TCGA-DD-AACX-01 | Liver | liver hepatocellular carcinoma | Male | >=65 | I/II | Unknown | Unknown | PD |
| GUCA2A | SNV | Missense_Mutation | novel | c.173N>A | p.Pro58His | p.P58H | Q02747 | protein_coding | tolerated(0.06) | possibly_damaging(0.552) | TCGA-CV-7100-01 | Oral cavity | head & neck squamous cell carcinoma | Male | >=65 | III/IV | Unknown | Unknown | PD |
| GUCA2A | SNV | Missense_Mutation | novel | c.233N>A | p.Leu78His | p.L78H | Q02747 | protein_coding | deleterious(0) | probably_damaging(0.992) | TCGA-F1-6874-01 | Stomach | stomach adenocarcinoma | Male | >=65 | I/II | Unknown | Unknown | SD |
| Page: 1 |
Top |
Related drugs of malignant transformation related genes |
| Identification of chemicals and drugs interact with genes involved in malignant transfromation |
| (DGIdb 4.0) |
| Entrez ID | Symbol | Category | Interaction Types | Drug Claim Name | Drug Name | PMIDs |
| 2980 | GUCA2A | DRUGGABLE GENOME, ENZYME, HORMONE ACTIVITY | SALT | VOLANESORSEN SODIUM | 10564101 | |
| 2980 | GUCA2A | DRUGGABLE GENOME, ENZYME, HORMONE ACTIVITY | LACTOSE | LACTOSE, ANHYDROUS | 11677212 | |
| 2980 | GUCA2A | DRUGGABLE GENOME, ENZYME, HORMONE ACTIVITY | ATROPINE | ATROPINE | 9623669 |
| Page: 1 |

Copyright 2023-Present -The University of Texas Health Science Center at Houston |