
|
|||||
|
 | |
| |
| |
| |
| |
| |
|
Gene: GTSE1 |
Gene summary for GTSE1 |
| Gene information | Species | Human | Gene symbol | GTSE1 | Gene ID | 51512 |
| Gene name | G2 and S-phase expressed 1 | |
| Gene Alias | B99 | |
| Cytomap | 22q13.31 | |
| Gene Type | protein-coding | GO ID | GO:0000075 | UniProtAcc | Q9NYZ3 |
Top |
Malignant transformation analysis |
| Identification of the aberrant gene expression in precancerous and cancerous lesions by comparing the gene expression of stem-like cells in diseased tissues with normal stem cells |
| Entrez ID | Symbol | Replicates | Species | Organ | Tissue | Adj P-value | Log2FC | Malignancy |
| 51512 | GTSE1 | LZE21T | Human | Esophagus | ESCC | 8.02e-04 | 2.98e-01 | 0.0655 |
| 51512 | GTSE1 | P1T-E | Human | Esophagus | ESCC | 4.62e-03 | 2.58e-01 | 0.0875 |
| 51512 | GTSE1 | P2T-E | Human | Esophagus | ESCC | 9.56e-08 | 3.54e-01 | 0.1177 |
| 51512 | GTSE1 | P4T-E | Human | Esophagus | ESCC | 3.48e-08 | 2.66e-01 | 0.1323 |
| 51512 | GTSE1 | P5T-E | Human | Esophagus | ESCC | 2.06e-08 | 2.18e-01 | 0.1327 |
| 51512 | GTSE1 | P8T-E | Human | Esophagus | ESCC | 3.50e-02 | 1.25e-01 | 0.0889 |
| 51512 | GTSE1 | P10T-E | Human | Esophagus | ESCC | 4.41e-07 | 4.18e-01 | 0.116 |
| 51512 | GTSE1 | P16T-E | Human | Esophagus | ESCC | 8.40e-04 | 1.21e-01 | 0.1153 |
| 51512 | GTSE1 | P17T-E | Human | Esophagus | ESCC | 7.64e-08 | 4.95e-01 | 0.1278 |
| 51512 | GTSE1 | P22T-E | Human | Esophagus | ESCC | 1.66e-02 | 2.05e-01 | 0.1236 |
| 51512 | GTSE1 | P24T-E | Human | Esophagus | ESCC | 8.84e-05 | 1.94e-01 | 0.1287 |
| 51512 | GTSE1 | P28T-E | Human | Esophagus | ESCC | 9.44e-07 | 1.96e-01 | 0.1149 |
| 51512 | GTSE1 | P30T-E | Human | Esophagus | ESCC | 4.84e-02 | 3.05e-01 | 0.137 |
| 51512 | GTSE1 | P31T-E | Human | Esophagus | ESCC | 3.75e-03 | 1.92e-01 | 0.1251 |
| 51512 | GTSE1 | P32T-E | Human | Esophagus | ESCC | 1.47e-14 | 4.09e-01 | 0.1666 |
| 51512 | GTSE1 | P37T-E | Human | Esophagus | ESCC | 3.34e-07 | 2.31e-01 | 0.1371 |
| 51512 | GTSE1 | P38T-E | Human | Esophagus | ESCC | 2.66e-02 | 1.59e-01 | 0.127 |
| 51512 | GTSE1 | P44T-E | Human | Esophagus | ESCC | 2.47e-02 | 1.37e-01 | 0.1096 |
| 51512 | GTSE1 | P52T-E | Human | Esophagus | ESCC | 9.35e-10 | 3.16e-01 | 0.1555 |
| 51512 | GTSE1 | P56T-E | Human | Esophagus | ESCC | 1.10e-03 | 6.01e-01 | 0.1613 |
| Page: 1 2 3 |
| Tissue | Expression Dynamics | Abbreviation |
| Esophagus | 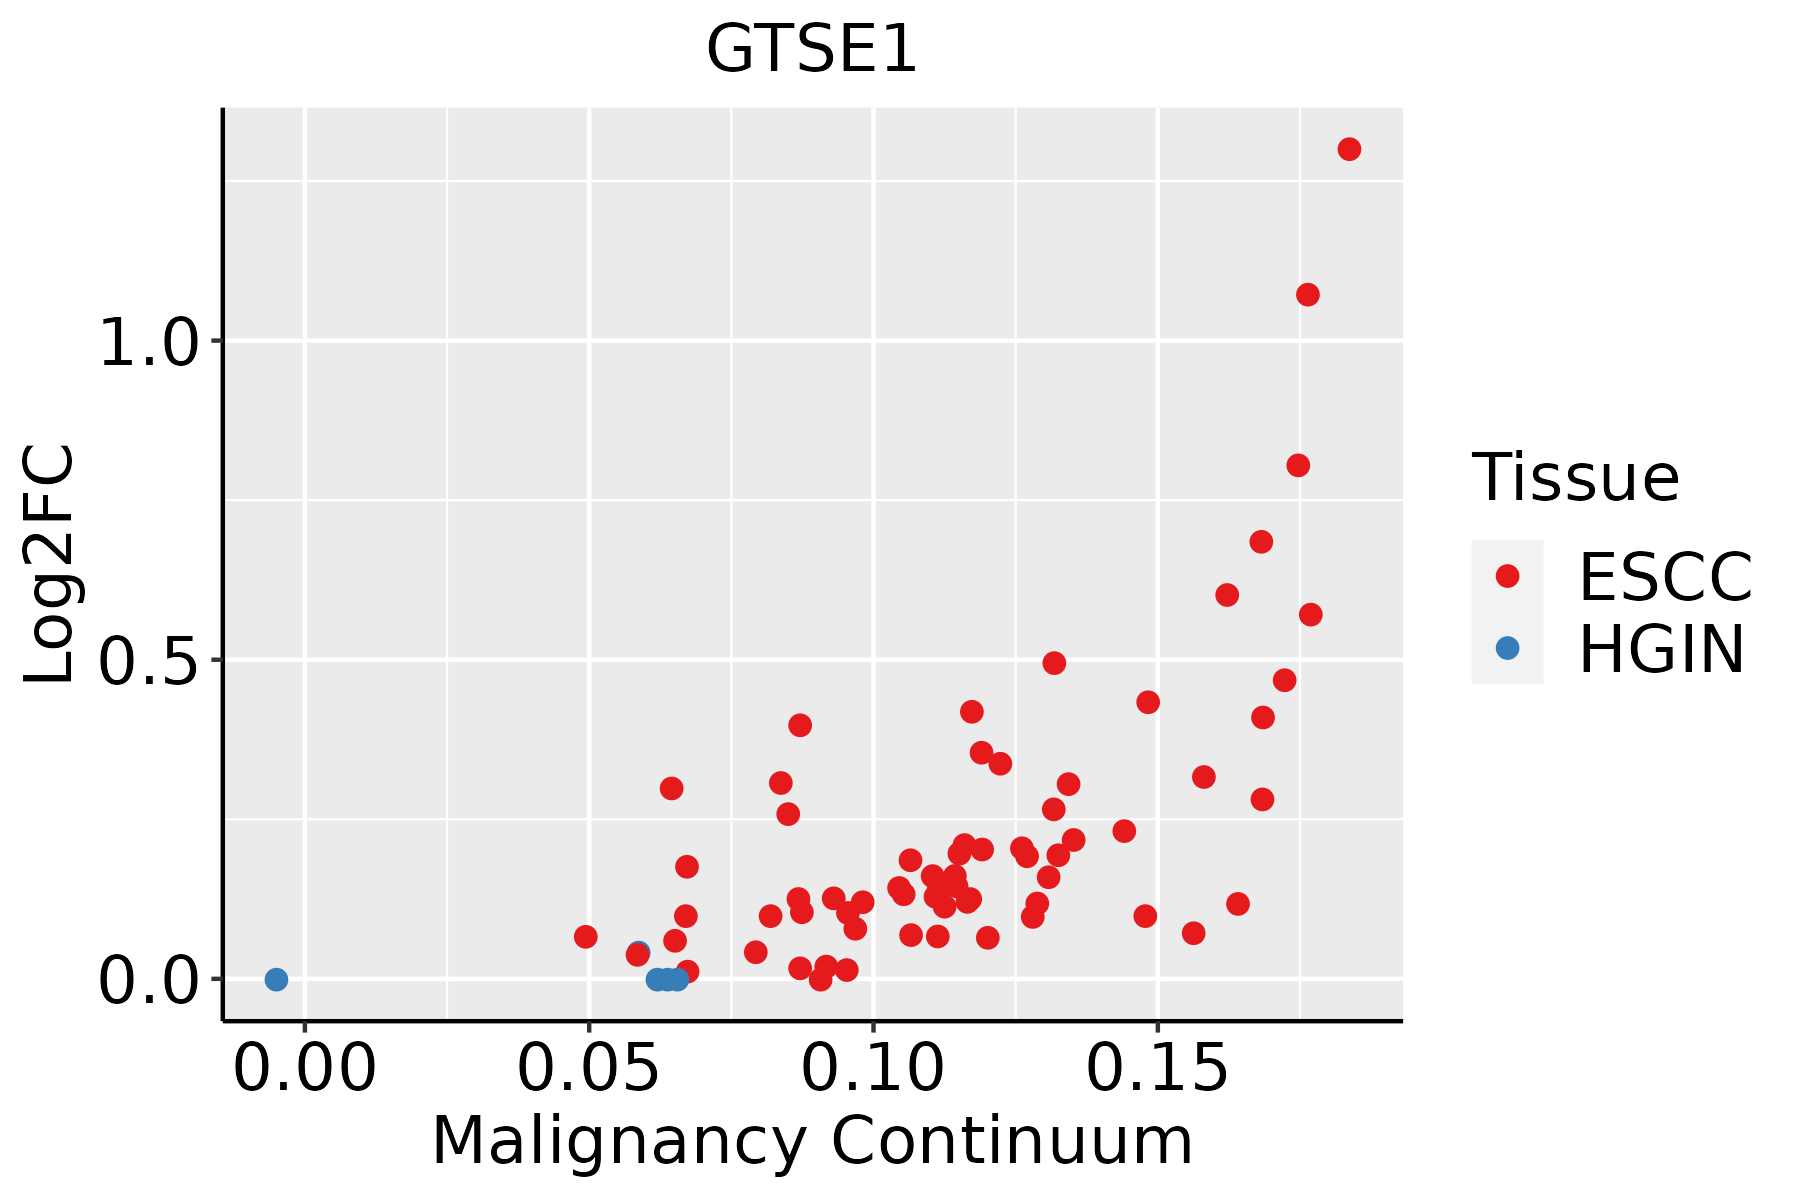 | ESCC: Esophageal squamous cell carcinoma |
| HGIN: High-grade intraepithelial neoplasias | ||
| LGIN: Low-grade intraepithelial neoplasias | ||
| Liver | 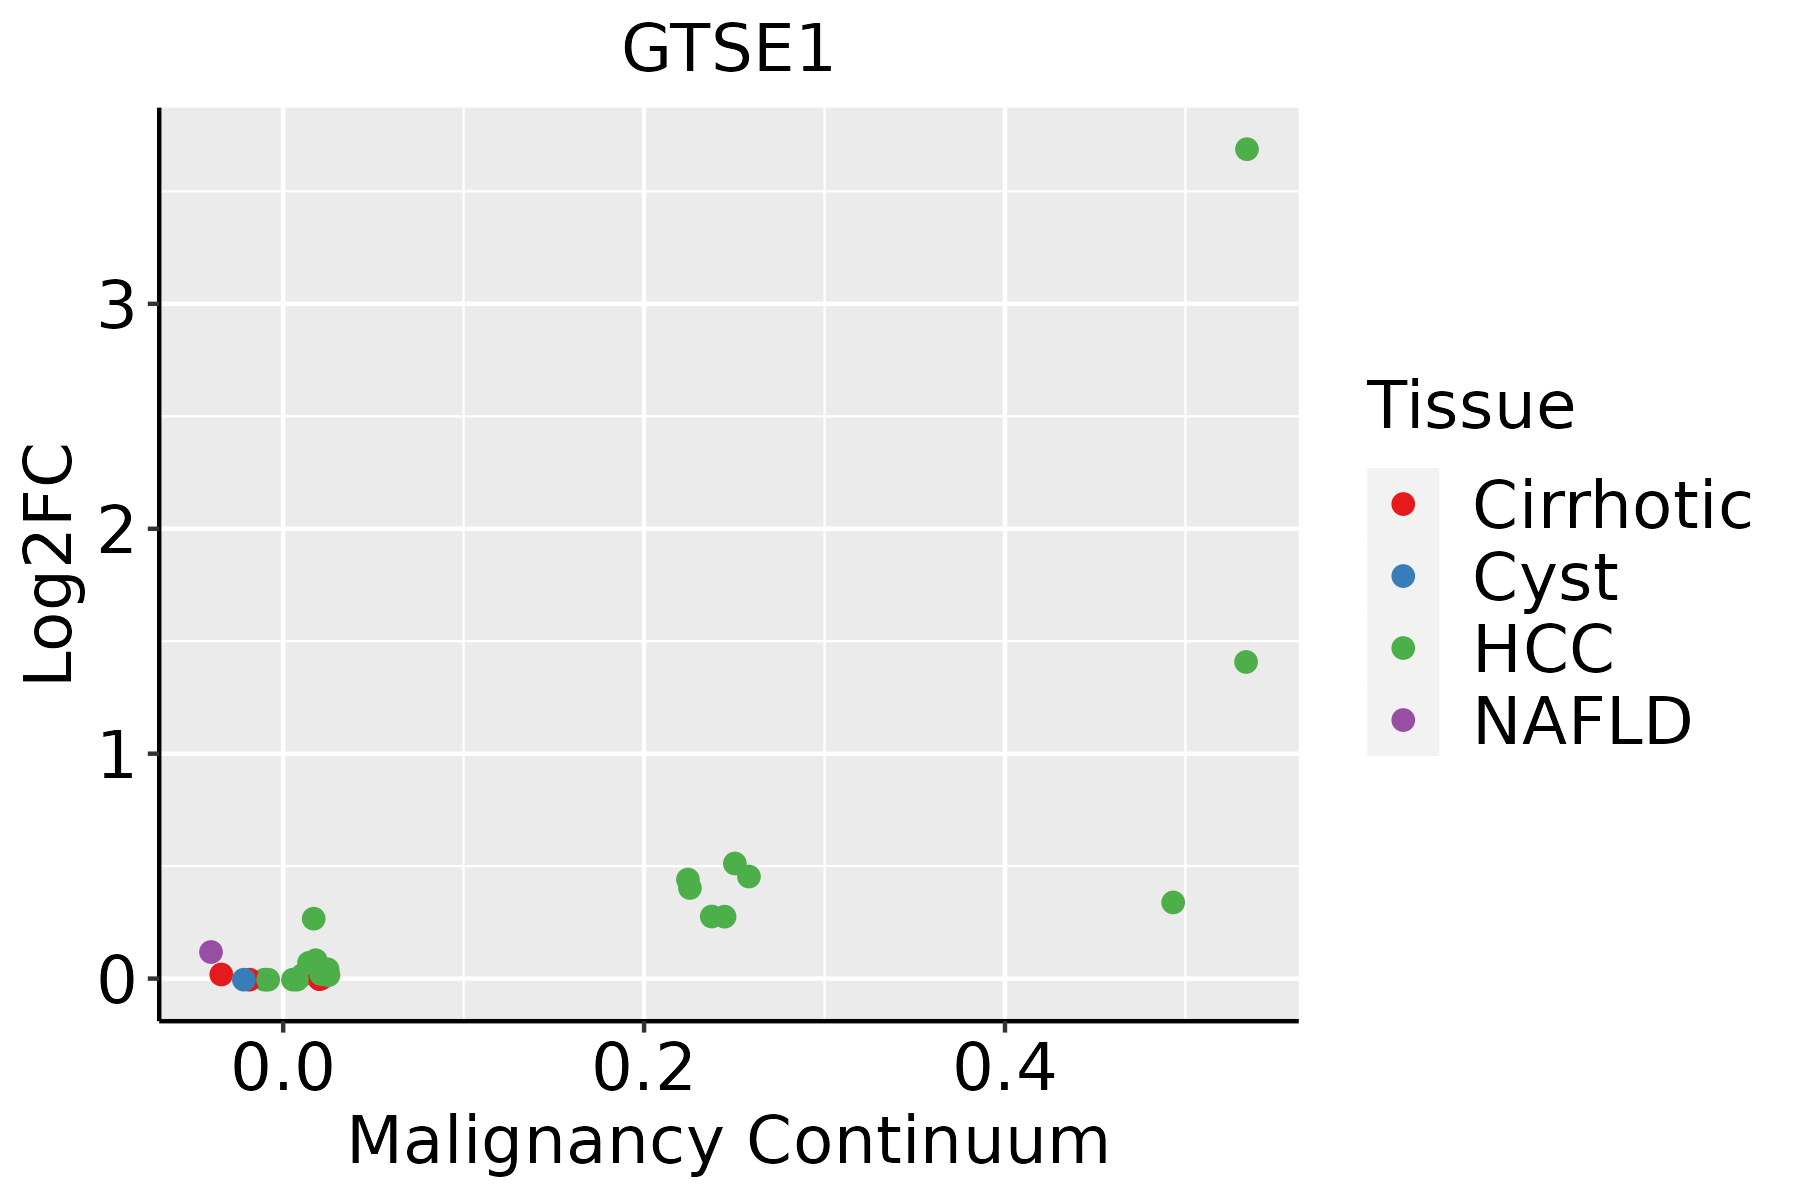 | HCC: Hepatocellular carcinoma |
| NAFLD: Non-alcoholic fatty liver disease | ||
| Oral Cavity | 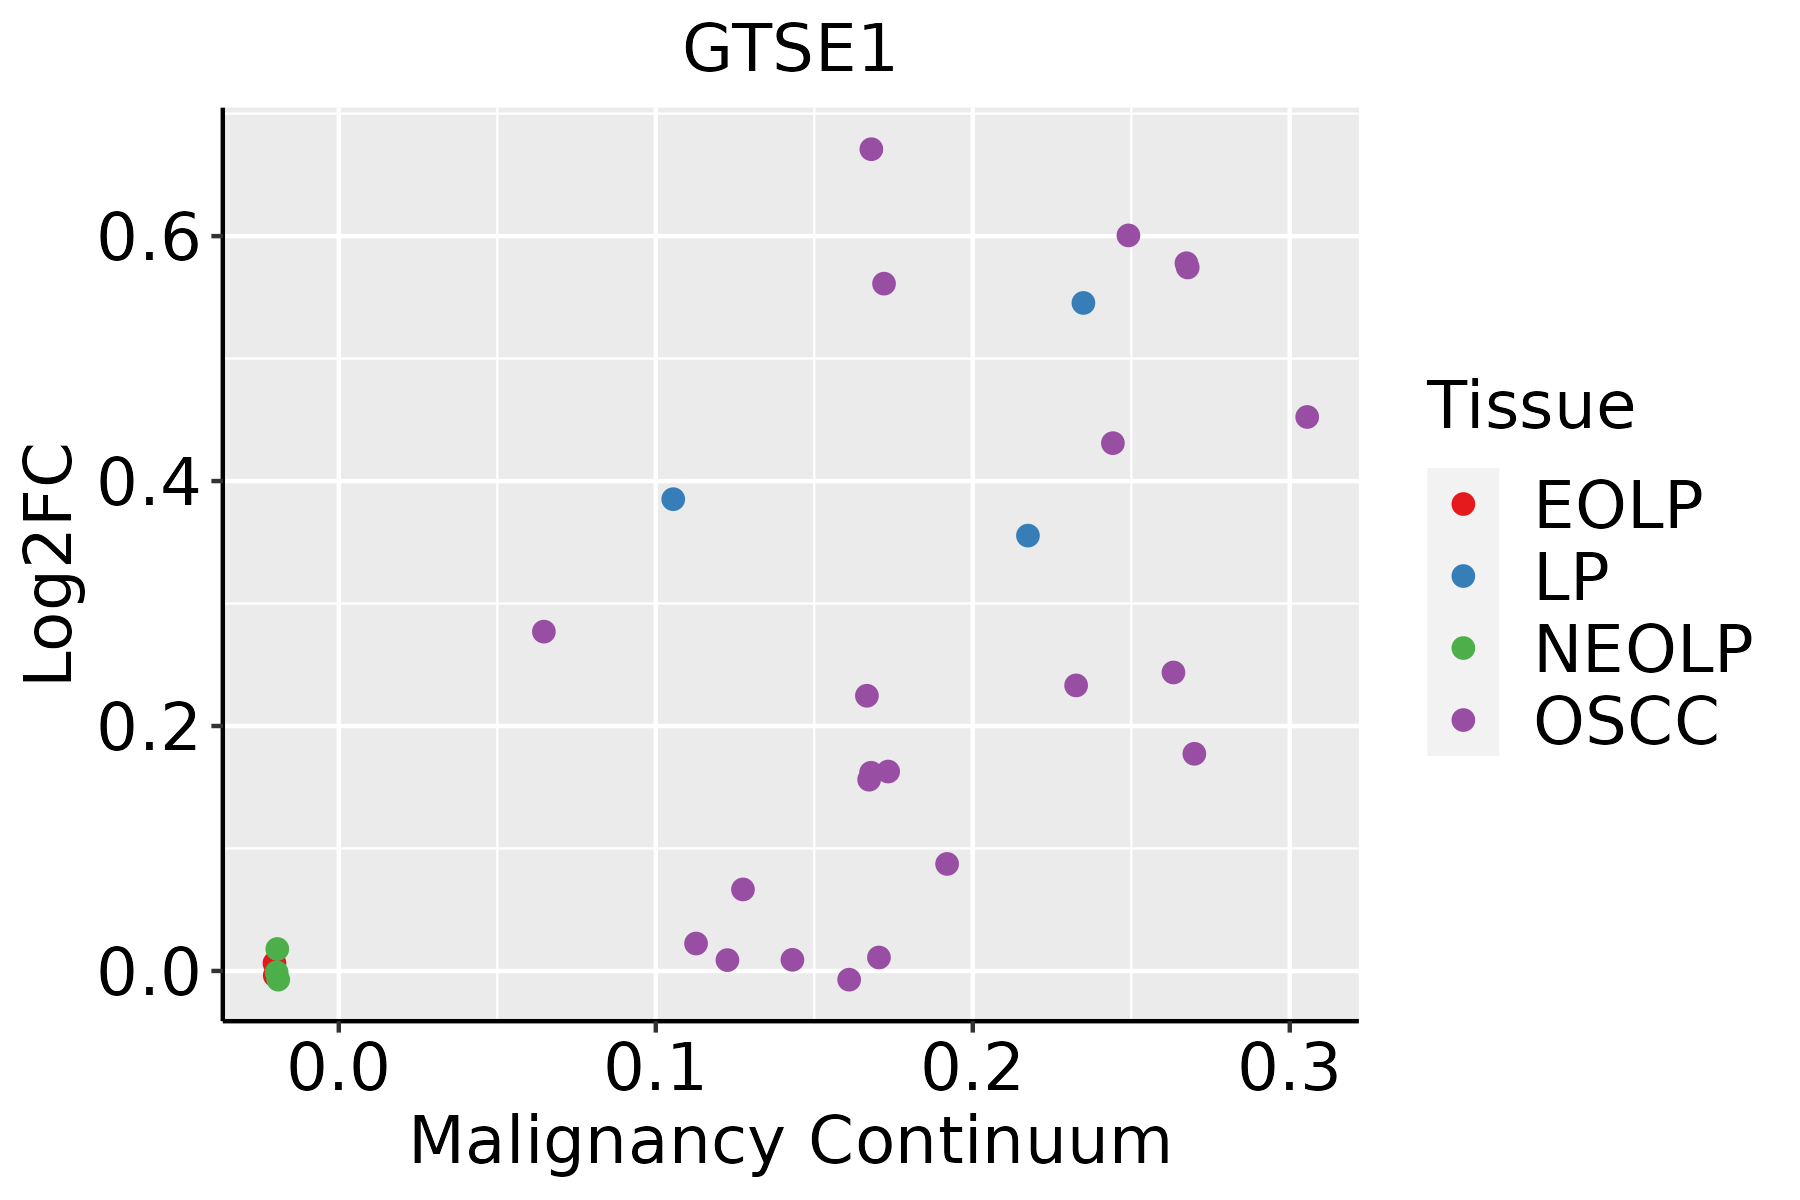 | EOLP: Erosive Oral lichen planus |
| LP: leukoplakia | ||
| NEOLP: Non-erosive oral lichen planus | ||
| OSCC: Oral squamous cell carcinoma | ||
| Skin | 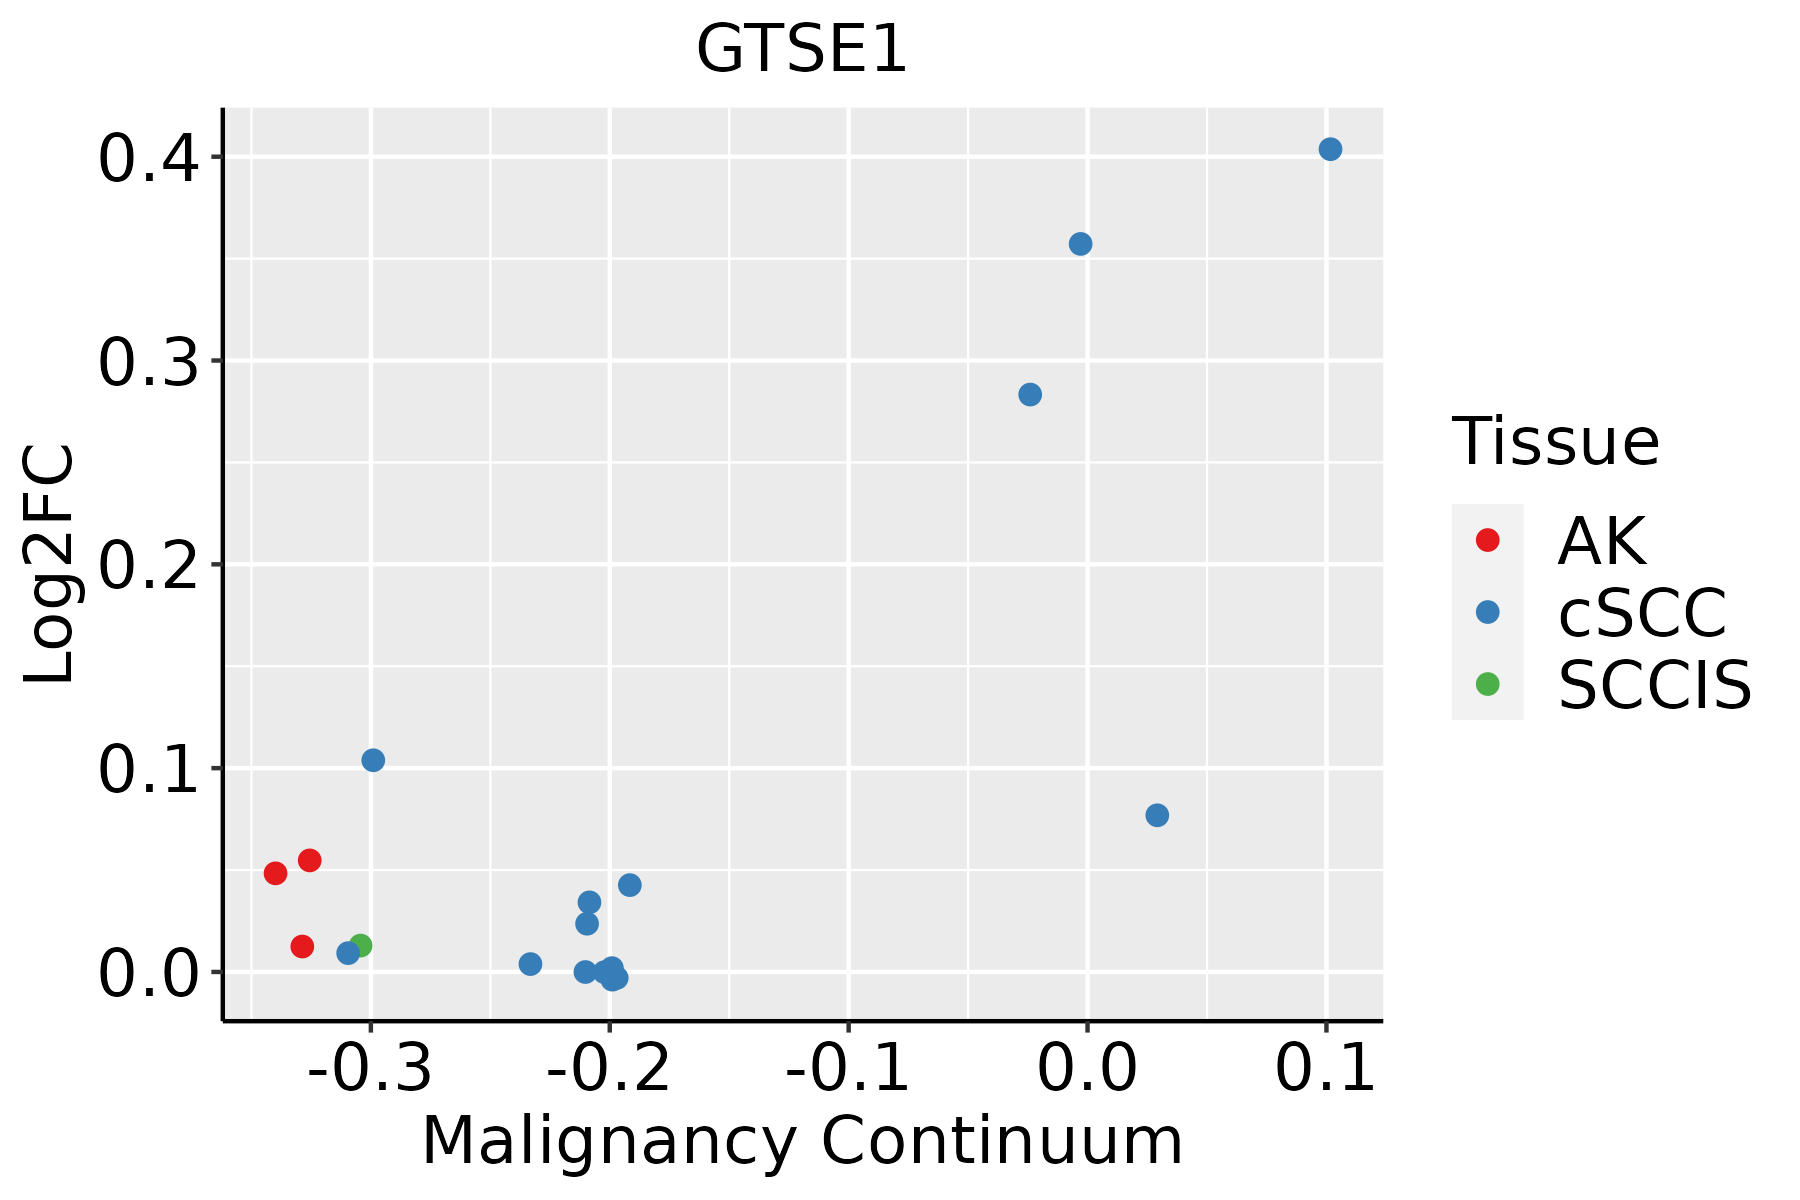 | AK: Actinic keratosis |
| cSCC: Cutaneous squamous cell carcinoma | ||
| SCCIS:squamous cell carcinoma in situ | ||
| Thyroid | 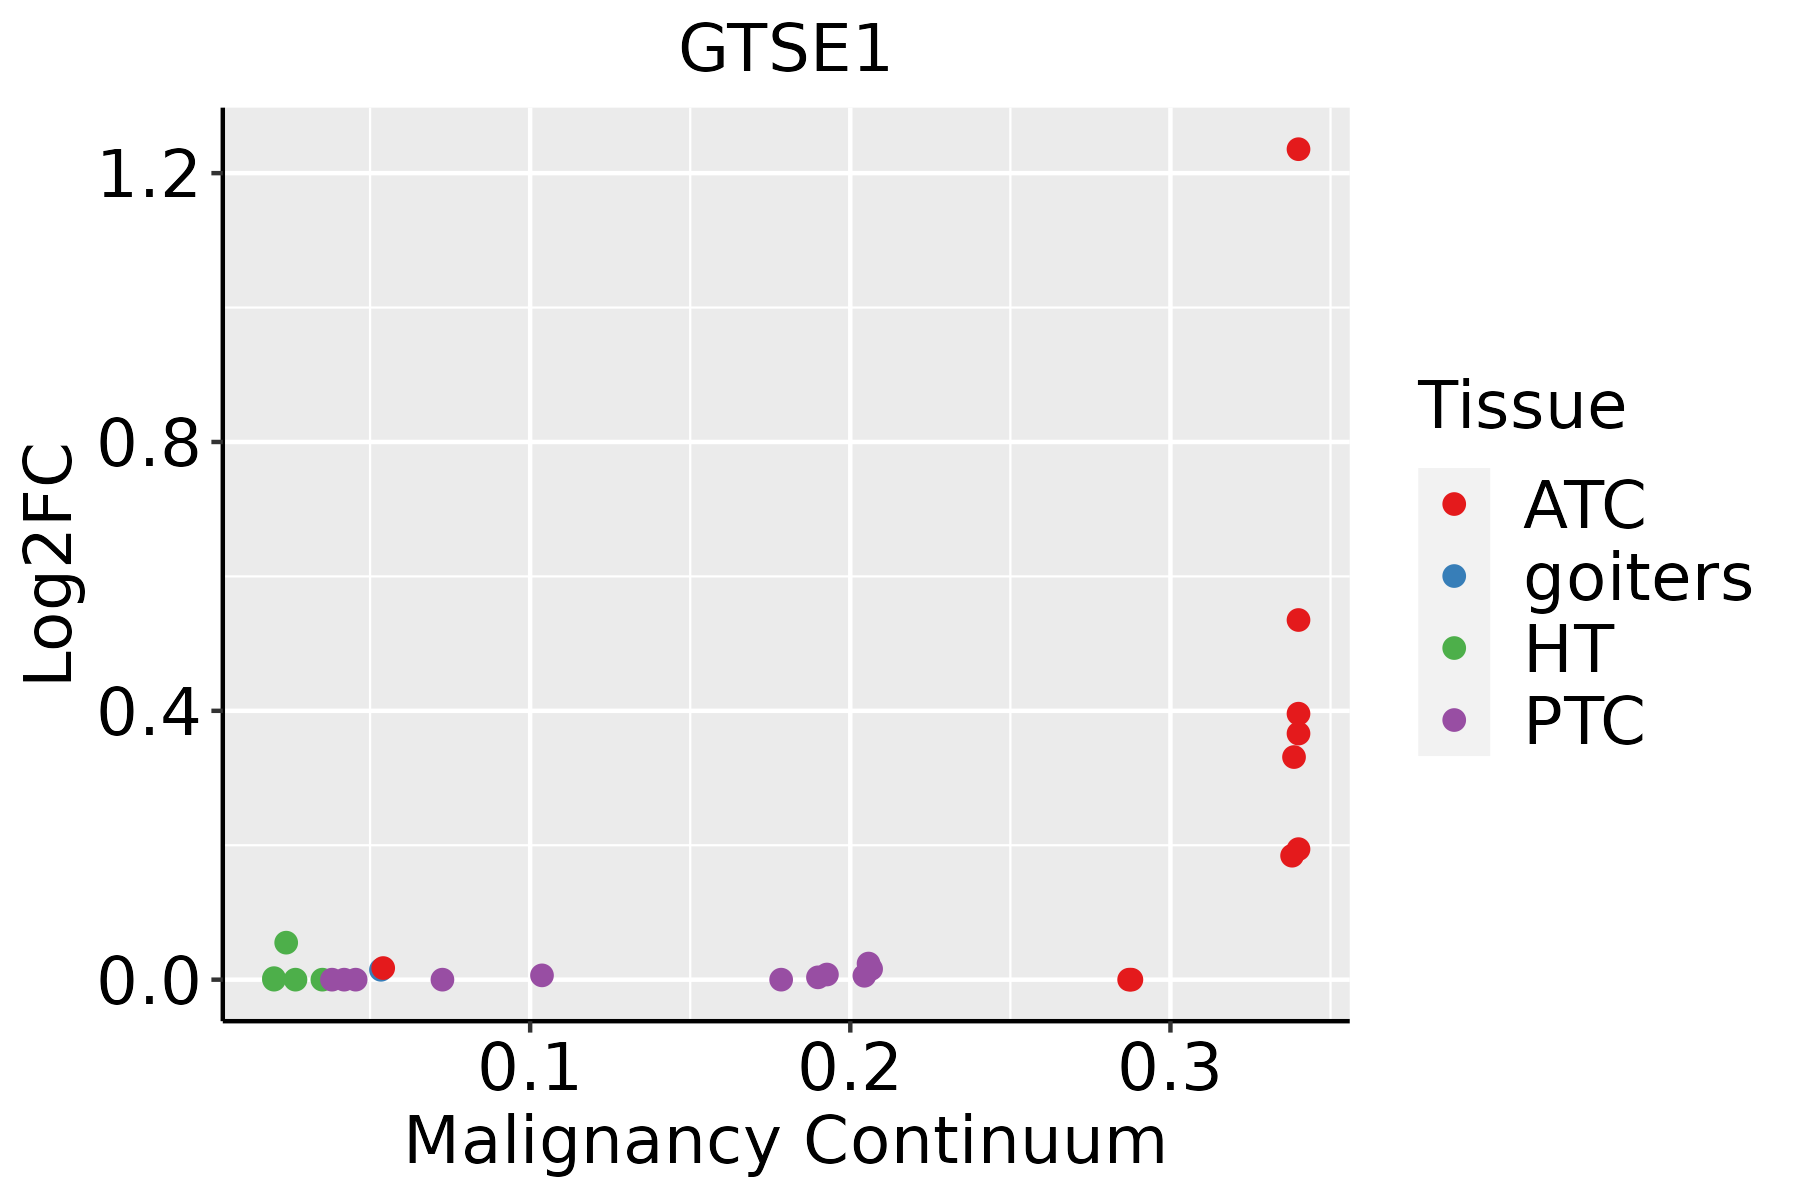 | ATC: Anaplastic thyroid cancer |
| HT: Hashimoto's thyroiditis | ||
| PTC: Papillary thyroid cancer |
| ∗log2FC in expression of this searched gene in stem-like cells from each diseased tissue sample relative to stem-like cells in normal samples in each tissue plotted against the malignancy continuum. Samples are colored based on if they are from different disease stage. |
Top |
Malignant transformation related pathway analysis |
| Find out the enriched GO biological processes and KEGG pathways involved in transition from healthy to precancer to cancer |
| Tissue | Disease Stage | Enriched GO biological Processes |
| Colorectum | AD |  |
| Colorectum | SER |  |
| Colorectum | MSS |  |
| Colorectum | MSI-H |  |
| Colorectum | FAP |  |
| ∗Top 15 enriched GO BP terms are showed in the bar plot of each disease state in each tissue. Each row represents a significant GO biological process which is colored according to the -log10(p.adjust). |
| Page: 1 2 3 4 5 6 7 8 9 |
| GO ID | Tissue | Disease Stage | Description | Gene Ratio | Bg Ratio | pvalue | p.adjust | Count |
| GO:004477216 | Esophagus | ESCC | mitotic cell cycle phase transition | 281/8552 | 424/18723 | 4.63e-18 | 4.45e-16 | 281 |
| GO:000734615 | Esophagus | ESCC | regulation of mitotic cell cycle | 293/8552 | 457/18723 | 8.00e-16 | 5.64e-14 | 293 |
| GO:0072331111 | Esophagus | ESCC | signal transduction by p53 class mediator | 121/8552 | 163/18723 | 9.61e-14 | 4.69e-12 | 121 |
| GO:190198713 | Esophagus | ESCC | regulation of cell cycle phase transition | 242/8552 | 390/18723 | 3.86e-11 | 1.26e-09 | 242 |
| GO:190199013 | Esophagus | ESCC | regulation of mitotic cell cycle phase transition | 191/8552 | 299/18723 | 1.35e-10 | 3.94e-09 | 191 |
| GO:00457865 | Esophagus | ESCC | negative regulation of cell cycle | 236/8552 | 385/18723 | 3.62e-10 | 9.93e-09 | 236 |
| GO:00000754 | Esophagus | ESCC | cell cycle checkpoint | 117/8552 | 169/18723 | 4.47e-10 | 1.17e-08 | 117 |
| GO:004277014 | Esophagus | ESCC | signal transduction in response to DNA damage | 117/8552 | 172/18723 | 2.38e-09 | 5.32e-08 | 117 |
| GO:00070934 | Esophagus | ESCC | mitotic cell cycle checkpoint | 90/8552 | 129/18723 | 2.49e-08 | 4.69e-07 | 90 |
| GO:00109484 | Esophagus | ESCC | negative regulation of cell cycle process | 177/8552 | 294/18723 | 3.26e-07 | 4.59e-06 | 177 |
| GO:000008214 | Esophagus | ESCC | G1/S transition of mitotic cell cycle | 134/8552 | 214/18723 | 4.04e-07 | 5.55e-06 | 134 |
| GO:004484314 | Esophagus | ESCC | cell cycle G1/S phase transition | 148/8552 | 241/18723 | 5.68e-07 | 7.48e-06 | 148 |
| GO:00315705 | Esophagus | ESCC | DNA integrity checkpoint | 83/8552 | 123/18723 | 8.17e-07 | 1.06e-05 | 83 |
| GO:00000775 | Esophagus | ESCC | DNA damage checkpoint | 78/8552 | 115/18723 | 1.27e-06 | 1.56e-05 | 78 |
| GO:19019883 | Esophagus | ESCC | negative regulation of cell cycle phase transition | 151/8552 | 249/18723 | 1.28e-06 | 1.57e-05 | 151 |
| GO:0030330110 | Esophagus | ESCC | DNA damage response, signal transduction by p53 class mediator | 53/8552 | 72/18723 | 1.34e-06 | 1.63e-05 | 53 |
| GO:004593013 | Esophagus | ESCC | negative regulation of mitotic cell cycle | 143/8552 | 235/18723 | 1.84e-06 | 2.15e-05 | 143 |
| GO:190199113 | Esophagus | ESCC | negative regulation of mitotic cell cycle phase transition | 112/8552 | 179/18723 | 3.69e-06 | 4.03e-05 | 112 |
| GO:004477312 | Esophagus | ESCC | mitotic DNA damage checkpoint | 54/8552 | 81/18723 | 1.09e-04 | 7.64e-04 | 54 |
| GO:003157116 | Esophagus | ESCC | mitotic G1 DNA damage checkpoint | 24/8552 | 30/18723 | 1.27e-04 | 8.67e-04 | 24 |
| Page: 1 2 3 4 5 6 |
| Pathway ID | Tissue | Disease Stage | Description | Gene Ratio | Bg Ratio | pvalue | p.adjust | qvalue | Count |
| hsa0411524 | Esophagus | ESCC | p53 signaling pathway | 65/4205 | 74/8465 | 3.88e-12 | 6.50e-11 | 3.33e-11 | 65 |
| hsa0411534 | Esophagus | ESCC | p53 signaling pathway | 65/4205 | 74/8465 | 3.88e-12 | 6.50e-11 | 3.33e-11 | 65 |
| hsa041156 | Liver | HCC | p53 signaling pathway | 46/4020 | 74/8465 | 7.64e-03 | 2.08e-02 | 1.16e-02 | 46 |
| hsa0411511 | Liver | HCC | p53 signaling pathway | 46/4020 | 74/8465 | 7.64e-03 | 2.08e-02 | 1.16e-02 | 46 |
| hsa041159 | Oral cavity | OSCC | p53 signaling pathway | 57/3704 | 74/8465 | 4.99e-09 | 5.07e-08 | 2.58e-08 | 57 |
| hsa0411514 | Oral cavity | OSCC | p53 signaling pathway | 57/3704 | 74/8465 | 4.99e-09 | 5.07e-08 | 2.58e-08 | 57 |
| Page: 1 |
Top |
Cell-cell communication analysis |
| Identification of potential cell-cell interactions between two cell types and their ligand-receptor pairs for different disease states |
| Ligand | Receptor | LRpair | Pathway | Tissue | Disease Stage |
| Page: 1 |
Top |
Single-cell gene regulatory network inference analysis |
| Find out the significant the regulons (TFs) and the target genes of each regulon across cell types for different disease states |
| TF | Cell Type | Tissue | Disease Stage | Target Gene | RSS | Regulon Activity |
| ∗The dot plots of a searched regulon are shown for all cell subpopulations in each disease state of each tissue based on the regulon specific score inferred using pySCENIC and by calculating the average expression. |
| Page: 1 |
Top |
Somatic mutation of malignant transformation related genes |
| Annotation of somatic variants for genes involved in malignant transformation |
| Hugo Symbol | Variant Class | Variant Classification | dbSNP RS | HGVSc | HGVSp | HGVSp Short | SWISSPROT | BIOTYPE | SIFT | PolyPhen | Tumor Sample Barcode | Tissue | Histology | Sex | Age | Stage | Therapy Types | Drugs | Outcome |
| GTSE1 | SNV | Missense_Mutation | c.1222N>C | p.Glu408Gln | p.E408Q | Q9NYZ3 | protein_coding | tolerated(0.06) | probably_damaging(0.975) | TCGA-A8-A06O-01 | Breast | breast invasive carcinoma | Female | <65 | I/II | Hormone Therapy | letrozole | SD | |
| GTSE1 | SNV | Missense_Mutation | c.1349N>A | p.Arg450Lys | p.R450K | Q9NYZ3 | protein_coding | tolerated(0.29) | benign(0.169) | TCGA-A8-A06O-01 | Breast | breast invasive carcinoma | Female | <65 | I/II | Hormone Therapy | letrozole | SD | |
| GTSE1 | SNV | Missense_Mutation | c.491A>T | p.Glu164Val | p.E164V | Q9NYZ3 | protein_coding | deleterious(0) | probably_damaging(1) | TCGA-A8-A079-01 | Breast | breast invasive carcinoma | Female | >=65 | III/IV | Chemotherapy | 5-fluorouracil | SD | |
| GTSE1 | SNV | Missense_Mutation | c.1597N>A | p.Pro533Thr | p.P533T | Q9NYZ3 | protein_coding | deleterious(0) | probably_damaging(0.954) | TCGA-A8-A09Z-01 | Breast | breast invasive carcinoma | Female | >=65 | I/II | Unknown | Unknown | SD | |
| GTSE1 | SNV | Missense_Mutation | c.1201N>A | p.Asp401Asn | p.D401N | Q9NYZ3 | protein_coding | tolerated(0.4) | benign(0.003) | TCGA-AO-A0JM-01 | Breast | breast invasive carcinoma | Female | <65 | I/II | Chemotherapy | doxorubicin | SD | |
| GTSE1 | SNV | Missense_Mutation | rs535759667 | c.260N>G | p.Pro87Arg | p.P87R | Q9NYZ3 | protein_coding | tolerated(0.66) | benign(0.019) | TCGA-B6-A0I1-01 | Breast | breast invasive carcinoma | Female | >=65 | I/II | Unknown | Unknown | PD |
| GTSE1 | SNV | Missense_Mutation | c.1358N>T | p.Asp453Val | p.D453V | Q9NYZ3 | protein_coding | deleterious(0) | probably_damaging(0.958) | TCGA-BH-A0BC-01 | Breast | breast invasive carcinoma | Female | <65 | III/IV | Chemotherapy | doxorubicin | SD | |
| GTSE1 | SNV | Missense_Mutation | novel | c.238N>T | p.Pro80Ser | p.P80S | Q9NYZ3 | protein_coding | tolerated(0.59) | benign(0.007) | TCGA-BH-A2L8-01 | Breast | breast invasive carcinoma | Female | <65 | I/II | Chemotherapy | cytoxan | CR |
| GTSE1 | SNV | Missense_Mutation | c.1496N>T | p.Ser499Leu | p.S499L | Q9NYZ3 | protein_coding | tolerated(0.09) | possibly_damaging(0.447) | TCGA-D8-A27I-01 | Breast | breast invasive carcinoma | Female | <65 | III/IV | Chemotherapy | adrimycin+cyclophosphamide | SD | |
| GTSE1 | deletion | Frame_Shift_Del | c.222delN | p.Val75PhefsTer69 | p.V75Ffs*69 | Q9NYZ3 | protein_coding | TCGA-AO-A0J2-01 | Breast | breast invasive carcinoma | Female | <65 | I/II | Chemotherapy | cyclophosphamide | SD |
| Page: 1 2 3 4 5 6 7 |
Top |
Related drugs of malignant transformation related genes |
| Identification of chemicals and drugs interact with genes involved in malignant transfromation |
| (DGIdb 4.0) |
| Entrez ID | Symbol | Category | Interaction Types | Drug Claim Name | Drug Name | PMIDs |
| Page: 1 |

Copyright 2023-Present -The University of Texas Health Science Center at Houston |