
|
|||||
|
 | |
| |
| |
| |
| |
| |
|
Gene: GTPBP4 |
Gene summary for GTPBP4 |
| Gene information | Species | Human | Gene symbol | GTPBP4 | Gene ID | 23560 |
| Gene name | GTP binding protein 4 | |
| Gene Alias | CRFG | |
| Cytomap | 10p15.3 | |
| Gene Type | protein-coding | GO ID | GO:0000079 | UniProtAcc | D2CFK9 |
Top |
Malignant transformation analysis |
| Identification of the aberrant gene expression in precancerous and cancerous lesions by comparing the gene expression of stem-like cells in diseased tissues with normal stem cells |
| Entrez ID | Symbol | Replicates | Species | Organ | Tissue | Adj P-value | Log2FC | Malignancy |
| 23560 | GTPBP4 | AEH-subject1 | Human | Endometrium | AEH | 8.18e-03 | 1.53e-01 | -0.3059 |
| 23560 | GTPBP4 | AEH-subject3 | Human | Endometrium | AEH | 4.54e-02 | 1.17e-02 | -0.2576 |
| 23560 | GTPBP4 | EEC-subject1 | Human | Endometrium | EEC | 1.10e-02 | 1.88e-01 | -0.2682 |
| 23560 | GTPBP4 | EEC-subject3 | Human | Endometrium | EEC | 5.88e-03 | 2.13e-02 | -0.2525 |
| 23560 | GTPBP4 | GSM5276934 | Human | Endometrium | EEC | 9.84e-61 | 9.47e-01 | -0.0913 |
| 23560 | GTPBP4 | GSM5276937 | Human | Endometrium | EEC | 1.41e-55 | 9.69e-01 | -0.0897 |
| 23560 | GTPBP4 | GSM6177620_NYU_UCEC1_lib1_lib1 | Human | Endometrium | EEC | 2.84e-17 | -5.19e-03 | -0.1869 |
| 23560 | GTPBP4 | GSM6177620_NYU_UCEC1_lib2_lib2 | Human | Endometrium | EEC | 5.80e-13 | -3.18e-02 | -0.1875 |
| 23560 | GTPBP4 | GSM6177620_NYU_UCEC1_lib3_lib3 | Human | Endometrium | EEC | 4.70e-09 | -9.46e-02 | -0.1883 |
| 23560 | GTPBP4 | GSM6177621_NYU_UCEC2_lib1_lib1 | Human | Endometrium | EEC | 2.55e-10 | 1.11e-01 | -0.1934 |
| 23560 | GTPBP4 | GSM6177622_NYU_UCEC3_lib1_lib1 | Human | Endometrium | EEC | 2.20e-16 | 5.87e-02 | -0.1917 |
| 23560 | GTPBP4 | GSM6177622_NYU_UCEC3_lib2_lib2 | Human | Endometrium | EEC | 8.70e-16 | -4.60e-02 | -0.1916 |
| 23560 | GTPBP4 | LZE4T | Human | Esophagus | ESCC | 1.48e-18 | 4.05e-01 | 0.0811 |
| 23560 | GTPBP4 | LZE8T | Human | Esophagus | ESCC | 5.01e-05 | 6.82e-02 | 0.067 |
| 23560 | GTPBP4 | LZE22T | Human | Esophagus | ESCC | 3.92e-03 | 3.90e-01 | 0.068 |
| 23560 | GTPBP4 | LZE24T | Human | Esophagus | ESCC | 2.11e-13 | 4.81e-01 | 0.0596 |
| 23560 | GTPBP4 | P2T-E | Human | Esophagus | ESCC | 1.85e-25 | 4.59e-01 | 0.1177 |
| 23560 | GTPBP4 | P4T-E | Human | Esophagus | ESCC | 1.26e-16 | 5.94e-01 | 0.1323 |
| 23560 | GTPBP4 | P5T-E | Human | Esophagus | ESCC | 1.80e-35 | 9.17e-01 | 0.1327 |
| 23560 | GTPBP4 | P8T-E | Human | Esophagus | ESCC | 2.50e-15 | 3.29e-01 | 0.0889 |
| Page: 1 2 3 4 5 6 7 |
| Tissue | Expression Dynamics | Abbreviation |
| Endometrium |  | AEH: Atypical endometrial hyperplasia |
| EEC: Endometrioid Cancer | ||
| Esophagus | 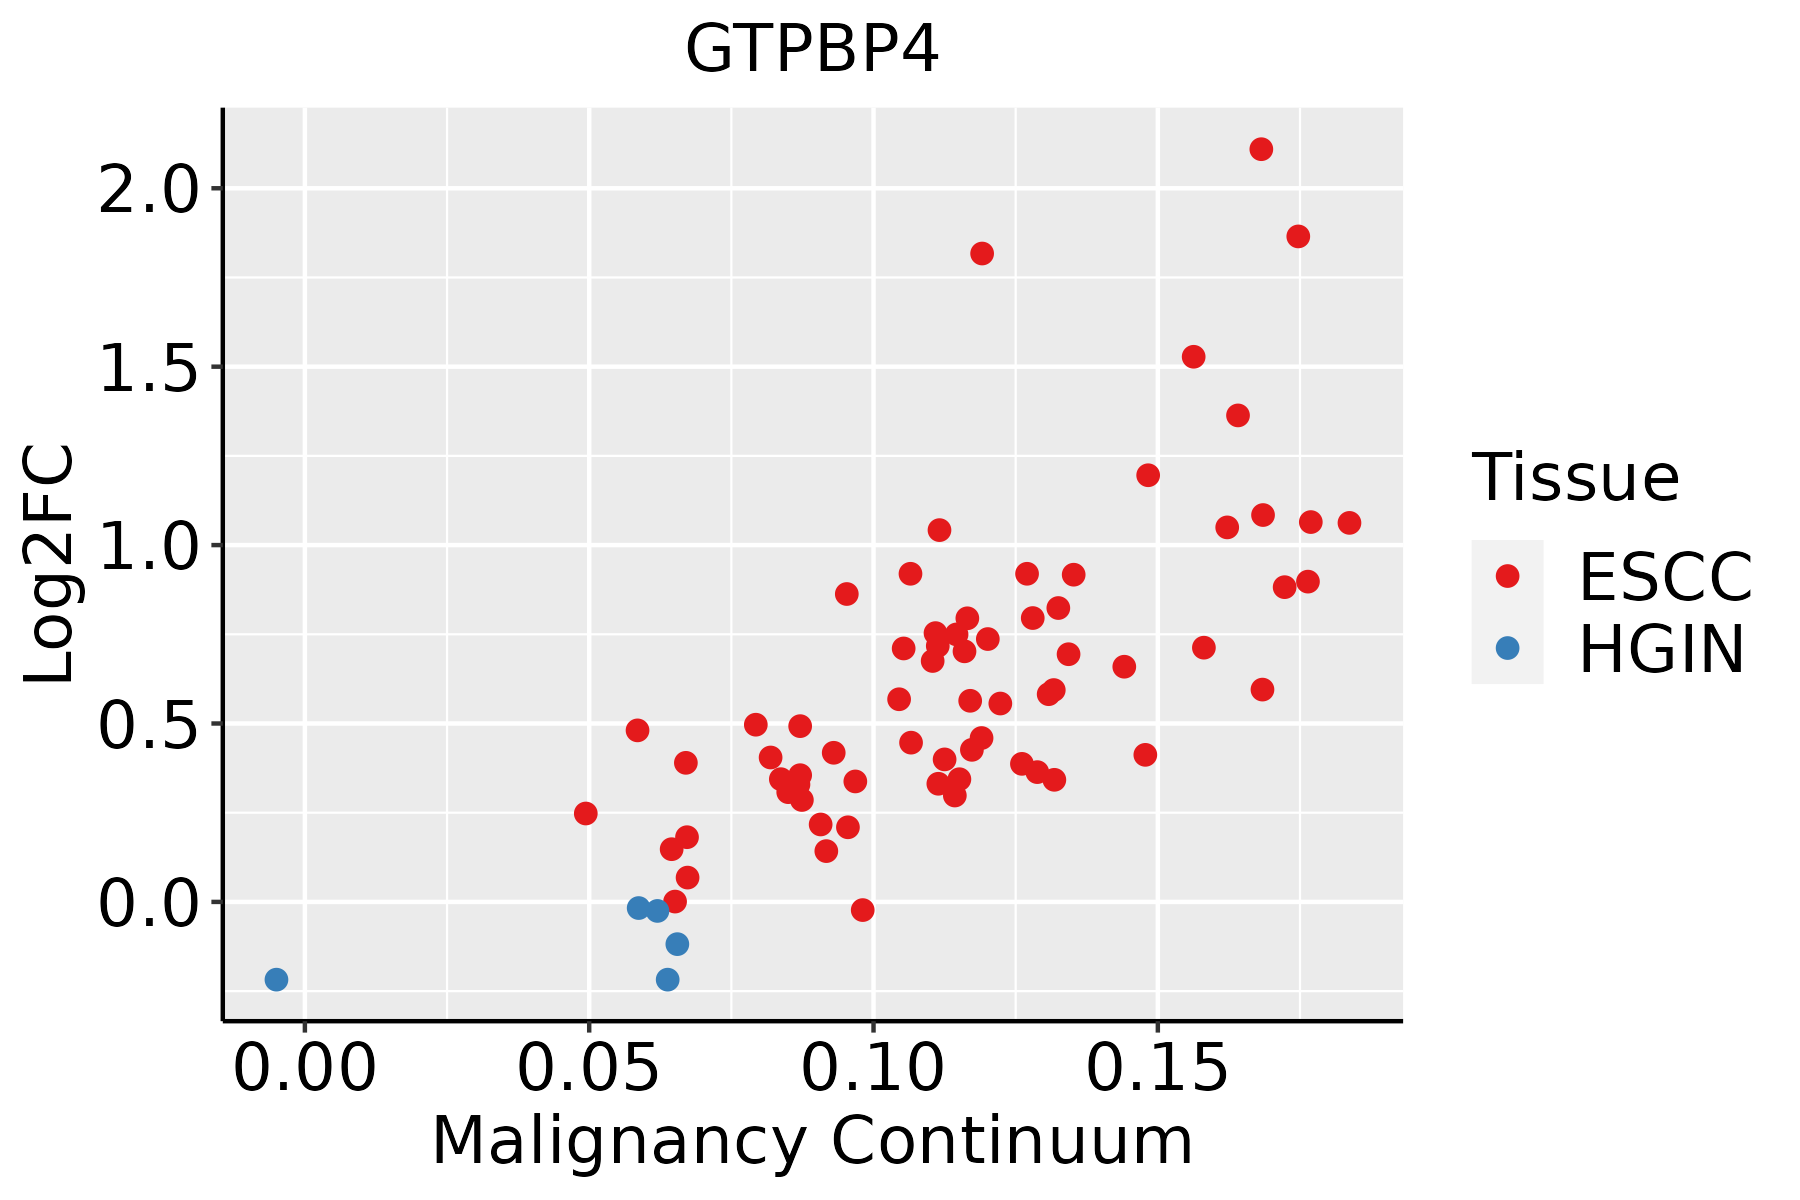 | ESCC: Esophageal squamous cell carcinoma |
| HGIN: High-grade intraepithelial neoplasias | ||
| LGIN: Low-grade intraepithelial neoplasias | ||
| Liver |  | HCC: Hepatocellular carcinoma |
| NAFLD: Non-alcoholic fatty liver disease | ||
| Oral Cavity |  | EOLP: Erosive Oral lichen planus |
| LP: leukoplakia | ||
| NEOLP: Non-erosive oral lichen planus | ||
| OSCC: Oral squamous cell carcinoma | ||
| Prostate | 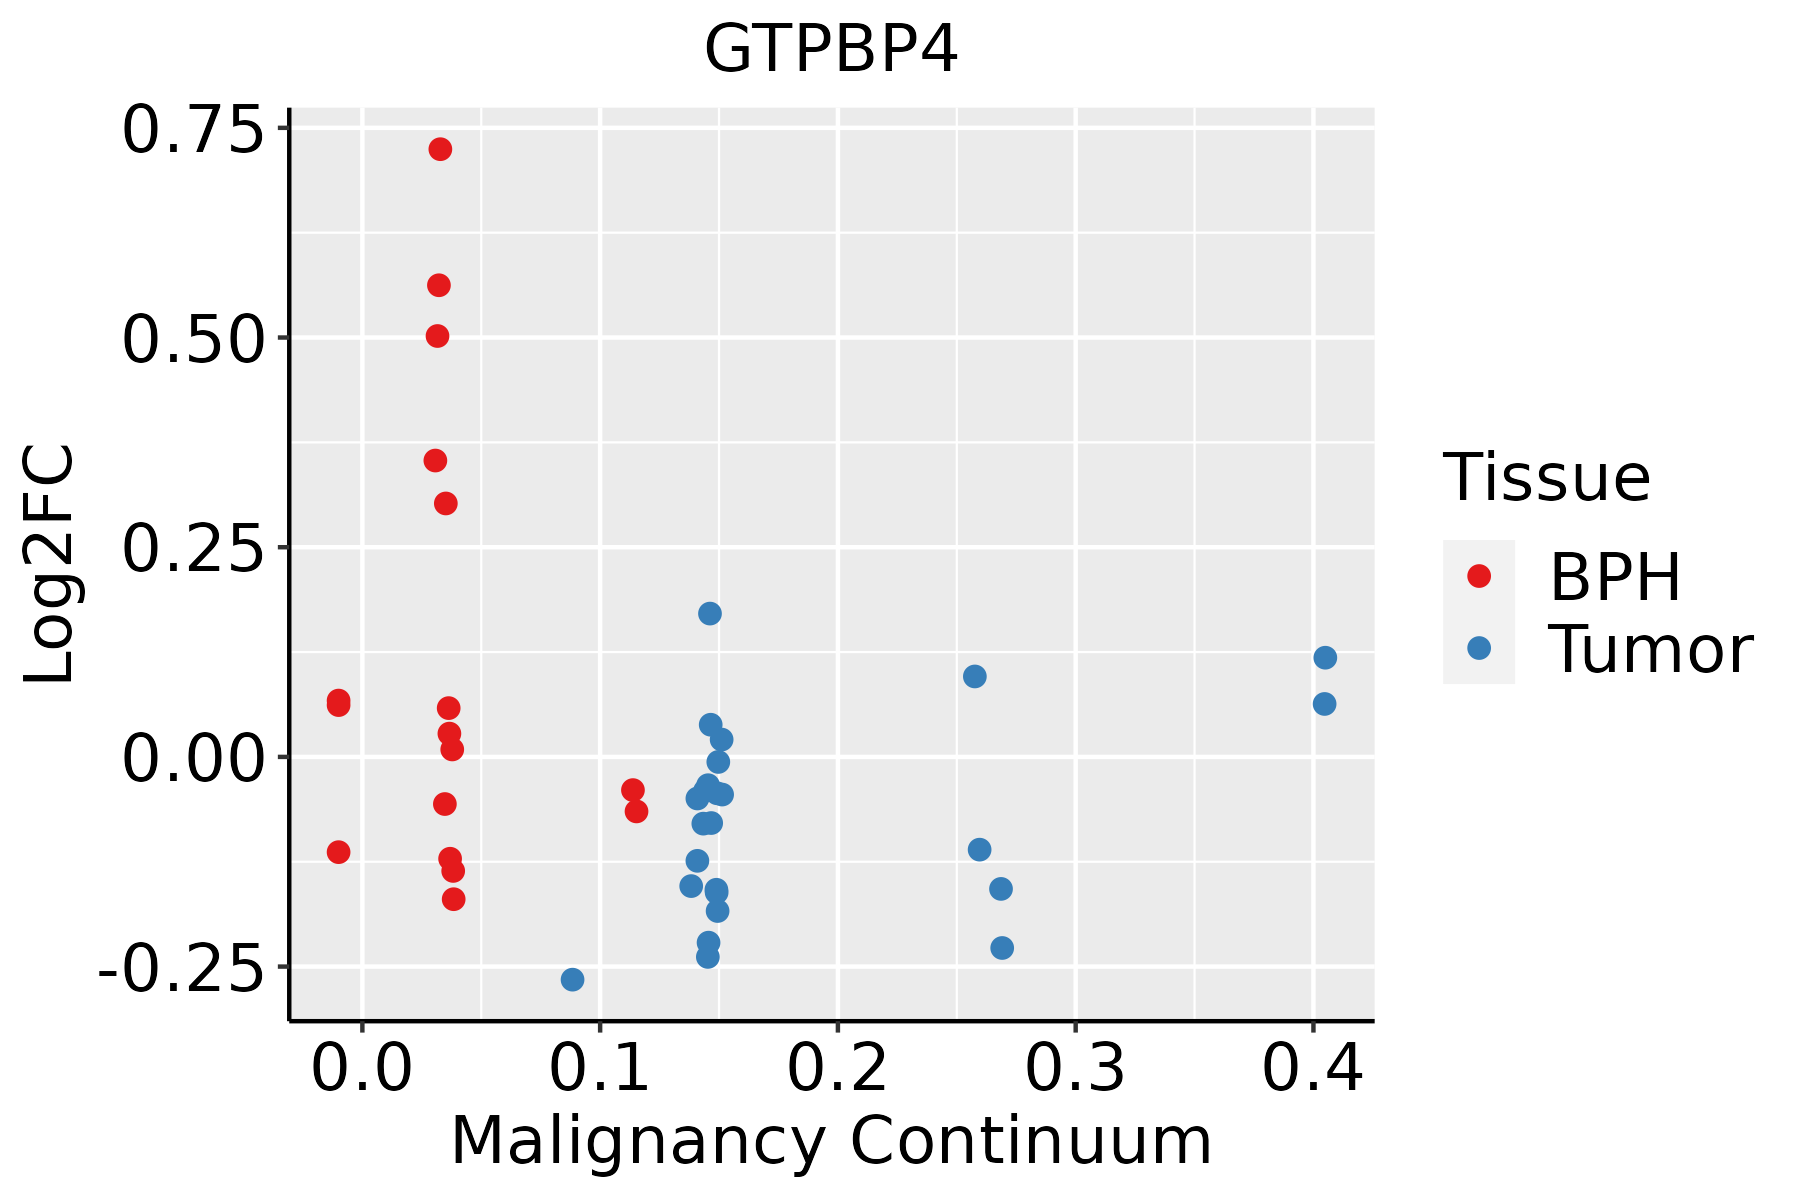 | BPH: Benign Prostatic Hyperplasia |
| Skin | 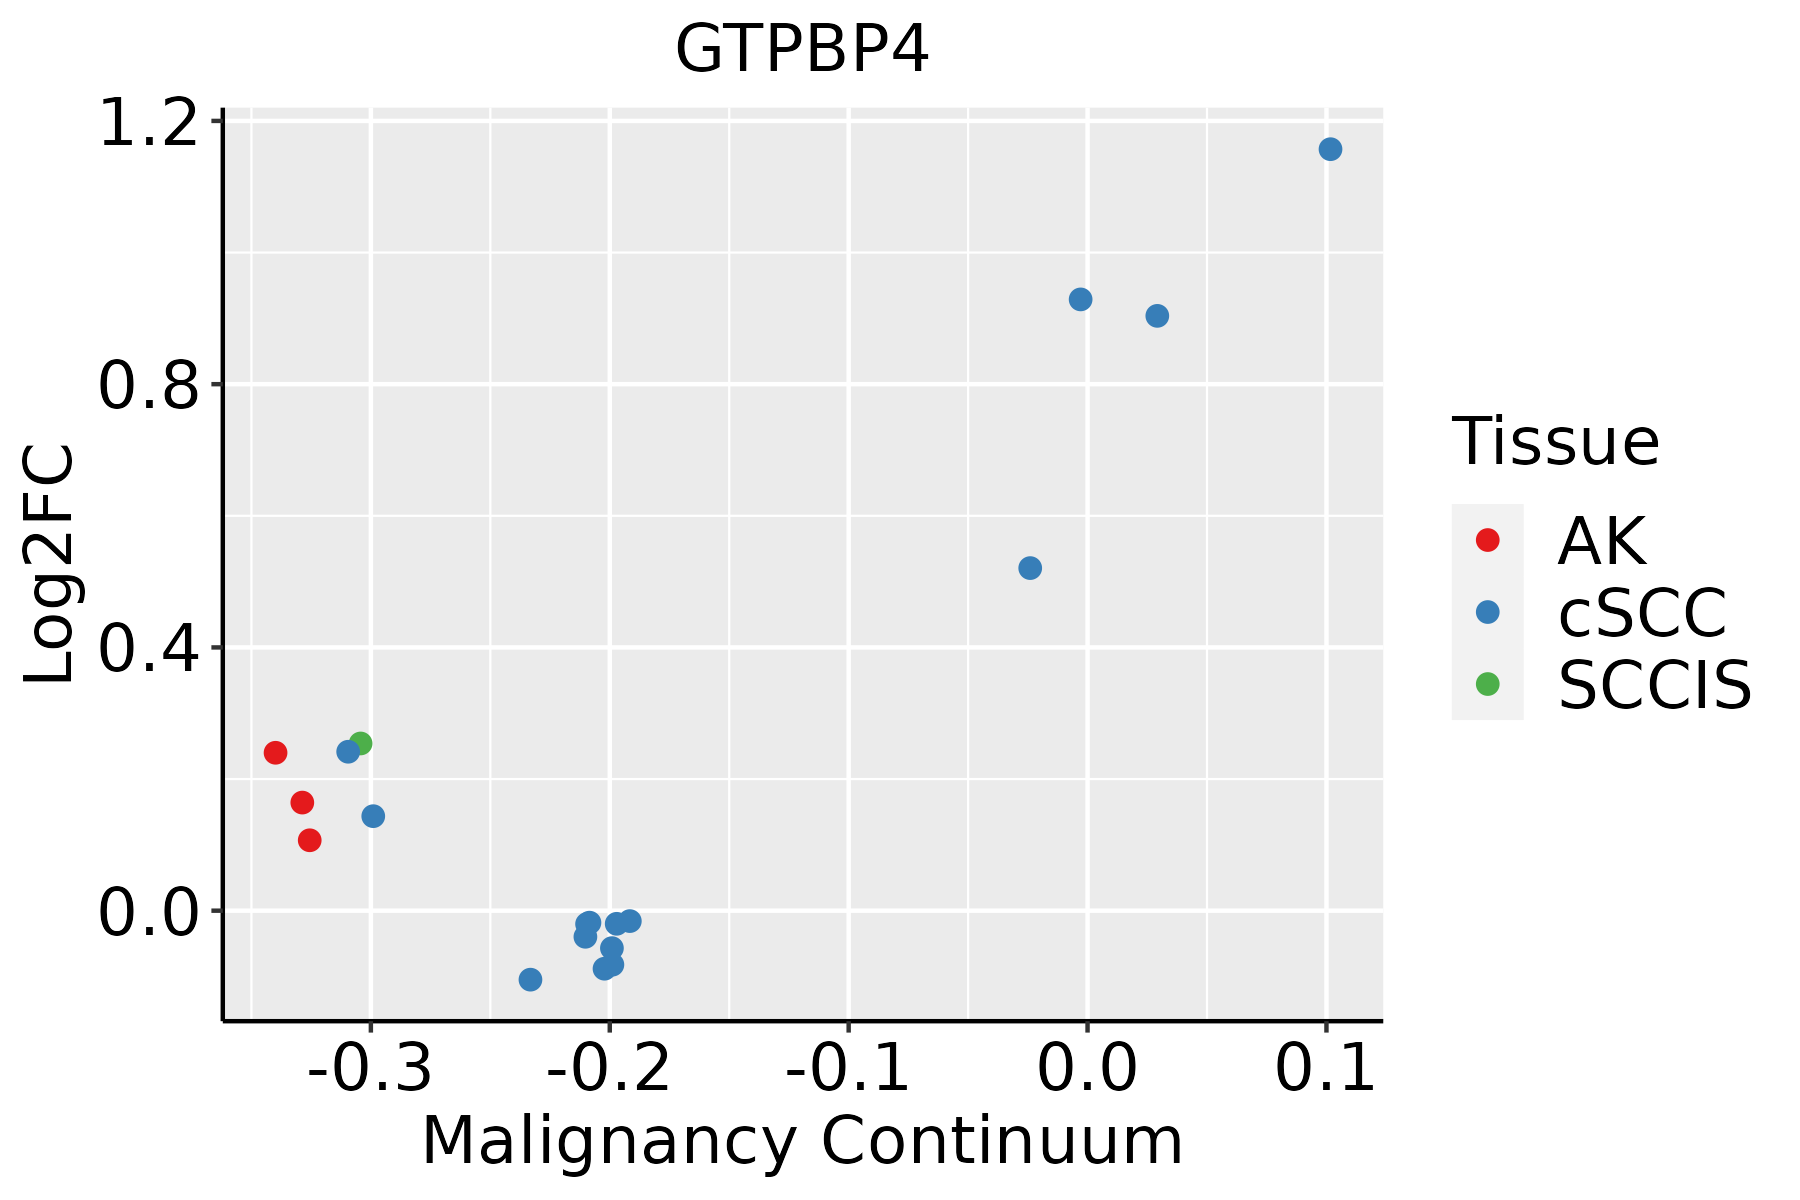 | AK: Actinic keratosis |
| cSCC: Cutaneous squamous cell carcinoma | ||
| SCCIS:squamous cell carcinoma in situ | ||
| Thyroid | 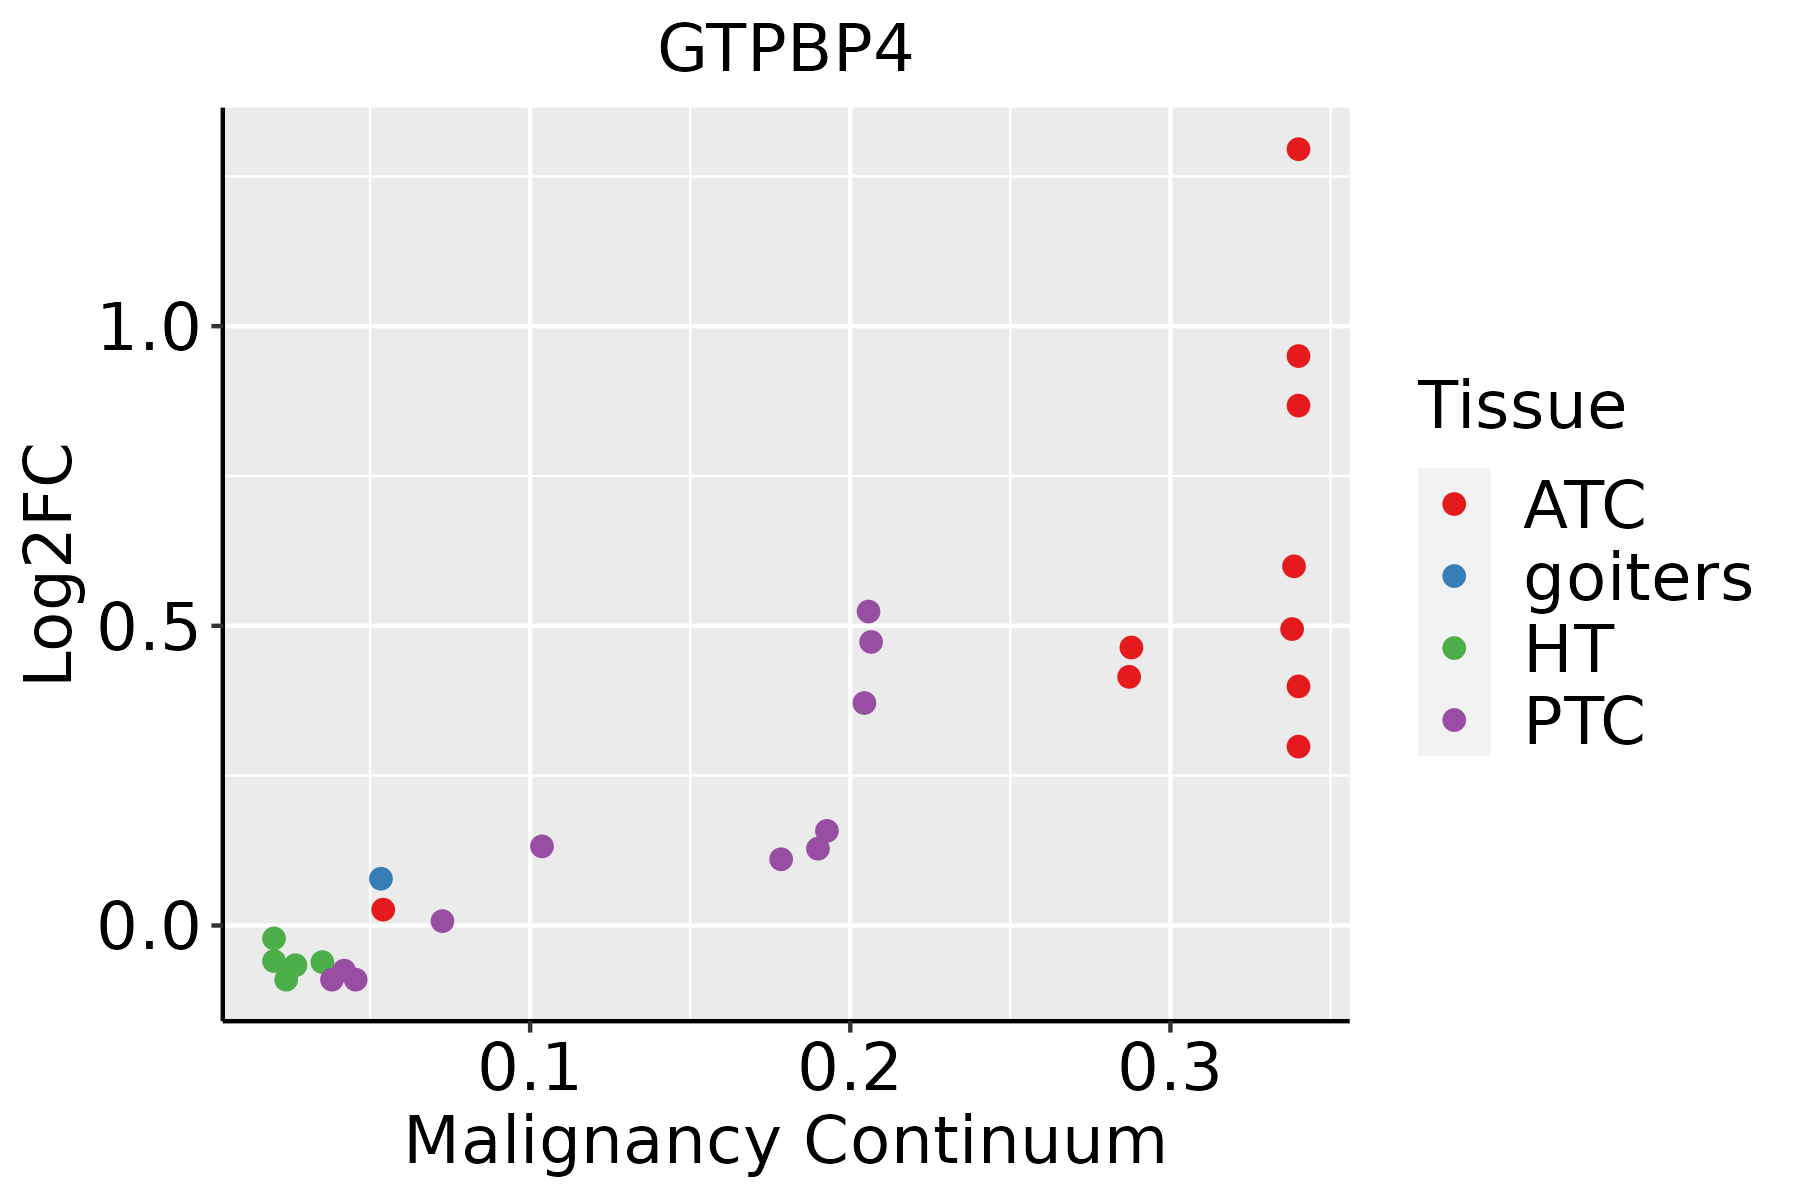 | ATC: Anaplastic thyroid cancer |
| HT: Hashimoto's thyroiditis | ||
| PTC: Papillary thyroid cancer |
| ∗log2FC in expression of this searched gene in stem-like cells from each diseased tissue sample relative to stem-like cells in normal samples in each tissue plotted against the malignancy continuum. Samples are colored based on if they are from different disease stage. |
Top |
Malignant transformation related pathway analysis |
| Find out the enriched GO biological processes and KEGG pathways involved in transition from healthy to precancer to cancer |
| Tissue | Disease Stage | Enriched GO biological Processes |
| Colorectum | AD |  |
| Colorectum | SER |  |
| Colorectum | MSS |  |
| Colorectum | MSI-H |  |
| Colorectum | FAP |  |
| ∗Top 15 enriched GO BP terms are showed in the bar plot of each disease state in each tissue. Each row represents a significant GO biological process which is colored according to the -log10(p.adjust). |
| Page: 1 2 3 4 5 6 7 8 9 |
| GO ID | Tissue | Disease Stage | Description | Gene Ratio | Bg Ratio | pvalue | p.adjust | Count |
| GO:002261316 | Endometrium | AEH | ribonucleoprotein complex biogenesis | 107/2100 | 463/18723 | 1.43e-13 | 4.08e-11 | 107 |
| GO:190332016 | Endometrium | AEH | regulation of protein modification by small protein conjugation or removal | 67/2100 | 242/18723 | 1.10e-12 | 2.26e-10 | 67 |
| GO:003164716 | Endometrium | AEH | regulation of protein stability | 77/2100 | 298/18723 | 1.13e-12 | 2.26e-10 | 77 |
| GO:005082116 | Endometrium | AEH | protein stabilization | 55/2100 | 191/18723 | 2.19e-11 | 3.20e-09 | 55 |
| GO:004227316 | Endometrium | AEH | ribosomal large subunit biogenesis | 30/2100 | 72/18723 | 3.69e-11 | 5.03e-09 | 30 |
| GO:003139616 | Endometrium | AEH | regulation of protein ubiquitination | 57/2100 | 210/18723 | 1.24e-10 | 1.40e-08 | 57 |
| GO:004225416 | Endometrium | AEH | ribosome biogenesis | 67/2100 | 299/18723 | 1.95e-08 | 1.18e-06 | 67 |
| GO:005109816 | Endometrium | AEH | regulation of binding | 77/2100 | 363/18723 | 2.21e-08 | 1.31e-06 | 77 |
| GO:003139716 | Endometrium | AEH | negative regulation of protein ubiquitination | 28/2100 | 83/18723 | 4.36e-08 | 2.40e-06 | 28 |
| GO:190332116 | Endometrium | AEH | negative regulation of protein modification by small protein conjugation or removal | 30/2100 | 95/18723 | 7.94e-08 | 4.04e-06 | 30 |
| GO:00016498 | Endometrium | AEH | osteoblast differentiation | 52/2100 | 229/18723 | 4.74e-07 | 1.92e-05 | 52 |
| GO:00015038 | Endometrium | AEH | ossification | 78/2100 | 408/18723 | 1.54e-06 | 4.85e-05 | 78 |
| GO:00303364 | Endometrium | AEH | negative regulation of cell migration | 65/2100 | 344/18723 | 1.65e-05 | 3.42e-04 | 65 |
| GO:00063648 | Endometrium | AEH | rRNA processing | 47/2100 | 225/18723 | 1.78e-05 | 3.65e-04 | 47 |
| GO:20001464 | Endometrium | AEH | negative regulation of cell motility | 67/2100 | 359/18723 | 1.86e-05 | 3.77e-04 | 67 |
| GO:00512714 | Endometrium | AEH | negative regulation of cellular component movement | 68/2100 | 367/18723 | 2.06e-05 | 4.11e-04 | 68 |
| GO:00004704 | Endometrium | AEH | maturation of LSU-rRNA | 12/2100 | 28/18723 | 2.08e-05 | 4.13e-04 | 12 |
| GO:002240714 | Endometrium | AEH | regulation of cell-cell adhesion | 79/2100 | 448/18723 | 2.90e-05 | 5.40e-04 | 79 |
| GO:00160728 | Endometrium | AEH | rRNA metabolic process | 48/2100 | 236/18723 | 3.01e-05 | 5.54e-04 | 48 |
| GO:00400134 | Endometrium | AEH | negative regulation of locomotion | 70/2100 | 391/18723 | 4.95e-05 | 8.05e-04 | 70 |
| Page: 1 2 3 4 5 6 7 8 9 10 11 12 13 14 15 |
| Pathway ID | Tissue | Disease Stage | Description | Gene Ratio | Bg Ratio | pvalue | p.adjust | qvalue | Count |
| Page: 1 |
Top |
Cell-cell communication analysis |
| Identification of potential cell-cell interactions between two cell types and their ligand-receptor pairs for different disease states |
| Ligand | Receptor | LRpair | Pathway | Tissue | Disease Stage |
| Page: 1 |
Top |
Single-cell gene regulatory network inference analysis |
| Find out the significant the regulons (TFs) and the target genes of each regulon across cell types for different disease states |
| TF | Cell Type | Tissue | Disease Stage | Target Gene | RSS | Regulon Activity |
| ∗The dot plots of a searched regulon are shown for all cell subpopulations in each disease state of each tissue based on the regulon specific score inferred using pySCENIC and by calculating the average expression. |
| Page: 1 |
Top |
Somatic mutation of malignant transformation related genes |
| Annotation of somatic variants for genes involved in malignant transformation |
| Hugo Symbol | Variant Class | Variant Classification | dbSNP RS | HGVSc | HGVSp | HGVSp Short | SWISSPROT | BIOTYPE | SIFT | PolyPhen | Tumor Sample Barcode | Tissue | Histology | Sex | Age | Stage | Therapy Types | Drugs | Outcome |
| GTPBP4 | SNV | Missense_Mutation | novel | c.87N>T | p.Lys29Asn | p.K29N | Q9BZE4 | protein_coding | deleterious(0) | possibly_damaging(0.677) | TCGA-AN-A046-01 | Breast | breast invasive carcinoma | Female | >=65 | I/II | Unknown | Unknown | SD |
| GTPBP4 | SNV | Missense_Mutation | novel | c.328N>T | p.Ala110Ser | p.A110S | Q9BZE4 | protein_coding | tolerated(0.45) | benign(0.057) | TCGA-AN-A0FX-01 | Breast | breast invasive carcinoma | Female | <65 | I/II | Unknown | Unknown | SD |
| GTPBP4 | SNV | Missense_Mutation | c.49G>T | p.Asp17Tyr | p.D17Y | Q9BZE4 | protein_coding | deleterious(0) | probably_damaging(0.928) | TCGA-E2-A15A-06 | Breast | breast invasive carcinoma | Female | <65 | III/IV | Chemotherapy | cyclophosphamide | SD | |
| GTPBP4 | insertion | Frame_Shift_Ins | novel | c.1514_1515insGCCTGGCCCCCGTCTC | p.Arg507GlyfsTer12 | p.R507Gfs*12 | Q9BZE4 | protein_coding | TCGA-BH-A0H6-01 | Breast | breast invasive carcinoma | Female | >=65 | I/II | Unknown | Unknown | SD | ||
| GTPBP4 | SNV | Missense_Mutation | rs773394843 | c.1697G>A | p.Arg566Gln | p.R566Q | Q9BZE4 | protein_coding | deleterious(0.03) | benign(0.217) | TCGA-EK-A2PL-01 | Cervix | cervical & endocervical cancer | Female | <65 | III/IV | Unknown | Unknown | SD |
| GTPBP4 | SNV | Missense_Mutation | novel | c.168N>T | p.Gln56His | p.Q56H | Q9BZE4 | protein_coding | deleterious(0) | probably_damaging(0.984) | TCGA-FU-A3HZ-01 | Cervix | cervical & endocervical cancer | Female | <65 | I/II | Chemotherapy | cisplatin | CR |
| GTPBP4 | SNV | Missense_Mutation | rs774844408 | c.83N>A | p.Arg28Gln | p.R28Q | Q9BZE4 | protein_coding | deleterious(0) | probably_damaging(0.996) | TCGA-IR-A3LI-01 | Cervix | cervical & endocervical cancer | Female | <65 | I/II | Chemotherapy | cisplatin | CR |
| GTPBP4 | SNV | Missense_Mutation | c.262G>A | p.Asp88Asn | p.D88N | Q9BZE4 | protein_coding | tolerated(0.13) | possibly_damaging(0.873) | TCGA-AA-3672-01 | Colorectum | colon adenocarcinoma | Female | >=65 | III/IV | Unknown | Unknown | SD | |
| GTPBP4 | SNV | Missense_Mutation | rs372753265 | c.1529N>A | p.Arg510Gln | p.R510Q | Q9BZE4 | protein_coding | deleterious(0.01) | benign(0.426) | TCGA-AA-3984-01 | Colorectum | colon adenocarcinoma | Female | <65 | I/II | Unknown | Unknown | SD |
| GTPBP4 | SNV | Missense_Mutation | c.1606N>A | p.Asp536Asn | p.D536N | Q9BZE4 | protein_coding | tolerated(0.32) | benign(0) | TCGA-AA-A00N-01 | Colorectum | colon adenocarcinoma | Male | >=65 | I/II | Unknown | Unknown | PD |
| Page: 1 2 3 4 5 6 |
Top |
Related drugs of malignant transformation related genes |
| Identification of chemicals and drugs interact with genes involved in malignant transfromation |
| (DGIdb 4.0) |
| Entrez ID | Symbol | Category | Interaction Types | Drug Claim Name | Drug Name | PMIDs |
| Page: 1 |

Copyright 2023-Present -The University of Texas Health Science Center at Houston |