
|
|||||
|
 | |
| |
| |
| |
| |
| |
|
Gene: GTF3C3 |
Gene summary for GTF3C3 |
| Gene information | Species | Human | Gene symbol | GTF3C3 | Gene ID | 9330 |
| Gene name | general transcription factor IIIC subunit 3 | |
| Gene Alias | TFIIIC102 | |
| Cytomap | 2q33.1 | |
| Gene Type | protein-coding | GO ID | GO:0006139 | UniProtAcc | Q9Y5Q9 |
Top |
Malignant transformation analysis |
| Identification of the aberrant gene expression in precancerous and cancerous lesions by comparing the gene expression of stem-like cells in diseased tissues with normal stem cells |
| Entrez ID | Symbol | Replicates | Species | Organ | Tissue | Adj P-value | Log2FC | Malignancy |
| 9330 | GTF3C3 | LZE4T | Human | Esophagus | ESCC | 1.09e-05 | 2.31e-01 | 0.0811 |
| 9330 | GTF3C3 | LZE7T | Human | Esophagus | ESCC | 2.69e-06 | 3.79e-01 | 0.0667 |
| 9330 | GTF3C3 | LZE8T | Human | Esophagus | ESCC | 4.22e-04 | 1.44e-01 | 0.067 |
| 9330 | GTF3C3 | LZE20T | Human | Esophagus | ESCC | 3.73e-02 | 1.08e-01 | 0.0662 |
| 9330 | GTF3C3 | LZE24T | Human | Esophagus | ESCC | 1.17e-06 | 2.18e-01 | 0.0596 |
| 9330 | GTF3C3 | LZE21T | Human | Esophagus | ESCC | 1.98e-02 | 1.86e-01 | 0.0655 |
| 9330 | GTF3C3 | P1T-E | Human | Esophagus | ESCC | 2.06e-04 | 4.43e-01 | 0.0875 |
| 9330 | GTF3C3 | P2T-E | Human | Esophagus | ESCC | 5.68e-14 | 2.99e-01 | 0.1177 |
| 9330 | GTF3C3 | P4T-E | Human | Esophagus | ESCC | 2.73e-15 | 3.64e-01 | 0.1323 |
| 9330 | GTF3C3 | P5T-E | Human | Esophagus | ESCC | 6.37e-06 | 1.94e-01 | 0.1327 |
| 9330 | GTF3C3 | P8T-E | Human | Esophagus | ESCC | 5.12e-07 | 1.81e-01 | 0.0889 |
| 9330 | GTF3C3 | P9T-E | Human | Esophagus | ESCC | 4.40e-07 | 1.47e-01 | 0.1131 |
| 9330 | GTF3C3 | P10T-E | Human | Esophagus | ESCC | 1.80e-15 | 2.83e-01 | 0.116 |
| 9330 | GTF3C3 | P12T-E | Human | Esophagus | ESCC | 4.16e-22 | 4.27e-01 | 0.1122 |
| 9330 | GTF3C3 | P15T-E | Human | Esophagus | ESCC | 2.10e-24 | 5.58e-01 | 0.1149 |
| 9330 | GTF3C3 | P16T-E | Human | Esophagus | ESCC | 1.81e-20 | 3.73e-01 | 0.1153 |
| 9330 | GTF3C3 | P17T-E | Human | Esophagus | ESCC | 3.20e-02 | 2.76e-01 | 0.1278 |
| 9330 | GTF3C3 | P20T-E | Human | Esophagus | ESCC | 2.95e-11 | 2.85e-01 | 0.1124 |
| 9330 | GTF3C3 | P21T-E | Human | Esophagus | ESCC | 1.17e-19 | 3.04e-01 | 0.1617 |
| 9330 | GTF3C3 | P22T-E | Human | Esophagus | ESCC | 1.68e-12 | 2.31e-01 | 0.1236 |
| Page: 1 2 3 4 |
| Tissue | Expression Dynamics | Abbreviation |
| Esophagus |  | ESCC: Esophageal squamous cell carcinoma |
| HGIN: High-grade intraepithelial neoplasias | ||
| LGIN: Low-grade intraepithelial neoplasias | ||
| Liver | 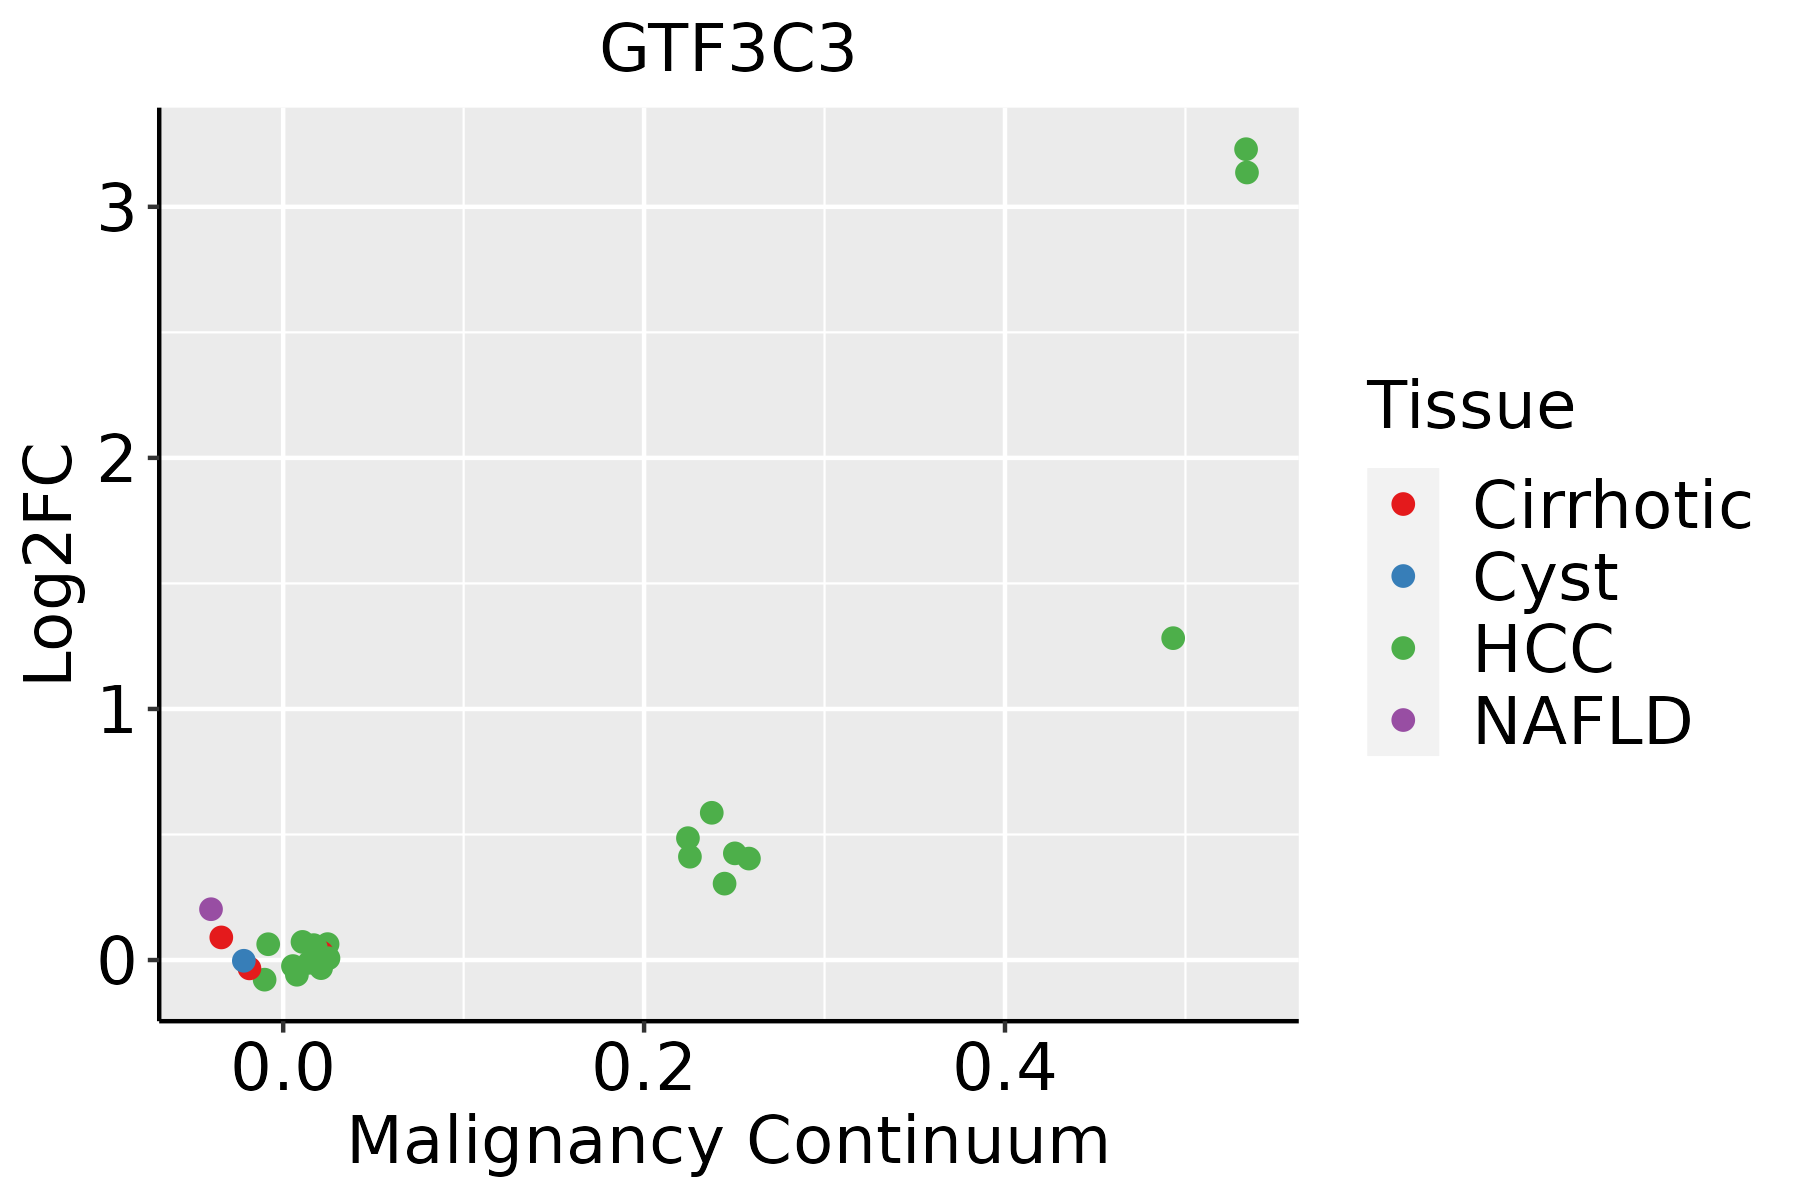 | HCC: Hepatocellular carcinoma |
| NAFLD: Non-alcoholic fatty liver disease | ||
| Oral Cavity | 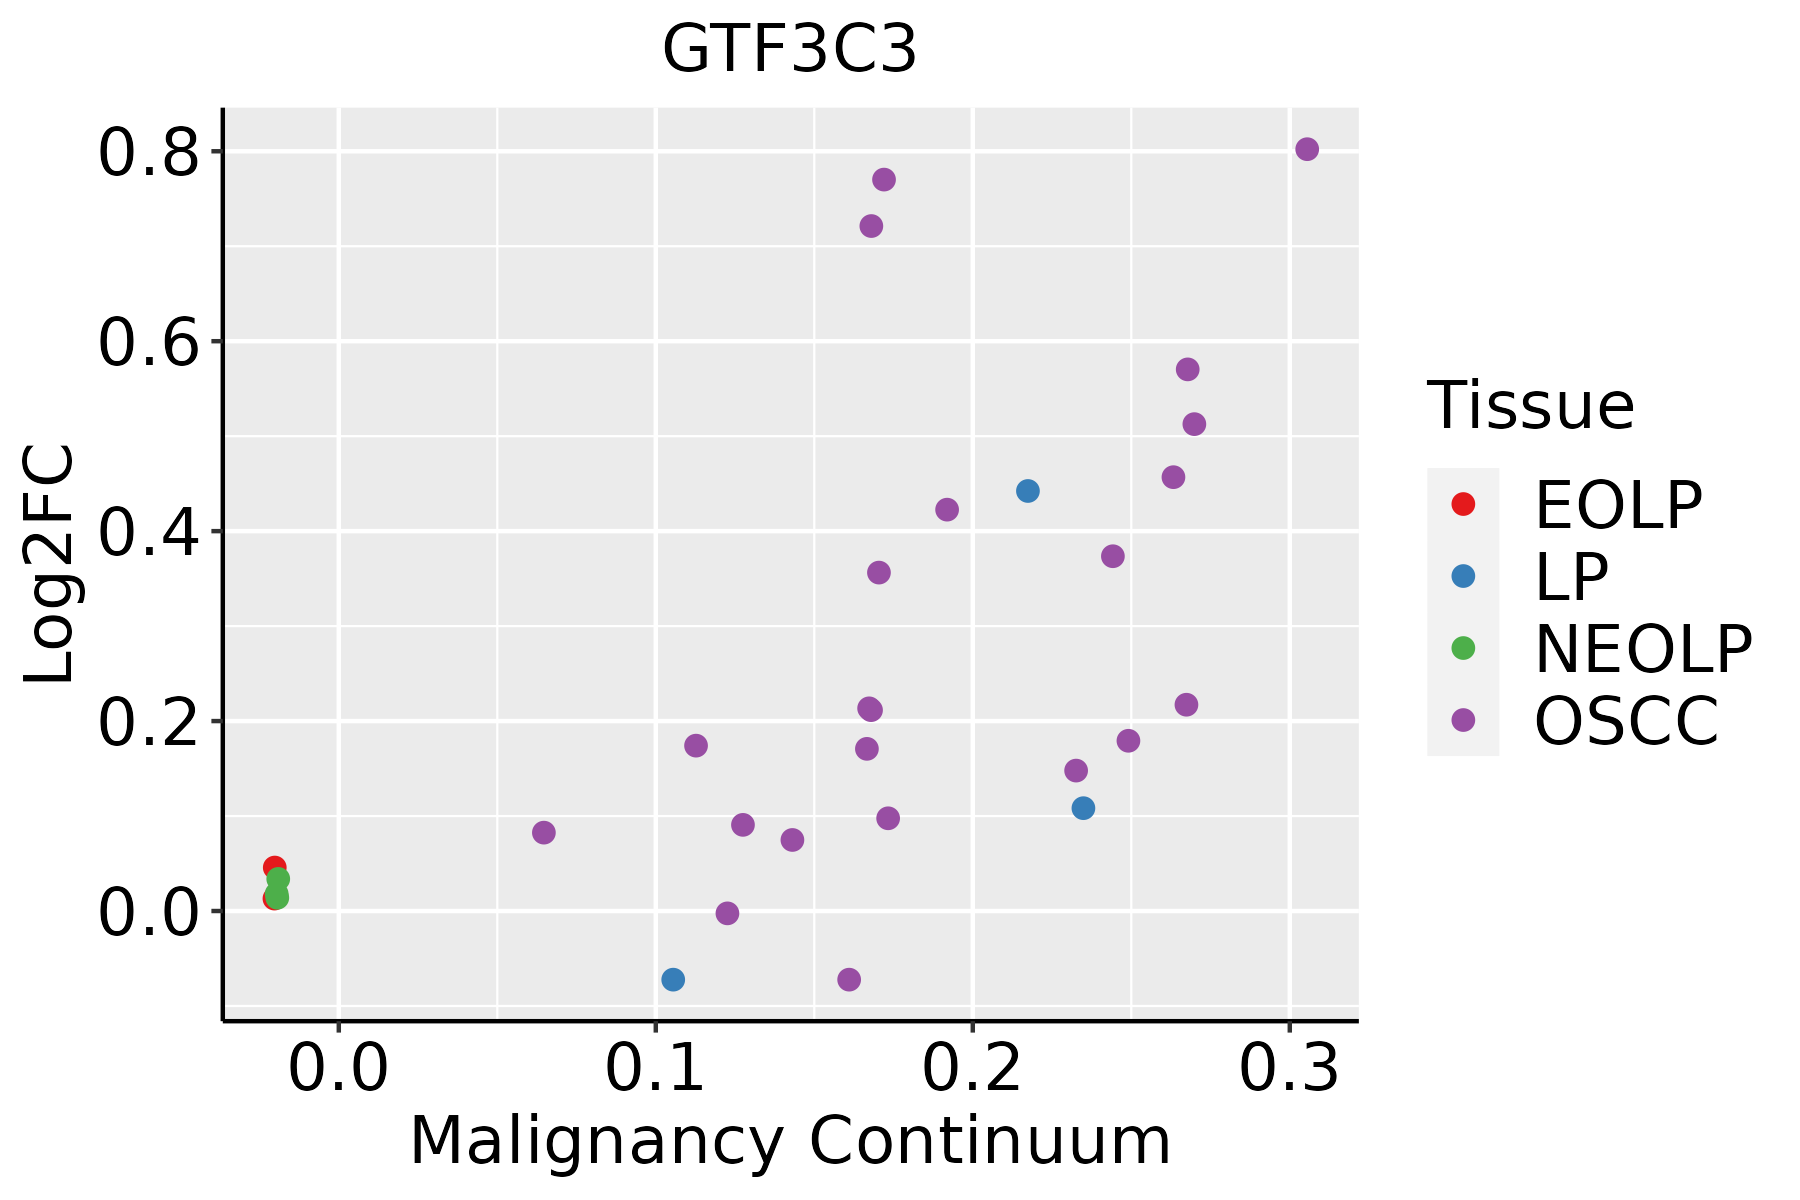 | EOLP: Erosive Oral lichen planus |
| LP: leukoplakia | ||
| NEOLP: Non-erosive oral lichen planus | ||
| OSCC: Oral squamous cell carcinoma |
| ∗log2FC in expression of this searched gene in stem-like cells from each diseased tissue sample relative to stem-like cells in normal samples in each tissue plotted against the malignancy continuum. Samples are colored based on if they are from different disease stage. |
Top |
Malignant transformation related pathway analysis |
| Find out the enriched GO biological processes and KEGG pathways involved in transition from healthy to precancer to cancer |
| Tissue | Disease Stage | Enriched GO biological Processes |
| Colorectum | AD |  |
| Colorectum | SER |  |
| Colorectum | MSS |  |
| Colorectum | MSI-H |  |
| Colorectum | FAP |  |
| ∗Top 15 enriched GO BP terms are showed in the bar plot of each disease state in each tissue. Each row represents a significant GO biological process which is colored according to the -log10(p.adjust). |
| Page: 1 2 3 4 5 6 7 8 9 |
| GO ID | Tissue | Disease Stage | Description | Gene Ratio | Bg Ratio | pvalue | p.adjust | Count |
| GO:00063833 | Esophagus | ESCC | transcription by RNA polymerase III | 41/8552 | 46/18723 | 7.69e-10 | 1.90e-08 | 41 |
| GO:00987812 | Esophagus | ESCC | ncRNA transcription | 45/8552 | 56/18723 | 1.05e-07 | 1.72e-06 | 45 |
| GO:00093032 | Esophagus | ESCC | rRNA transcription | 28/8552 | 34/18723 | 1.21e-05 | 1.12e-04 | 28 |
| GO:0009303 | Liver | HCC | rRNA transcription | 25/7958 | 34/18723 | 2.42e-04 | 1.81e-03 | 25 |
| GO:0006383 | Liver | HCC | transcription by RNA polymerase III | 31/7958 | 46/18723 | 5.67e-04 | 3.61e-03 | 31 |
| GO:0098781 | Liver | HCC | ncRNA transcription | 33/7958 | 56/18723 | 9.64e-03 | 3.63e-02 | 33 |
| GO:00063832 | Oral cavity | OSCC | transcription by RNA polymerase III | 34/7305 | 46/18723 | 1.61e-06 | 2.11e-05 | 34 |
| GO:00987811 | Oral cavity | OSCC | ncRNA transcription | 38/7305 | 56/18723 | 1.15e-05 | 1.18e-04 | 38 |
| GO:00093031 | Oral cavity | OSCC | rRNA transcription | 24/7305 | 34/18723 | 1.89e-04 | 1.28e-03 | 24 |
| GO:00063831 | Oral cavity | LP | transcription by RNA polymerase III | 20/4623 | 46/18723 | 4.03e-03 | 2.61e-02 | 20 |
| Page: 1 |
| Pathway ID | Tissue | Disease Stage | Description | Gene Ratio | Bg Ratio | pvalue | p.adjust | qvalue | Count |
| Page: 1 |
Top |
Cell-cell communication analysis |
| Identification of potential cell-cell interactions between two cell types and their ligand-receptor pairs for different disease states |
| Ligand | Receptor | LRpair | Pathway | Tissue | Disease Stage |
| Page: 1 |
Top |
Single-cell gene regulatory network inference analysis |
| Find out the significant the regulons (TFs) and the target genes of each regulon across cell types for different disease states |
| TF | Cell Type | Tissue | Disease Stage | Target Gene | RSS | Regulon Activity |
| ∗The dot plots of a searched regulon are shown for all cell subpopulations in each disease state of each tissue based on the regulon specific score inferred using pySCENIC and by calculating the average expression. |
| Page: 1 |
Top |
Somatic mutation of malignant transformation related genes |
| Annotation of somatic variants for genes involved in malignant transformation |
| Hugo Symbol | Variant Class | Variant Classification | dbSNP RS | HGVSc | HGVSp | HGVSp Short | SWISSPROT | BIOTYPE | SIFT | PolyPhen | Tumor Sample Barcode | Tissue | Histology | Sex | Age | Stage | Therapy Types | Drugs | Outcome |
| GTF3C3 | SNV | Missense_Mutation | c.154G>A | p.Glu52Lys | p.E52K | Q9Y5Q9 | protein_coding | tolerated_low_confidence(0.4) | benign(0.007) | TCGA-AO-A0JM-01 | Breast | breast invasive carcinoma | Female | <65 | I/II | Chemotherapy | doxorubicin | SD | |
| GTF3C3 | SNV | Missense_Mutation | rs377186267 | c.1013N>G | p.Ser338Cys | p.S338C | Q9Y5Q9 | protein_coding | tolerated(0.08) | benign(0.43) | TCGA-C8-A26Y-01 | Breast | breast invasive carcinoma | Female | >=65 | I/II | Unknown | Unknown | SD |
| GTF3C3 | SNV | Missense_Mutation | novel | c.1913A>G | p.Asp638Gly | p.D638G | Q9Y5Q9 | protein_coding | deleterious(0.03) | benign(0.02) | TCGA-2W-A8YY-01 | Cervix | cervical & endocervical cancer | Female | <65 | I/II | Chemotherapy | cisplatin | CR |
| GTF3C3 | SNV | Missense_Mutation | novel | c.1381N>T | p.Arg461Cys | p.R461C | Q9Y5Q9 | protein_coding | deleterious(0) | probably_damaging(0.995) | TCGA-EA-A410-01 | Cervix | cervical & endocervical cancer | Female | <65 | I/II | Unknown | Unknown | SD |
| GTF3C3 | deletion | Frame_Shift_Del | novel | c.16_34delNNNNNNNNNNNNNNNNNNN | p.Pro6TrpfsTer67 | p.P6Wfs*67 | Q9Y5Q9 | protein_coding | TCGA-FU-A23L-01 | Cervix | cervical & endocervical cancer | Female | <65 | I/II | Chemotherapy | cisplatin | CR | ||
| GTF3C3 | SNV | Missense_Mutation | rs768859221 | c.827N>A | p.Arg276His | p.R276H | Q9Y5Q9 | protein_coding | tolerated(0.1) | possibly_damaging(0.86) | TCGA-A6-5661-01 | Colorectum | colon adenocarcinoma | Female | >=65 | I/II | Unknown | Unknown | SD |
| GTF3C3 | SNV | Missense_Mutation | c.1855G>A | p.Val619Ile | p.V619I | Q9Y5Q9 | protein_coding | tolerated(0.3) | benign(0.072) | TCGA-AA-3977-01 | Colorectum | colon adenocarcinoma | Male | >=65 | I/II | Unknown | Unknown | SD | |
| GTF3C3 | SNV | Missense_Mutation | rs375124162 | c.2405N>A | p.Arg802Gln | p.R802Q | Q9Y5Q9 | protein_coding | tolerated(0.34) | benign(0.079) | TCGA-AA-A010-01 | Colorectum | colon adenocarcinoma | Female | <65 | I/II | Chemotherapy | folinic | CR |
| GTF3C3 | SNV | Missense_Mutation | c.1159G>T | p.Asp387Tyr | p.D387Y | Q9Y5Q9 | protein_coding | deleterious(0) | probably_damaging(0.999) | TCGA-AD-6964-01 | Colorectum | colon adenocarcinoma | Male | <65 | III/IV | Chemotherapy | folfox | PD | |
| GTF3C3 | SNV | Missense_Mutation | c.2104C>T | p.Leu702Phe | p.L702F | Q9Y5Q9 | protein_coding | tolerated(0.06) | probably_damaging(0.984) | TCGA-AM-5821-01 | Colorectum | colon adenocarcinoma | Female | >=65 | I/II | Unknown | Unknown | SD |
| Page: 1 2 3 4 5 6 7 8 9 10 |
Top |
Related drugs of malignant transformation related genes |
| Identification of chemicals and drugs interact with genes involved in malignant transfromation |
| (DGIdb 4.0) |
| Entrez ID | Symbol | Category | Interaction Types | Drug Claim Name | Drug Name | PMIDs |
| Page: 1 |

Copyright 2023-Present -The University of Texas Health Science Center at Houston |