
|
|||||
|
 | |
| |
| |
| |
| |
| |
|
Gene: GTF3C2 |
Gene summary for GTF3C2 |
| Gene information | Species | Human | Gene symbol | GTF3C2 | Gene ID | 2976 |
| Gene name | general transcription factor IIIC subunit 2 | |
| Gene Alias | TF3C-beta | |
| Cytomap | 2p23.3 | |
| Gene Type | protein-coding | GO ID | GO:0006139 | UniProtAcc | Q8WUA4 |
Top |
Malignant transformation analysis |
| Identification of the aberrant gene expression in precancerous and cancerous lesions by comparing the gene expression of stem-like cells in diseased tissues with normal stem cells |
| Entrez ID | Symbol | Replicates | Species | Organ | Tissue | Adj P-value | Log2FC | Malignancy |
| 2976 | GTF3C2 | LZE4T | Human | Esophagus | ESCC | 7.45e-05 | 1.48e-01 | 0.0811 |
| 2976 | GTF3C2 | LZE7T | Human | Esophagus | ESCC | 1.24e-05 | 3.32e-01 | 0.0667 |
| 2976 | GTF3C2 | LZE8T | Human | Esophagus | ESCC | 1.26e-03 | 3.08e-02 | 0.067 |
| 2976 | GTF3C2 | LZE20T | Human | Esophagus | ESCC | 3.80e-05 | 5.08e-02 | 0.0662 |
| 2976 | GTF3C2 | LZE24T | Human | Esophagus | ESCC | 6.98e-07 | 2.29e-01 | 0.0596 |
| 2976 | GTF3C2 | LZE21T | Human | Esophagus | ESCC | 1.93e-04 | 2.30e-01 | 0.0655 |
| 2976 | GTF3C2 | LZE6T | Human | Esophagus | ESCC | 3.72e-03 | 1.97e-01 | 0.0845 |
| 2976 | GTF3C2 | P1T-E | Human | Esophagus | ESCC | 3.57e-05 | 3.34e-01 | 0.0875 |
| 2976 | GTF3C2 | P2T-E | Human | Esophagus | ESCC | 3.08e-31 | 5.13e-01 | 0.1177 |
| 2976 | GTF3C2 | P4T-E | Human | Esophagus | ESCC | 1.20e-05 | 1.78e-01 | 0.1323 |
| 2976 | GTF3C2 | P5T-E | Human | Esophagus | ESCC | 4.01e-14 | 1.92e-01 | 0.1327 |
| 2976 | GTF3C2 | P8T-E | Human | Esophagus | ESCC | 4.12e-17 | 2.80e-01 | 0.0889 |
| 2976 | GTF3C2 | P9T-E | Human | Esophagus | ESCC | 4.36e-07 | 1.14e-01 | 0.1131 |
| 2976 | GTF3C2 | P10T-E | Human | Esophagus | ESCC | 1.04e-28 | 4.21e-01 | 0.116 |
| 2976 | GTF3C2 | P11T-E | Human | Esophagus | ESCC | 2.63e-08 | 3.77e-01 | 0.1426 |
| 2976 | GTF3C2 | P12T-E | Human | Esophagus | ESCC | 8.97e-28 | 3.12e-01 | 0.1122 |
| 2976 | GTF3C2 | P15T-E | Human | Esophagus | ESCC | 3.33e-28 | 5.76e-01 | 0.1149 |
| 2976 | GTF3C2 | P16T-E | Human | Esophagus | ESCC | 9.86e-21 | 2.44e-01 | 0.1153 |
| 2976 | GTF3C2 | P17T-E | Human | Esophagus | ESCC | 1.92e-05 | 2.01e-01 | 0.1278 |
| 2976 | GTF3C2 | P19T-E | Human | Esophagus | ESCC | 5.91e-04 | 2.92e-01 | 0.1662 |
| Page: 1 2 3 4 5 |
| Tissue | Expression Dynamics | Abbreviation |
| Esophagus | 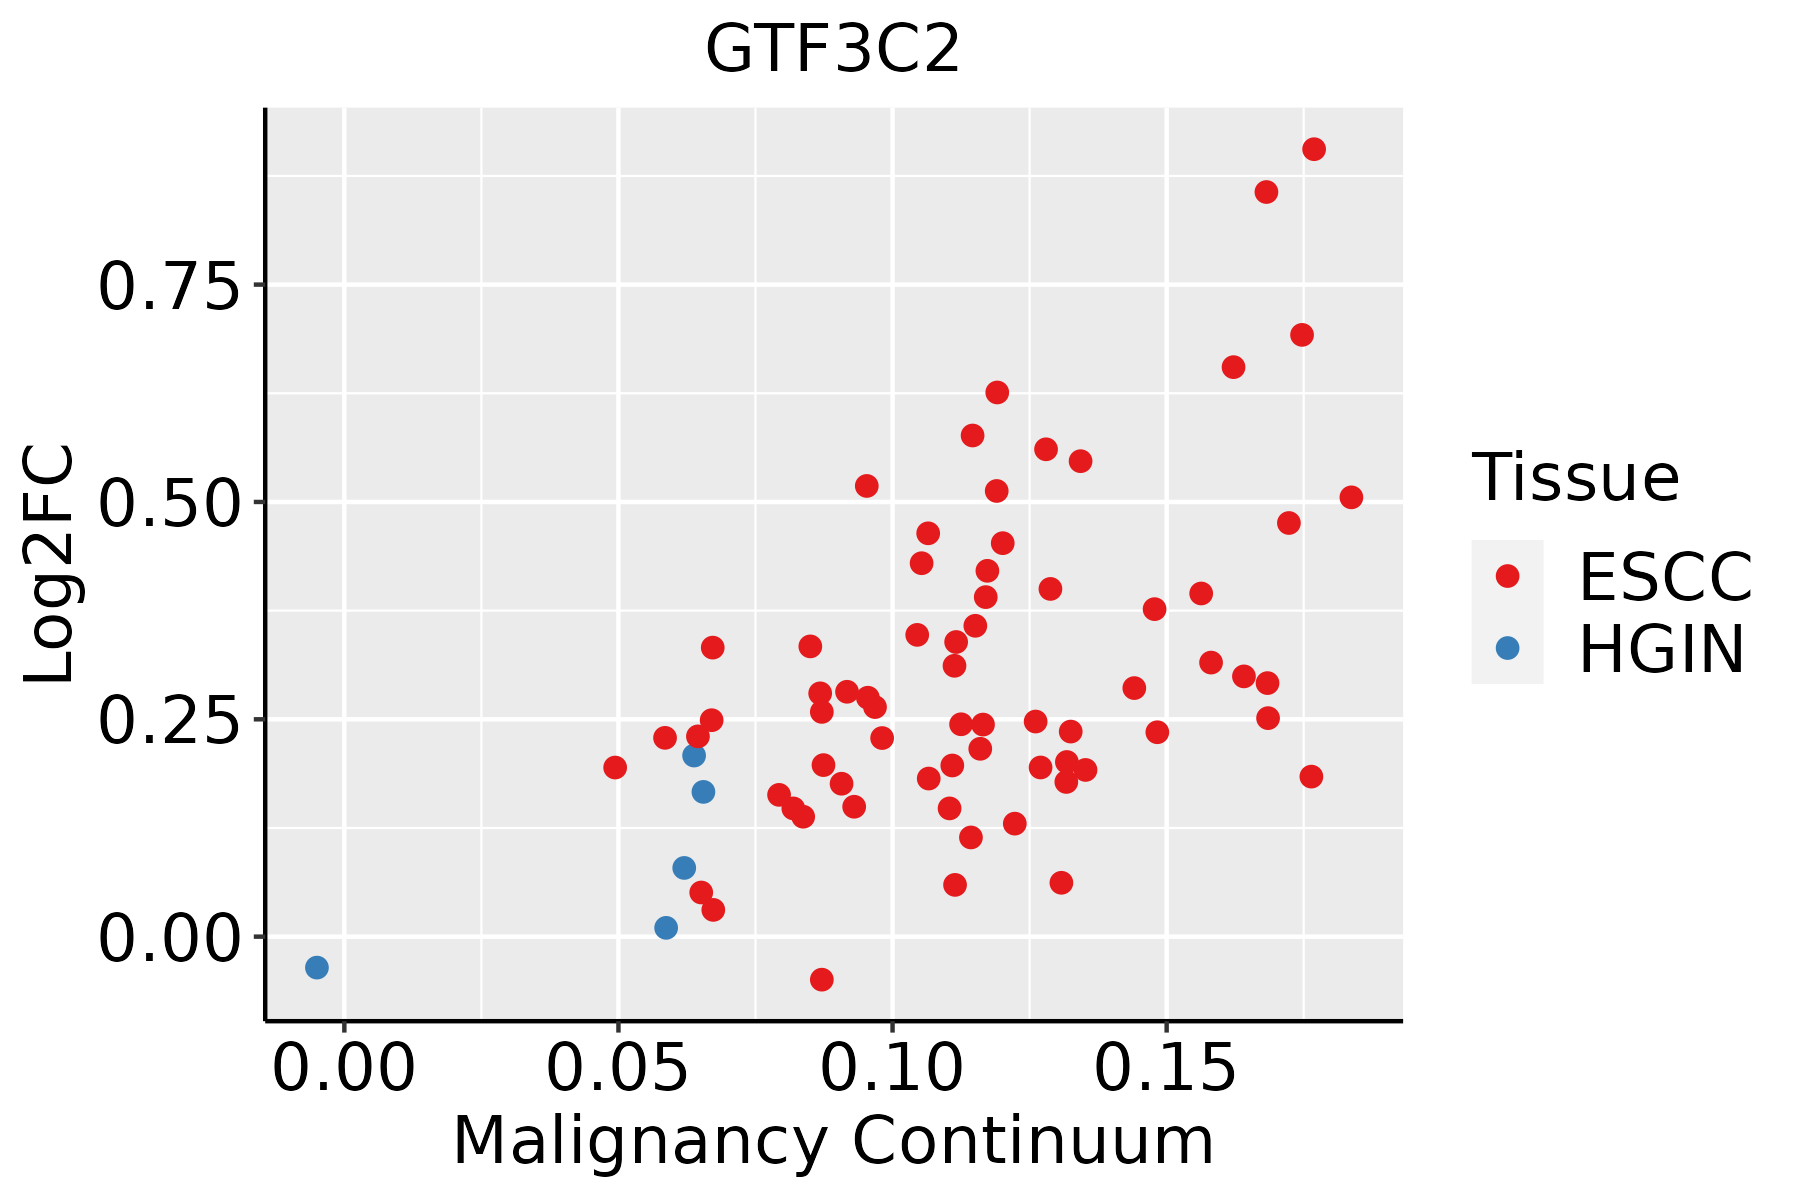 | ESCC: Esophageal squamous cell carcinoma |
| HGIN: High-grade intraepithelial neoplasias | ||
| LGIN: Low-grade intraepithelial neoplasias | ||
| Liver | 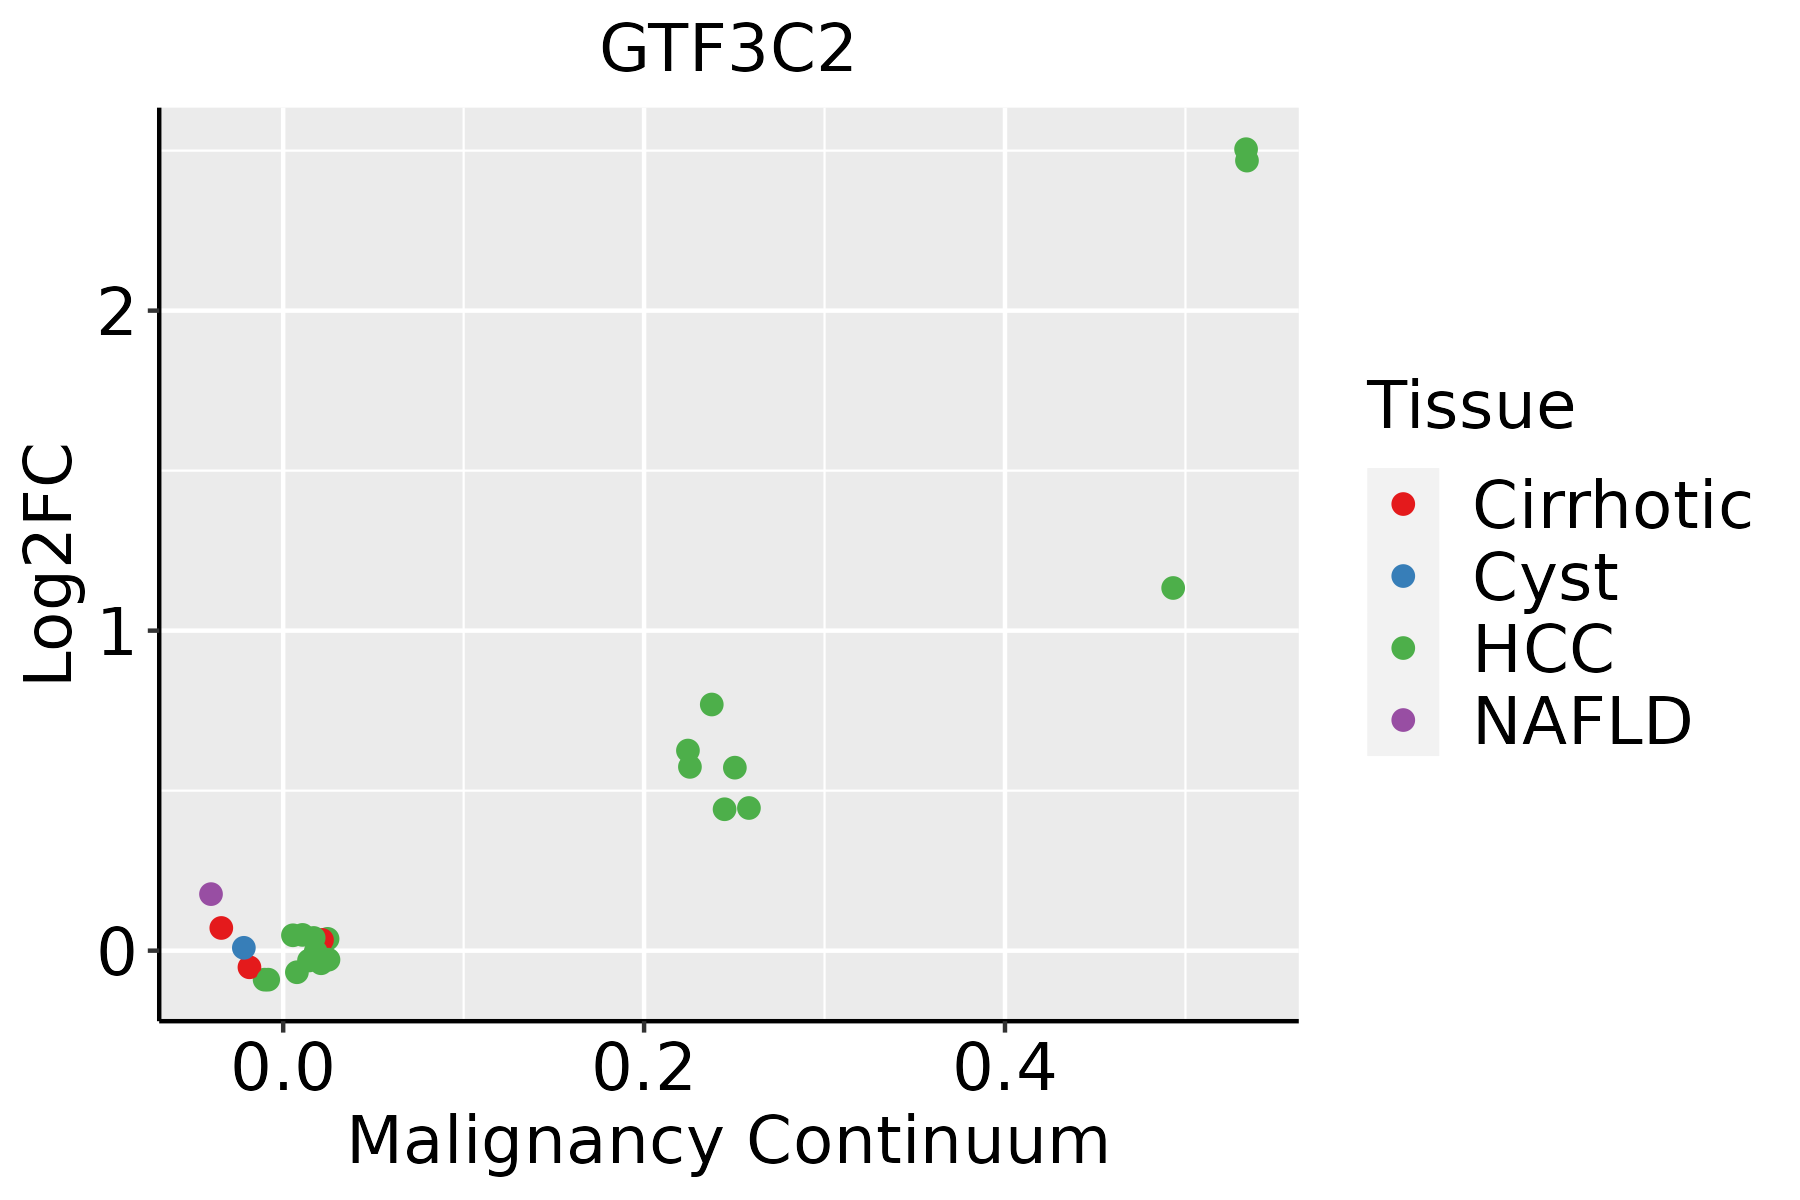 | HCC: Hepatocellular carcinoma |
| NAFLD: Non-alcoholic fatty liver disease | ||
| Oral Cavity | 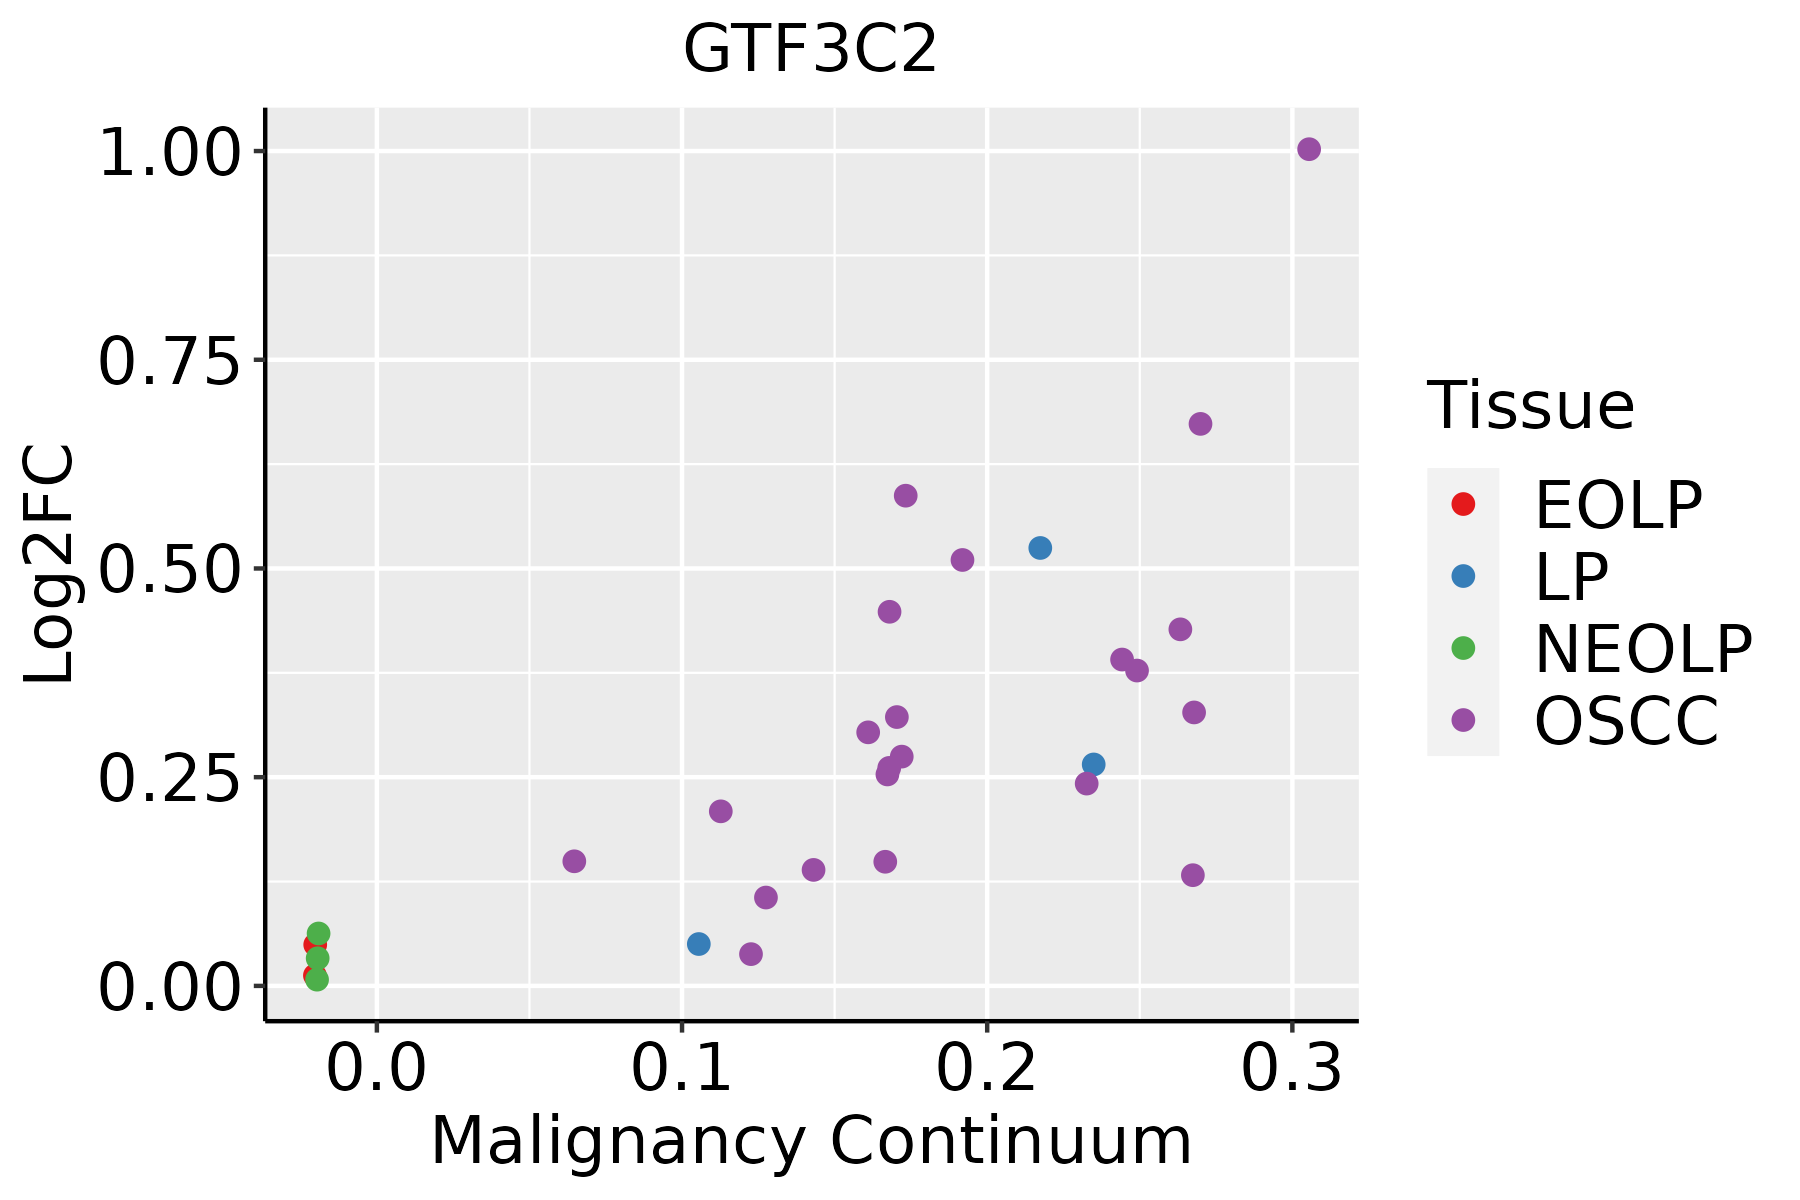 | EOLP: Erosive Oral lichen planus |
| LP: leukoplakia | ||
| NEOLP: Non-erosive oral lichen planus | ||
| OSCC: Oral squamous cell carcinoma |
| ∗log2FC in expression of this searched gene in stem-like cells from each diseased tissue sample relative to stem-like cells in normal samples in each tissue plotted against the malignancy continuum. Samples are colored based on if they are from different disease stage. |
Top |
Malignant transformation related pathway analysis |
| Find out the enriched GO biological processes and KEGG pathways involved in transition from healthy to precancer to cancer |
| Tissue | Disease Stage | Enriched GO biological Processes |
| Colorectum | AD |  |
| Colorectum | SER |  |
| Colorectum | MSS |  |
| Colorectum | MSI-H |  |
| Colorectum | FAP |  |
| ∗Top 15 enriched GO BP terms are showed in the bar plot of each disease state in each tissue. Each row represents a significant GO biological process which is colored according to the -log10(p.adjust). |
| Page: 1 2 3 4 5 6 7 8 9 |
| GO ID | Tissue | Disease Stage | Description | Gene Ratio | Bg Ratio | pvalue | p.adjust | Count |
| GO:00063833 | Esophagus | ESCC | transcription by RNA polymerase III | 41/8552 | 46/18723 | 7.69e-10 | 1.90e-08 | 41 |
| GO:00987812 | Esophagus | ESCC | ncRNA transcription | 45/8552 | 56/18723 | 1.05e-07 | 1.72e-06 | 45 |
| GO:00093032 | Esophagus | ESCC | rRNA transcription | 28/8552 | 34/18723 | 1.21e-05 | 1.12e-04 | 28 |
| GO:0009303 | Liver | HCC | rRNA transcription | 25/7958 | 34/18723 | 2.42e-04 | 1.81e-03 | 25 |
| GO:0006383 | Liver | HCC | transcription by RNA polymerase III | 31/7958 | 46/18723 | 5.67e-04 | 3.61e-03 | 31 |
| GO:0098781 | Liver | HCC | ncRNA transcription | 33/7958 | 56/18723 | 9.64e-03 | 3.63e-02 | 33 |
| GO:00063832 | Oral cavity | OSCC | transcription by RNA polymerase III | 34/7305 | 46/18723 | 1.61e-06 | 2.11e-05 | 34 |
| GO:00987811 | Oral cavity | OSCC | ncRNA transcription | 38/7305 | 56/18723 | 1.15e-05 | 1.18e-04 | 38 |
| GO:00093031 | Oral cavity | OSCC | rRNA transcription | 24/7305 | 34/18723 | 1.89e-04 | 1.28e-03 | 24 |
| Page: 1 |
| Pathway ID | Tissue | Disease Stage | Description | Gene Ratio | Bg Ratio | pvalue | p.adjust | qvalue | Count |
| Page: 1 |
Top |
Cell-cell communication analysis |
| Identification of potential cell-cell interactions between two cell types and their ligand-receptor pairs for different disease states |
| Ligand | Receptor | LRpair | Pathway | Tissue | Disease Stage |
| Page: 1 |
Top |
Single-cell gene regulatory network inference analysis |
| Find out the significant the regulons (TFs) and the target genes of each regulon across cell types for different disease states |
| TF | Cell Type | Tissue | Disease Stage | Target Gene | RSS | Regulon Activity |
| GTF3C2 | MSC.ADIPO | Breast | DCIS | PCDH17,P2RY6,HEG1, etc. | 2.17e-01 |  |
| GTF3C2 | MVA | Breast | DCIS | PCDH17,P2RY6,HEG1, etc. | 4.07e-02 | |
| GTF3C2 | MSC.ADIPO | Breast | IDC | PCDH17,P2RY6,HEG1, etc. | 2.99e-01 |  |
| GTF3C2 | PLA | Endometrium | EEC | ALOX12-AS1,PMM2,HSP90B1, etc. | 8.39e-02 |  |
| GTF3C2 | NK | Lung | AIS | SERPING1,TTLL12,AL035446.2, etc. | 1.03e-02 |  |
| GTF3C2 | CD8TRM | Pancreas | ADJ | NINL,USP31,GZMA, etc. | 7.55e-03 |  |
| GTF3C2 | CD8TRM | Pancreas | Healthy | NINL,USP31,GZMA, etc. | 6.67e-02 |  |
| GTF3C2 | NKT | Pancreas | Healthy | NINL,USP31,GZMA, etc. | 3.60e-02 | |
| GTF3C2 | NKT | Pancreas | PanIN | NINL,USP31,GZMA, etc. | 1.43e-01 |  |
| GTF3C2 | CD8TRM | Pancreas | PanIN | NINL,USP31,GZMA, etc. | 1.10e-01 | |
| ∗The dot plots of a searched regulon are shown for all cell subpopulations in each disease state of each tissue based on the regulon specific score inferred using pySCENIC and by calculating the average expression. |
| Page: 1 2 |
Top |
Somatic mutation of malignant transformation related genes |
| Annotation of somatic variants for genes involved in malignant transformation |
| Hugo Symbol | Variant Class | Variant Classification | dbSNP RS | HGVSc | HGVSp | HGVSp Short | SWISSPROT | BIOTYPE | SIFT | PolyPhen | Tumor Sample Barcode | Tissue | Histology | Sex | Age | Stage | Therapy Types | Drugs | Outcome |
| GTF3C2 | SNV | Missense_Mutation | c.2122G>A | p.Val708Ile | p.V708I | Q8WUA4 | protein_coding | tolerated(0.08) | possibly_damaging(0.829) | TCGA-A2-A25D-01 | Breast | breast invasive carcinoma | Female | >=65 | III/IV | Hormone Therapy | tamoxiphen | SD | |
| GTF3C2 | SNV | Missense_Mutation | c.953N>A | p.Arg318Gln | p.R318Q | Q8WUA4 | protein_coding | deleterious(0) | probably_damaging(0.992) | TCGA-AC-A23H-01 | Breast | breast invasive carcinoma | Female | >=65 | I/II | Unknown | Unknown | PD | |
| GTF3C2 | SNV | Missense_Mutation | c.1202N>T | p.Asp401Val | p.D401V | Q8WUA4 | protein_coding | deleterious(0) | benign(0.261) | TCGA-AO-A128-01 | Breast | breast invasive carcinoma | Female | <65 | I/II | Chemotherapy | doxorubicin | SD | |
| GTF3C2 | SNV | Missense_Mutation | novel | c.1760N>A | p.Thr587Asn | p.T587N | Q8WUA4 | protein_coding | deleterious(0) | benign(0.255) | TCGA-AR-A24W-01 | Breast | breast invasive carcinoma | Female | <65 | I/II | Hormone Therapy | letrozole | SD |
| GTF3C2 | SNV | Missense_Mutation | c.985N>C | p.Glu329Gln | p.E329Q | Q8WUA4 | protein_coding | deleterious(0.01) | possibly_damaging(0.867) | TCGA-D8-A73U-01 | Breast | breast invasive carcinoma | Female | >=65 | I/II | Hormone Therapy | tamoxiphen | SD | |
| GTF3C2 | SNV | Missense_Mutation | rs766482590 | c.784G>A | p.Gly262Ser | p.G262S | Q8WUA4 | protein_coding | tolerated(0.59) | benign(0.006) | TCGA-2W-A8YY-01 | Cervix | cervical & endocervical cancer | Female | <65 | I/II | Chemotherapy | cisplatin | CR |
| GTF3C2 | SNV | Missense_Mutation | c.2068G>C | p.Asp690His | p.D690H | Q8WUA4 | protein_coding | deleterious(0) | probably_damaging(0.991) | TCGA-EK-A3GK-01 | Cervix | cervical & endocervical cancer | Female | <65 | I/II | Unknown | Unknown | SD | |
| GTF3C2 | SNV | Missense_Mutation | c.116C>G | p.Ser39Cys | p.S39C | Q8WUA4 | protein_coding | tolerated_low_confidence(0.08) | benign(0) | TCGA-IR-A3LA-01 | Cervix | cervical & endocervical cancer | Female | <65 | I/II | Chemotherapy | cisplatin | CR | |
| GTF3C2 | SNV | Missense_Mutation | novel | c.526N>C | p.Glu176Gln | p.E176Q | Q8WUA4 | protein_coding | deleterious(0.04) | probably_damaging(0.979) | TCGA-VS-A953-01 | Cervix | cervical & endocervical cancer | Female | <65 | I/II | Unknown | Unknown | PD |
| GTF3C2 | SNV | Missense_Mutation | novel | c.2249G>A | p.Arg750Gln | p.R750Q | Q8WUA4 | protein_coding | deleterious(0) | probably_damaging(0.944) | TCGA-AA-3984-01 | Colorectum | colon adenocarcinoma | Female | <65 | I/II | Unknown | Unknown | SD |
| Page: 1 2 3 4 5 6 7 8 9 10 |
Top |
Related drugs of malignant transformation related genes |
| Identification of chemicals and drugs interact with genes involved in malignant transfromation |
| (DGIdb 4.0) |
| Entrez ID | Symbol | Category | Interaction Types | Drug Claim Name | Drug Name | PMIDs |
| Page: 1 |

Copyright 2023-Present -The University of Texas Health Science Center at Houston |