
|
|||||
|
 | |
| |
| |
| |
| |
| |
|
Gene: GTF2IRD1 |
Gene summary for GTF2IRD1 |
| Gene information | Species | Human | Gene symbol | GTF2IRD1 | Gene ID | 9569 |
| Gene name | GTF2I repeat domain containing 1 | |
| Gene Alias | BEN | |
| Cytomap | 7q11.23 | |
| Gene Type | protein-coding | GO ID | GO:0000122 | UniProtAcc | Q9UHL9 |
Top |
Malignant transformation analysis |
| Identification of the aberrant gene expression in precancerous and cancerous lesions by comparing the gene expression of stem-like cells in diseased tissues with normal stem cells |
| Entrez ID | Symbol | Replicates | Species | Organ | Tissue | Adj P-value | Log2FC | Malignancy |
| 9569 | GTF2IRD1 | CCI_1 | Human | Cervix | CC | 5.89e-18 | 1.25e+00 | 0.528 |
| 9569 | GTF2IRD1 | CCI_2 | Human | Cervix | CC | 2.67e-05 | 6.39e-01 | 0.5249 |
| 9569 | GTF2IRD1 | CCI_3 | Human | Cervix | CC | 2.32e-18 | 1.21e+00 | 0.516 |
| 9569 | GTF2IRD1 | HTA11_1938_2000001011 | Human | Colorectum | AD | 5.56e-04 | 6.04e-01 | -0.0811 |
| 9569 | GTF2IRD1 | HTA11_696_2000001011 | Human | Colorectum | AD | 1.10e-02 | 6.11e-01 | -0.1464 |
| 9569 | GTF2IRD1 | HTA11_1391_2000001011 | Human | Colorectum | AD | 1.07e-04 | 7.61e-01 | -0.059 |
| 9569 | GTF2IRD1 | HTA11_866_3004761011 | Human | Colorectum | AD | 2.78e-04 | 5.33e-01 | 0.096 |
| 9569 | GTF2IRD1 | HTA11_10711_2000001011 | Human | Colorectum | AD | 7.12e-07 | 8.11e-01 | 0.0338 |
| 9569 | GTF2IRD1 | HTA11_7696_3000711011 | Human | Colorectum | AD | 9.80e-25 | 9.23e-01 | 0.0674 |
| 9569 | GTF2IRD1 | HTA11_6818_2000001011 | Human | Colorectum | AD | 3.99e-07 | 8.39e-01 | 0.0112 |
| 9569 | GTF2IRD1 | HTA11_99999965104_69814 | Human | Colorectum | MSS | 2.22e-07 | 7.97e-01 | 0.281 |
| 9569 | GTF2IRD1 | HTA11_99999971662_82457 | Human | Colorectum | MSS | 4.02e-11 | 1.10e+00 | 0.3859 |
| 9569 | GTF2IRD1 | HTA11_99999973899_84307 | Human | Colorectum | MSS | 2.80e-18 | 1.45e+00 | 0.2585 |
| 9569 | GTF2IRD1 | HTA11_99999974143_84620 | Human | Colorectum | MSS | 3.13e-29 | 1.18e+00 | 0.3005 |
| 9569 | GTF2IRD1 | A001-C-207 | Human | Colorectum | FAP | 1.07e-05 | 2.99e-01 | 0.1278 |
| 9569 | GTF2IRD1 | A015-C-203 | Human | Colorectum | FAP | 6.67e-23 | -1.60e-01 | -0.1294 |
| 9569 | GTF2IRD1 | A015-C-204 | Human | Colorectum | FAP | 1.44e-04 | -6.56e-02 | -0.0228 |
| 9569 | GTF2IRD1 | A014-C-040 | Human | Colorectum | FAP | 5.29e-04 | -3.05e-01 | -0.1184 |
| 9569 | GTF2IRD1 | A002-C-201 | Human | Colorectum | FAP | 1.17e-10 | 3.17e-02 | 0.0324 |
| 9569 | GTF2IRD1 | A002-C-203 | Human | Colorectum | FAP | 1.09e-04 | 2.27e-01 | 0.2786 |
| Page: 1 2 3 4 5 6 7 |
| Tissue | Expression Dynamics | Abbreviation |
| Cervix |  | CC: Cervix cancer |
| HSIL_HPV: HPV-infected high-grade squamous intraepithelial lesions | ||
| N_HPV: HPV-infected normal cervix | ||
| Colorectum (GSE201348) |  | FAP: Familial adenomatous polyposis |
| CRC: Colorectal cancer | ||
| Colorectum (HTA11) |  | AD: Adenomas |
| SER: Sessile serrated lesions | ||
| MSI-H: Microsatellite-high colorectal cancer | ||
| MSS: Microsatellite stable colorectal cancer | ||
| Endometrium | 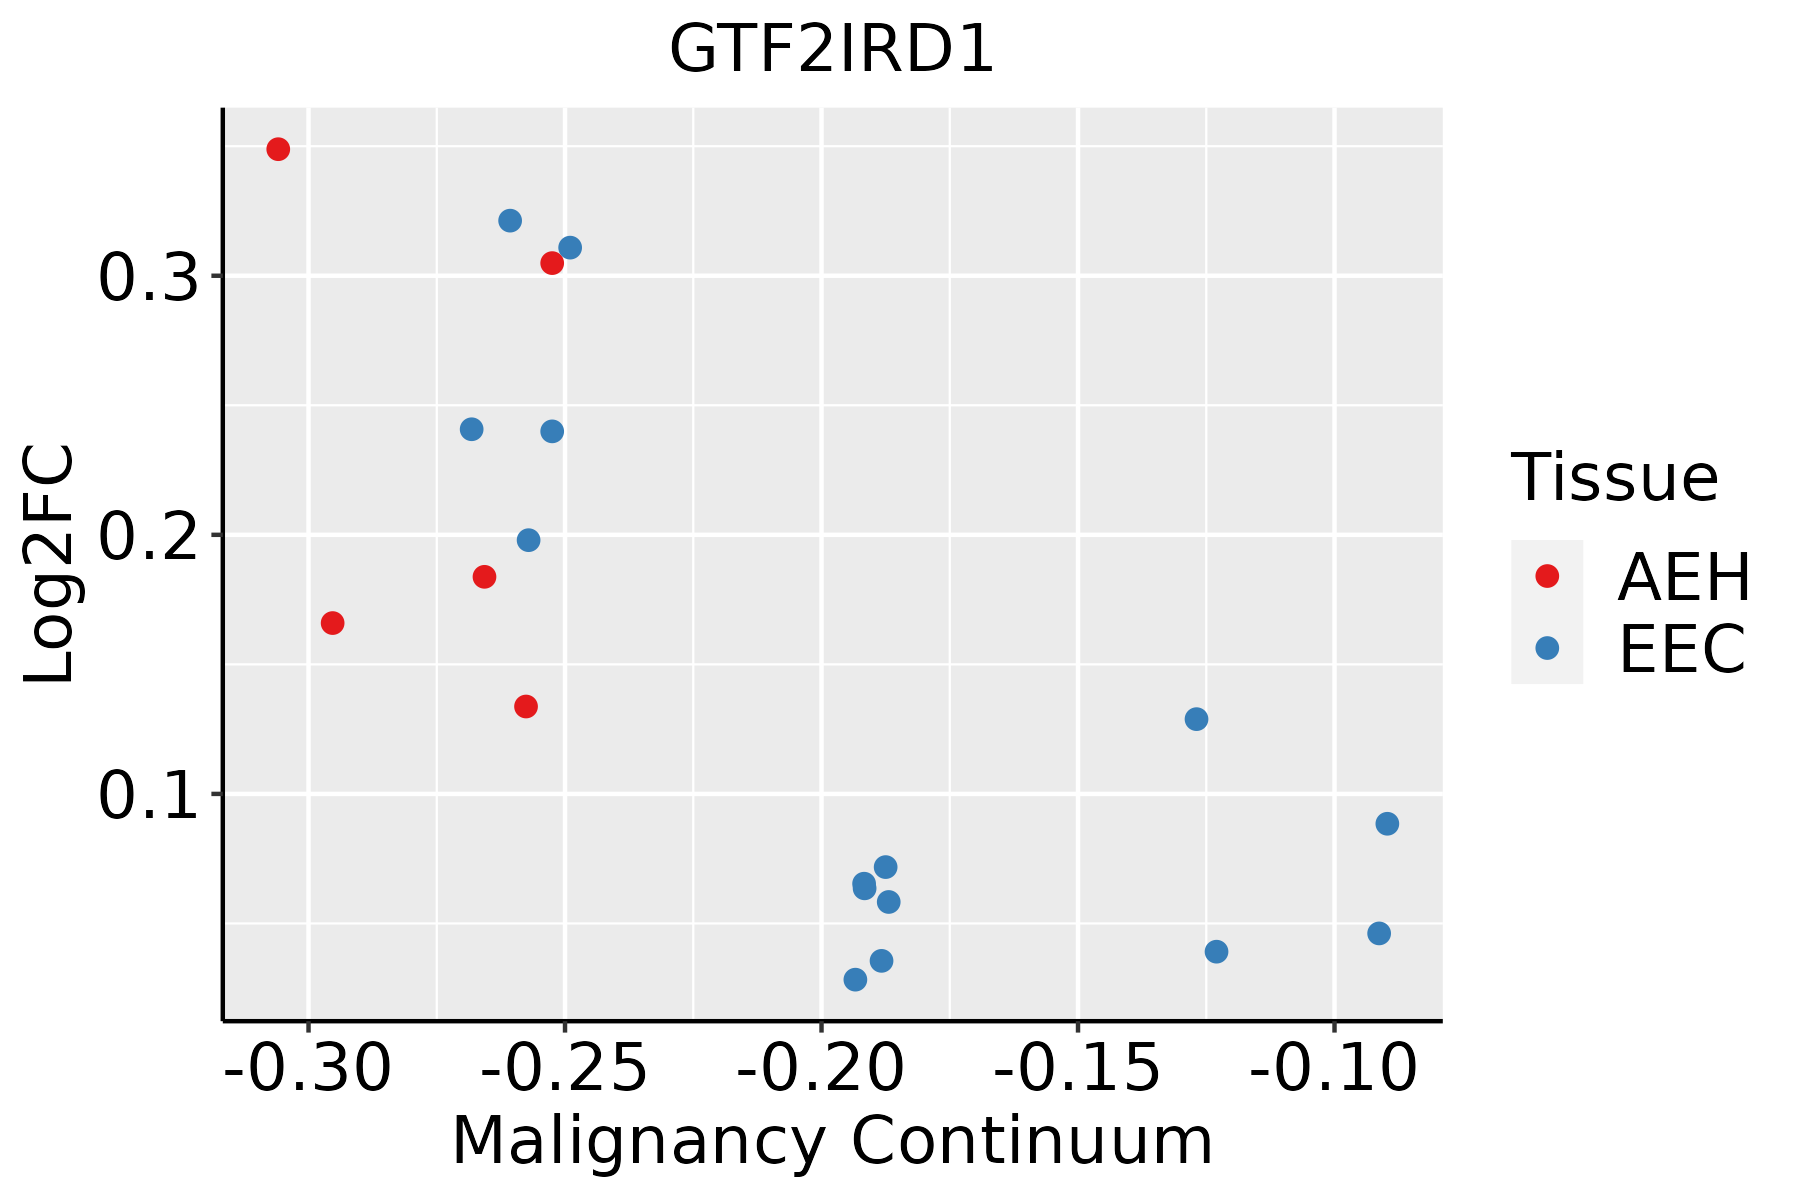 | AEH: Atypical endometrial hyperplasia |
| EEC: Endometrioid Cancer | ||
| Esophagus | 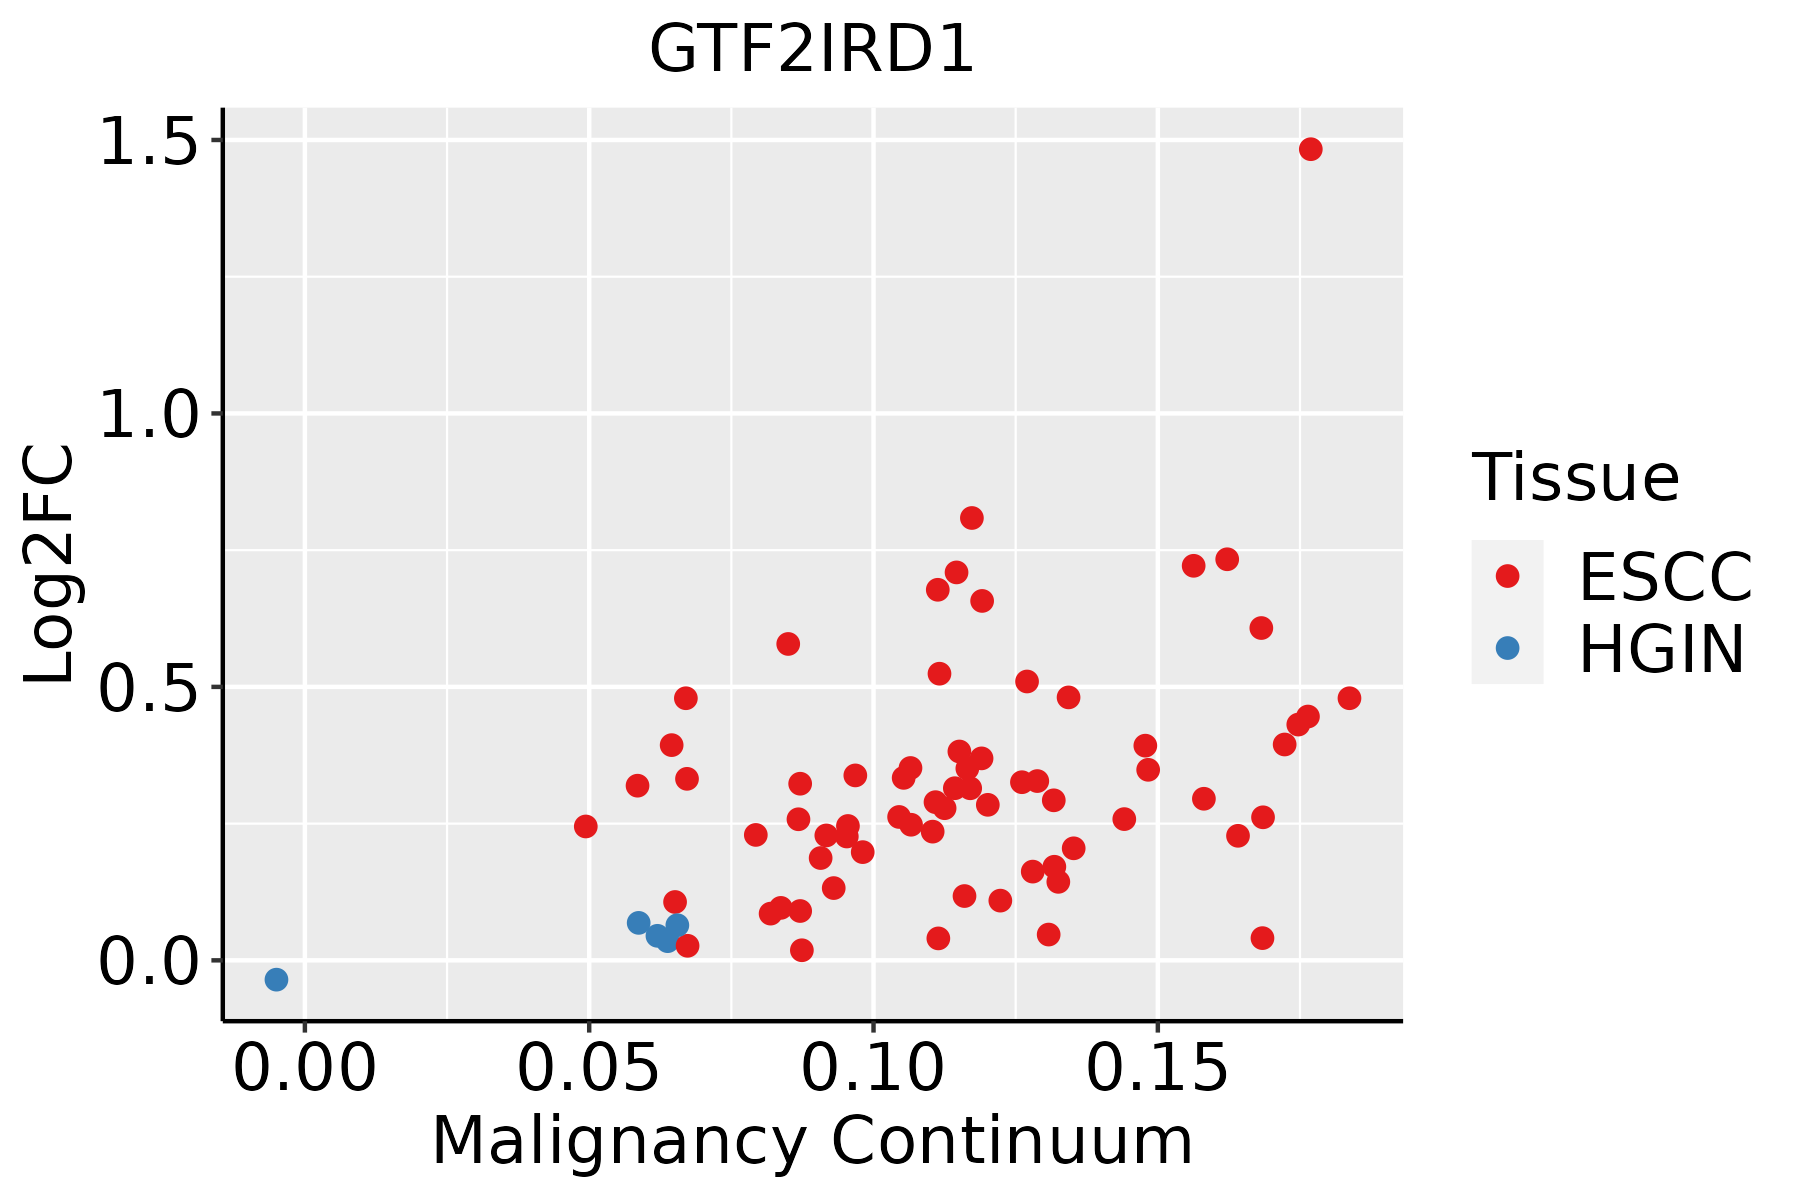 | ESCC: Esophageal squamous cell carcinoma |
| HGIN: High-grade intraepithelial neoplasias | ||
| LGIN: Low-grade intraepithelial neoplasias | ||
| Lung |  | AAH: Atypical adenomatous hyperplasia |
| AIS: Adenocarcinoma in situ | ||
| IAC: Invasive lung adenocarcinoma | ||
| MIA: Minimally invasive adenocarcinoma | ||
| Oral Cavity |  | EOLP: Erosive Oral lichen planus |
| LP: leukoplakia | ||
| NEOLP: Non-erosive oral lichen planus | ||
| OSCC: Oral squamous cell carcinoma |
| ∗log2FC in expression of this searched gene in stem-like cells from each diseased tissue sample relative to stem-like cells in normal samples in each tissue plotted against the malignancy continuum. Samples are colored based on if they are from different disease stage. |
Top |
Malignant transformation related pathway analysis |
| Find out the enriched GO biological processes and KEGG pathways involved in transition from healthy to precancer to cancer |
| Tissue | Disease Stage | Enriched GO biological Processes |
| Colorectum | AD |  |
| Colorectum | SER |  |
| Colorectum | MSS |  |
| Colorectum | MSI-H |  |
| Colorectum | FAP |  |
| ∗Top 15 enriched GO BP terms are showed in the bar plot of each disease state in each tissue. Each row represents a significant GO biological process which is colored according to the -log10(p.adjust). |
| Page: 1 2 3 4 5 6 7 8 9 |
| GO ID | Tissue | Disease Stage | Description | Gene Ratio | Bg Ratio | pvalue | p.adjust | Count |
| GO:00902578 | Cervix | CC | regulation of muscle system process | 45/2311 | 252/18723 | 6.73e-03 | 3.70e-02 | 45 |
| GO:00435024 | Cervix | CC | regulation of muscle adaptation | 21/2311 | 98/18723 | 7.71e-03 | 4.09e-02 | 21 |
| GO:0090257 | Colorectum | AD | regulation of muscle system process | 73/3918 | 252/18723 | 1.46e-03 | 1.24e-02 | 73 |
| GO:0043502 | Colorectum | AD | regulation of muscle adaptation | 31/3918 | 98/18723 | 8.45e-03 | 4.94e-02 | 31 |
| GO:00902572 | Colorectum | MSS | regulation of muscle system process | 66/3467 | 252/18723 | 1.55e-03 | 1.41e-02 | 66 |
| GO:00030121 | Colorectum | MSS | muscle system process | 105/3467 | 452/18723 | 6.39e-03 | 4.26e-02 | 105 |
| GO:00902574 | Colorectum | FAP | regulation of muscle system process | 58/2622 | 252/18723 | 7.22e-05 | 1.33e-03 | 58 |
| GO:00030122 | Colorectum | FAP | muscle system process | 89/2622 | 452/18723 | 4.63e-04 | 5.39e-03 | 89 |
| GO:00435022 | Colorectum | FAP | regulation of muscle adaptation | 26/2622 | 98/18723 | 7.75e-04 | 8.17e-03 | 26 |
| GO:00435001 | Colorectum | FAP | muscle adaptation | 28/2622 | 121/18723 | 4.50e-03 | 3.06e-02 | 28 |
| GO:00902575 | Colorectum | CRC | regulation of muscle system process | 51/2078 | 252/18723 | 1.49e-05 | 4.63e-04 | 51 |
| GO:00030123 | Colorectum | CRC | muscle system process | 74/2078 | 452/18723 | 3.92e-04 | 5.80e-03 | 74 |
| GO:00435023 | Colorectum | CRC | regulation of muscle adaptation | 21/2078 | 98/18723 | 2.22e-03 | 2.16e-02 | 21 |
| GO:00030126 | Endometrium | AEH | muscle system process | 78/2100 | 452/18723 | 6.89e-05 | 1.06e-03 | 78 |
| GO:00902579 | Endometrium | AEH | regulation of muscle system process | 44/2100 | 252/18723 | 1.92e-03 | 1.51e-02 | 44 |
| GO:000301213 | Endometrium | EEC | muscle system process | 79/2168 | 452/18723 | 1.16e-04 | 1.55e-03 | 79 |
| GO:009025712 | Endometrium | EEC | regulation of muscle system process | 44/2168 | 252/18723 | 3.51e-03 | 2.36e-02 | 44 |
| GO:00030124 | Lung | IAC | muscle system process | 71/2061 | 452/18723 | 1.29e-03 | 1.45e-02 | 71 |
| GO:00902577 | Lung | IAC | regulation of muscle system process | 43/2061 | 252/18723 | 2.35e-03 | 2.28e-02 | 43 |
| GO:000301211 | Lung | AIS | muscle system process | 63/1849 | 452/18723 | 3.18e-03 | 3.05e-02 | 63 |
| Page: 1 |
| Pathway ID | Tissue | Disease Stage | Description | Gene Ratio | Bg Ratio | pvalue | p.adjust | qvalue | Count |
| hsa04022 | Colorectum | MSS | cGMP-PKG signaling pathway | 51/1875 | 167/8465 | 6.83e-03 | 2.73e-02 | 1.67e-02 | 51 |
| hsa040221 | Colorectum | MSS | cGMP-PKG signaling pathway | 51/1875 | 167/8465 | 6.83e-03 | 2.73e-02 | 1.67e-02 | 51 |
| hsa040222 | Colorectum | FAP | cGMP-PKG signaling pathway | 42/1404 | 167/8465 | 2.84e-03 | 1.27e-02 | 7.70e-03 | 42 |
| hsa040223 | Colorectum | FAP | cGMP-PKG signaling pathway | 42/1404 | 167/8465 | 2.84e-03 | 1.27e-02 | 7.70e-03 | 42 |
| hsa030222 | Esophagus | ESCC | Basal transcription factors | 35/4205 | 45/8465 | 1.01e-04 | 4.06e-04 | 2.08e-04 | 35 |
| hsa0302211 | Esophagus | ESCC | Basal transcription factors | 35/4205 | 45/8465 | 1.01e-04 | 4.06e-04 | 2.08e-04 | 35 |
| hsa03022 | Oral cavity | OSCC | Basal transcription factors | 28/3704 | 45/8465 | 9.53e-03 | 2.11e-02 | 1.08e-02 | 28 |
| hsa030221 | Oral cavity | OSCC | Basal transcription factors | 28/3704 | 45/8465 | 9.53e-03 | 2.11e-02 | 1.08e-02 | 28 |
| Page: 1 |
Top |
Cell-cell communication analysis |
| Identification of potential cell-cell interactions between two cell types and their ligand-receptor pairs for different disease states |
| Ligand | Receptor | LRpair | Pathway | Tissue | Disease Stage |
| Page: 1 |
Top |
Single-cell gene regulatory network inference analysis |
| Find out the significant the regulons (TFs) and the target genes of each regulon across cell types for different disease states |
| TF | Cell Type | Tissue | Disease Stage | Target Gene | RSS | Regulon Activity |
| GTF2IRD1 | MSC.MVA | Cervix | CC | FP236383.3,NEAT1,KLHL11, etc. | 1.64e-01 |  |
| GTF2IRD1 | MMC | Lung | Healthy | GOLIM4,MR1,RHOU, etc. | 1.19e-03 |  |
| GTF2IRD1 | INCAF | Oral cavity | LP | CCDC146,FUT10,DLGAP1, etc. | 4.20e-01 |  |
| GTF2IRD1 | MYOFIB | Oral cavity | OSCC | CCDC146,FUT10,DLGAP1, etc. | 1.00e-01 |  |
| GTF2IRD1 | INCAF | Oral cavity | OSCC | CCDC146,FUT10,DLGAP1, etc. | 4.76e-01 | |
| GTF2IRD1 | M2MAC | Pancreas | PDAC | UBXN2A,IGFBP2,CHMP4A, etc. | 3.03e-01 |  |
| ∗The dot plots of a searched regulon are shown for all cell subpopulations in each disease state of each tissue based on the regulon specific score inferred using pySCENIC and by calculating the average expression. |
| Page: 1 |
Top |
Somatic mutation of malignant transformation related genes |
| Annotation of somatic variants for genes involved in malignant transformation |
| Hugo Symbol | Variant Class | Variant Classification | dbSNP RS | HGVSc | HGVSp | HGVSp Short | SWISSPROT | BIOTYPE | SIFT | PolyPhen | Tumor Sample Barcode | Tissue | Histology | Sex | Age | Stage | Therapy Types | Drugs | Outcome |
| GTF2IRD1 | insertion | Nonsense_Mutation | novel | c.1241_1242insCCACACCTAGCTTTTTGTATTTTAC | p.Asp415HisfsTer3 | p.D415Hfs*3 | Q9UHL9 | protein_coding | TCGA-A2-A0D1-01 | Breast | breast invasive carcinoma | Female | >=65 | I/II | Chemotherapy | taxotere | SD | ||
| GTF2IRD1 | insertion | Nonsense_Mutation | novel | c.2914_2915insCTCATGCCTGTAATCCCAGCTACTTGGAAGGCTGAGATAGGA | p.Gly972delinsAlaHisAlaCysAsnProSerTyrLeuGluGlyTerAspArgArg | p.G972delinsAHACNPSYLEG*DRR | Q9UHL9 | protein_coding | TCGA-A8-A08H-01 | Breast | breast invasive carcinoma | Female | >=65 | I/II | Unknown | Unknown | SD | ||
| GTF2IRD1 | insertion | In_Frame_Ins | novel | c.766_767insAAAGCTGTCCATGTGTCCTCTCCTTTACTCAGG | p.Pro256delinsGlnSerCysProCysValLeuSerPheThrGlnAla | p.P256delinsQSCPCVLSFTQA | Q9UHL9 | protein_coding | TCGA-A8-A095-01 | Breast | breast invasive carcinoma | Female | <65 | I/II | Chemotherapy | 5-fluorouracil | CR | ||
| GTF2IRD1 | insertion | Frame_Shift_Ins | novel | c.1904_1905insTCCCATCCCAGCTGTTCTCTGGGCAGGGACAAGGGAGAGA | p.Val636ProfsTer18 | p.V636Pfs*18 | Q9UHL9 | protein_coding | TCGA-A8-A0A4-01 | Breast | breast invasive carcinoma | Female | >=65 | I/II | Hormone Therapy | tamoxiphen | CR | ||
| GTF2IRD1 | insertion | In_Frame_Ins | novel | c.1388_1389insATTAATTAGATTAAAGTACAACAA | p.Ile463_Phe464insLeuIleArgLeuLysTyrAsnAsn | p.I463_F464insLIRLKYNN | Q9UHL9 | protein_coding | TCGA-AN-A0FT-01 | Breast | breast invasive carcinoma | Female | <65 | I/II | Unknown | Unknown | SD | ||
| GTF2IRD1 | SNV | Missense_Mutation | rs781925026 | c.2546G>A | p.Arg849Gln | p.R849Q | Q9UHL9 | protein_coding | tolerated(0.07) | benign(0.255) | TCGA-C5-A7X5-01 | Cervix | cervical & endocervical cancer | Female | >=65 | I/II | Chemotherapy | carboplatin | PD |
| GTF2IRD1 | SNV | Missense_Mutation | c.2029N>A | p.Glu677Lys | p.E677K | Q9UHL9 | protein_coding | deleterious(0.01) | benign(0.023) | TCGA-MA-AA3Y-01 | Cervix | cervical & endocervical cancer | Female | <65 | I/II | Unknown | Unknown | SD | |
| GTF2IRD1 | SNV | Missense_Mutation | c.2637G>T | p.Lys879Asn | p.K879N | Q9UHL9 | protein_coding | deleterious(0.02) | possibly_damaging(0.725) | TCGA-Q1-A73O-01 | Cervix | cervical & endocervical cancer | Female | <65 | I/II | Chemotherapy | cisplatin | CR | |
| GTF2IRD1 | SNV | Missense_Mutation | novel | c.277N>G | p.Gln93Glu | p.Q93E | Q9UHL9 | protein_coding | tolerated(1) | benign(0.001) | TCGA-VS-A8QM-01 | Cervix | cervical & endocervical cancer | Female | <65 | I/II | Chemotherapy | cisplatin | PD |
| GTF2IRD1 | SNV | Missense_Mutation | novel | c.2837N>T | p.Ala946Val | p.A946V | Q9UHL9 | protein_coding | tolerated(0.21) | benign(0.02) | TCGA-VS-A9U6-01 | Cervix | cervical & endocervical cancer | Female | <65 | I/II | Chemotherapy | cisplatin | PD |
| Page: 1 2 3 4 5 6 7 8 9 10 |
Top |
Related drugs of malignant transformation related genes |
| Identification of chemicals and drugs interact with genes involved in malignant transfromation |
| (DGIdb 4.0) |
| Entrez ID | Symbol | Category | Interaction Types | Drug Claim Name | Drug Name | PMIDs |
| Page: 1 |

Copyright 2023-Present -The University of Texas Health Science Center at Houston |