
|
|||||
|
 | |
| |
| |
| |
| |
| |
|
Gene: GTF2H3 |
Gene summary for GTF2H3 |
| Gene information | Species | Human | Gene symbol | GTF2H3 | Gene ID | 2967 |
| Gene name | general transcription factor IIH subunit 3 | |
| Gene Alias | BTF2 | |
| Cytomap | 12q24.31 | |
| Gene Type | protein-coding | GO ID | GO:0006139 | UniProtAcc | Q13889 |
Top |
Malignant transformation analysis |
| Identification of the aberrant gene expression in precancerous and cancerous lesions by comparing the gene expression of stem-like cells in diseased tissues with normal stem cells |
| Entrez ID | Symbol | Replicates | Species | Organ | Tissue | Adj P-value | Log2FC | Malignancy |
| 2967 | GTF2H3 | LZE4T | Human | Esophagus | ESCC | 7.81e-04 | 1.39e-01 | 0.0811 |
| 2967 | GTF2H3 | LZE7T | Human | Esophagus | ESCC | 2.00e-03 | 2.38e-01 | 0.0667 |
| 2967 | GTF2H3 | LZE20T | Human | Esophagus | ESCC | 6.56e-03 | 1.34e-01 | 0.0662 |
| 2967 | GTF2H3 | LZE24T | Human | Esophagus | ESCC | 1.17e-09 | 3.10e-01 | 0.0596 |
| 2967 | GTF2H3 | P1T-E | Human | Esophagus | ESCC | 4.20e-09 | 4.47e-01 | 0.0875 |
| 2967 | GTF2H3 | P2T-E | Human | Esophagus | ESCC | 5.92e-58 | 9.69e-01 | 0.1177 |
| 2967 | GTF2H3 | P4T-E | Human | Esophagus | ESCC | 1.56e-33 | 7.14e-01 | 0.1323 |
| 2967 | GTF2H3 | P5T-E | Human | Esophagus | ESCC | 1.16e-30 | 6.51e-01 | 0.1327 |
| 2967 | GTF2H3 | P8T-E | Human | Esophagus | ESCC | 2.67e-21 | 4.26e-01 | 0.0889 |
| 2967 | GTF2H3 | P9T-E | Human | Esophagus | ESCC | 4.98e-10 | 2.45e-01 | 0.1131 |
| 2967 | GTF2H3 | P10T-E | Human | Esophagus | ESCC | 8.41e-21 | 4.47e-01 | 0.116 |
| 2967 | GTF2H3 | P11T-E | Human | Esophagus | ESCC | 6.86e-04 | 1.88e-01 | 0.1426 |
| 2967 | GTF2H3 | P12T-E | Human | Esophagus | ESCC | 5.13e-18 | 3.97e-01 | 0.1122 |
| 2967 | GTF2H3 | P15T-E | Human | Esophagus | ESCC | 3.80e-15 | 3.80e-01 | 0.1149 |
| 2967 | GTF2H3 | P16T-E | Human | Esophagus | ESCC | 1.52e-34 | 5.40e-01 | 0.1153 |
| 2967 | GTF2H3 | P17T-E | Human | Esophagus | ESCC | 8.02e-05 | 3.09e-01 | 0.1278 |
| 2967 | GTF2H3 | P19T-E | Human | Esophagus | ESCC | 1.15e-06 | 5.85e-01 | 0.1662 |
| 2967 | GTF2H3 | P20T-E | Human | Esophagus | ESCC | 2.78e-21 | 3.95e-01 | 0.1124 |
| 2967 | GTF2H3 | P21T-E | Human | Esophagus | ESCC | 4.34e-47 | 9.57e-01 | 0.1617 |
| 2967 | GTF2H3 | P22T-E | Human | Esophagus | ESCC | 2.16e-13 | 3.05e-01 | 0.1236 |
| Page: 1 2 3 4 5 |
| Tissue | Expression Dynamics | Abbreviation |
| Esophagus |  | ESCC: Esophageal squamous cell carcinoma |
| HGIN: High-grade intraepithelial neoplasias | ||
| LGIN: Low-grade intraepithelial neoplasias | ||
| Liver | 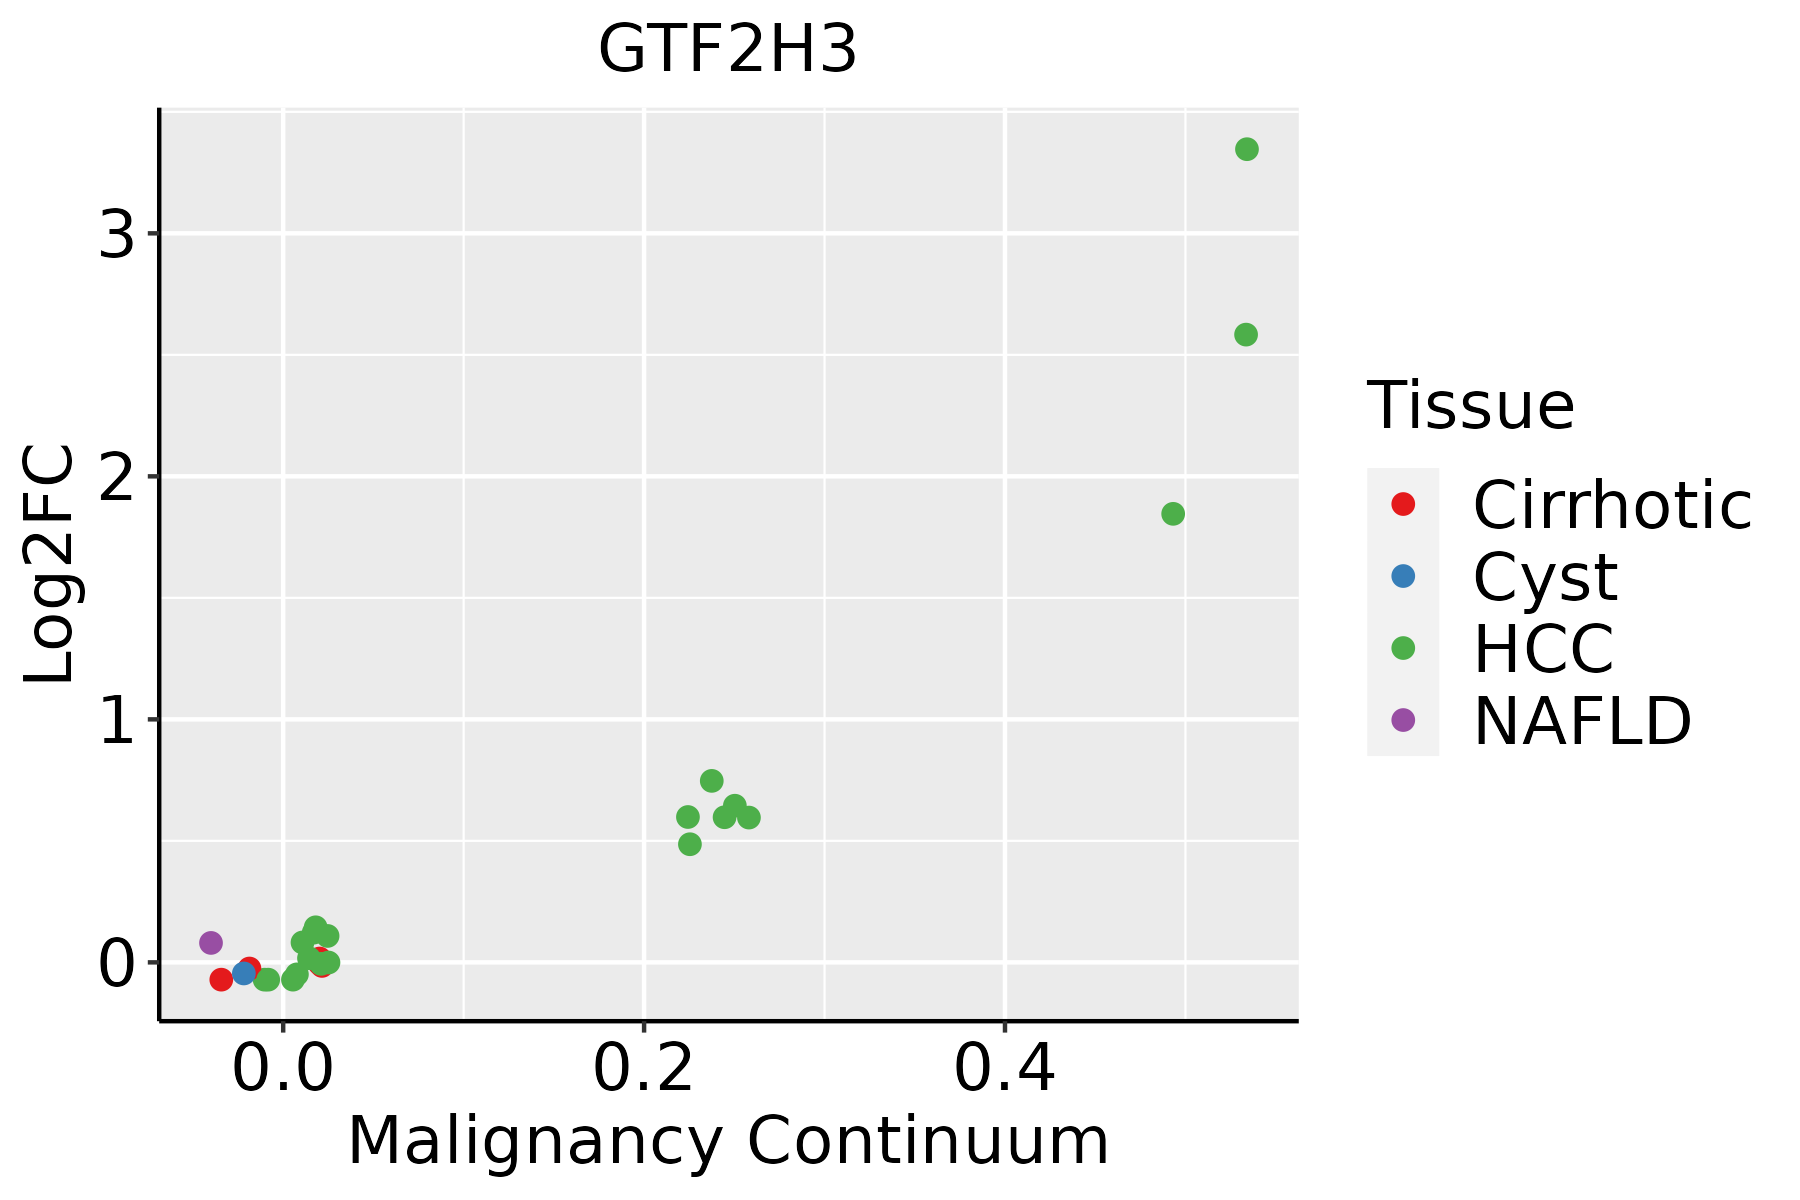 | HCC: Hepatocellular carcinoma |
| NAFLD: Non-alcoholic fatty liver disease | ||
| Oral Cavity | 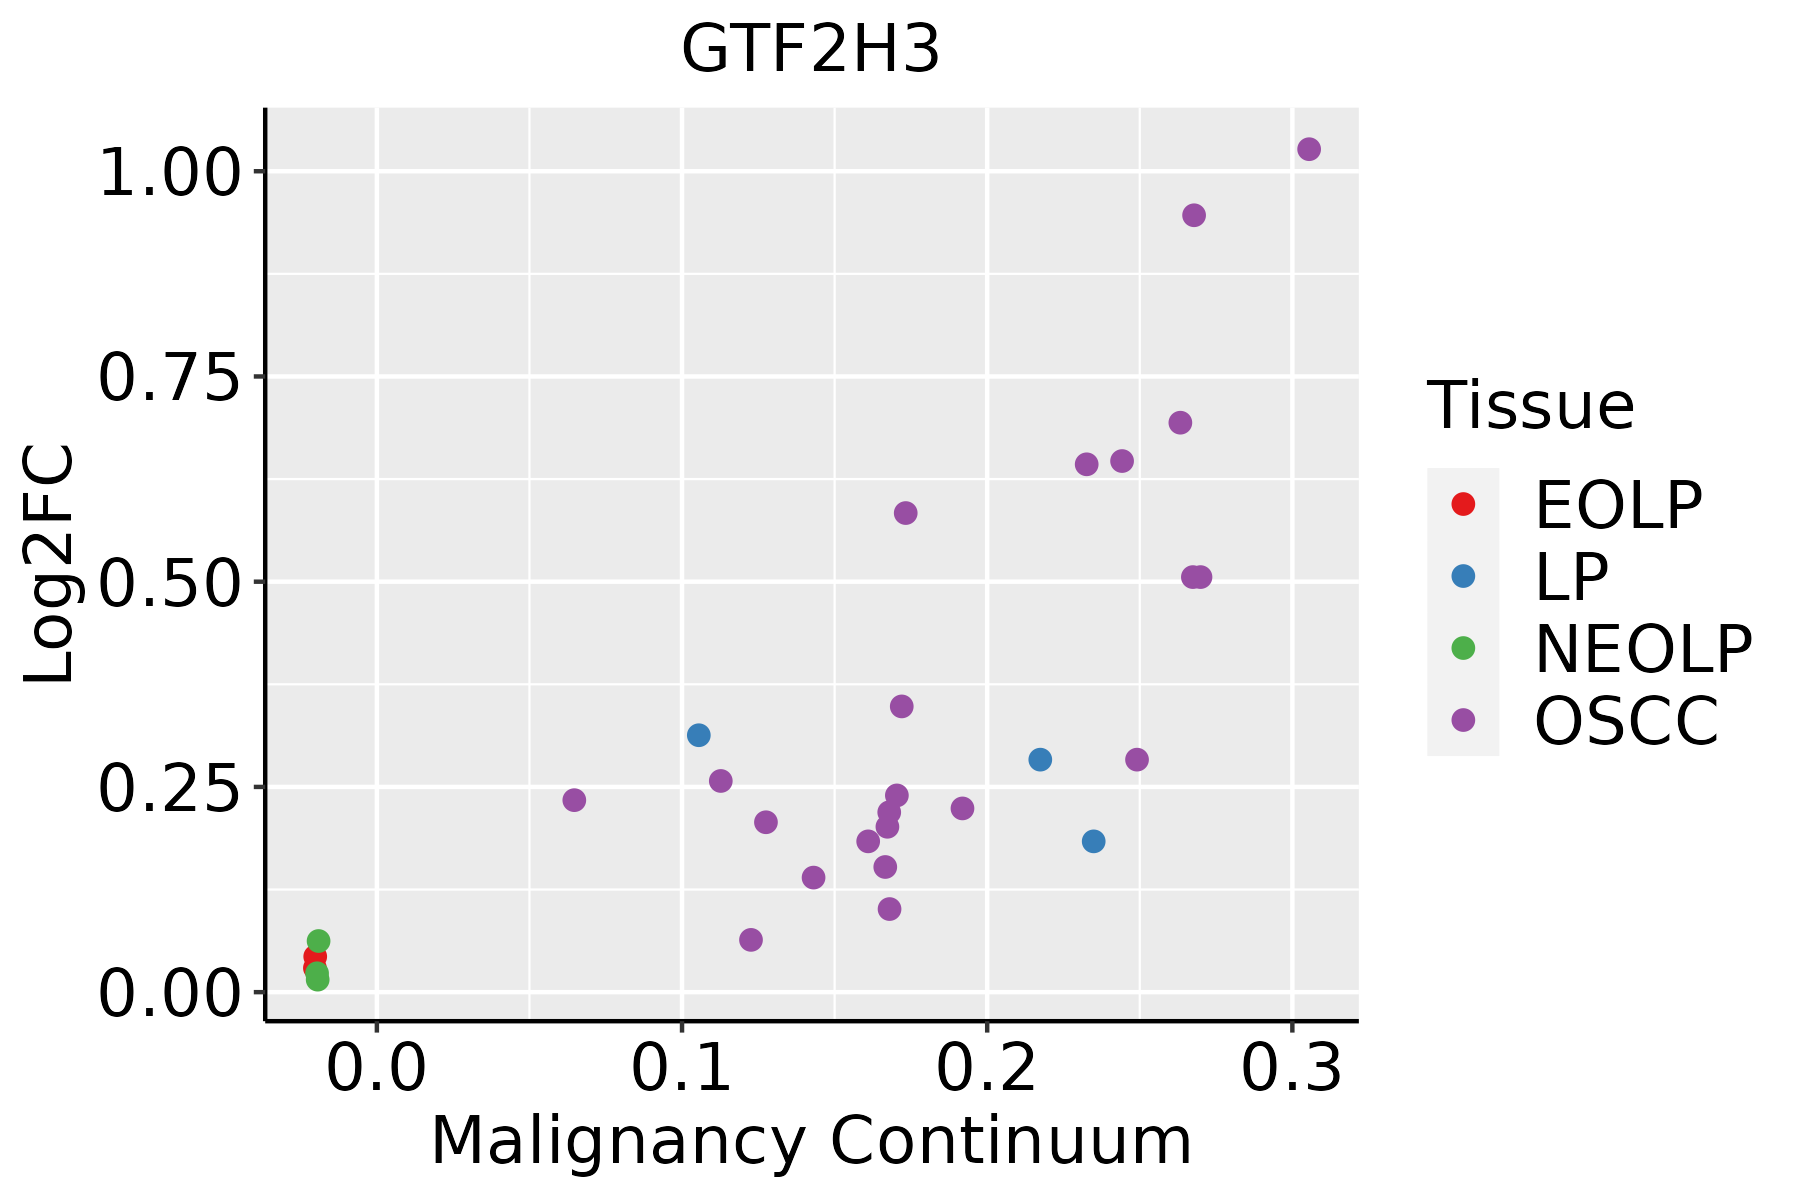 | EOLP: Erosive Oral lichen planus |
| LP: leukoplakia | ||
| NEOLP: Non-erosive oral lichen planus | ||
| OSCC: Oral squamous cell carcinoma | ||
| Skin | 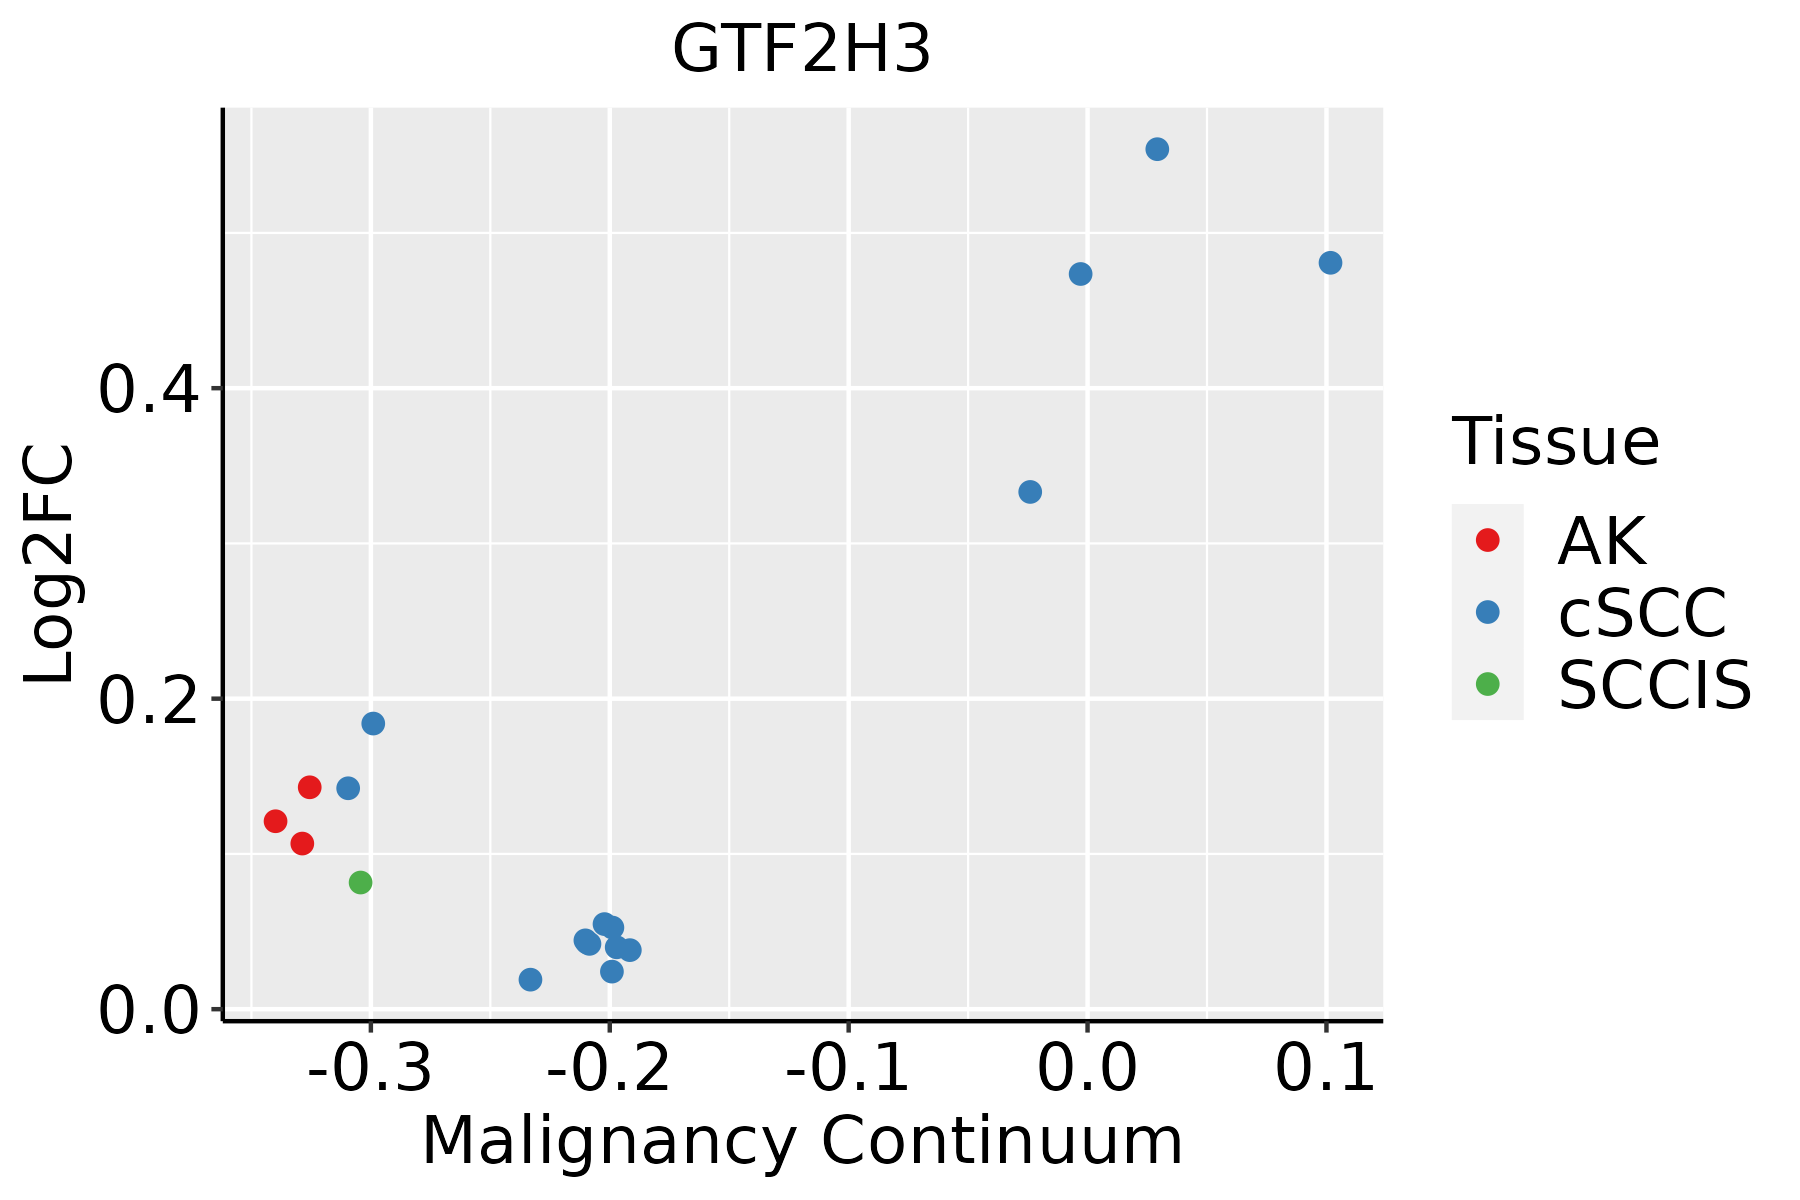 | AK: Actinic keratosis |
| cSCC: Cutaneous squamous cell carcinoma | ||
| SCCIS:squamous cell carcinoma in situ |
| ∗log2FC in expression of this searched gene in stem-like cells from each diseased tissue sample relative to stem-like cells in normal samples in each tissue plotted against the malignancy continuum. Samples are colored based on if they are from different disease stage. |
Top |
Malignant transformation related pathway analysis |
| Find out the enriched GO biological processes and KEGG pathways involved in transition from healthy to precancer to cancer |
| Tissue | Disease Stage | Enriched GO biological Processes |
| Colorectum | AD |  |
| Colorectum | SER |  |
| Colorectum | MSS |  |
| Colorectum | MSI-H |  |
| Colorectum | FAP |  |
| ∗Top 15 enriched GO BP terms are showed in the bar plot of each disease state in each tissue. Each row represents a significant GO biological process which is colored according to the -log10(p.adjust). |
| Page: 1 2 3 4 5 6 7 8 9 |
| GO ID | Tissue | Disease Stage | Description | Gene Ratio | Bg Ratio | pvalue | p.adjust | Count |
| GO:00708161 | Esophagus | ESCC | phosphorylation of RNA polymerase II C-terminal domain | 12/8552 | 12/18723 | 8.21e-05 | 6.01e-04 | 12 |
| GO:00062891 | Esophagus | ESCC | nucleotide-excision repair | 42/8552 | 60/18723 | 1.18e-04 | 8.14e-04 | 42 |
| GO:0006289 | Oral cavity | OSCC | nucleotide-excision repair | 37/7305 | 60/18723 | 3.15e-04 | 1.96e-03 | 37 |
| GO:0070816 | Oral cavity | OSCC | phosphorylation of RNA polymerase II C-terminal domain | 9/7305 | 12/18723 | 1.27e-02 | 4.24e-02 | 9 |
| GO:007081611 | Skin | cSCC | phosphorylation of RNA polymerase II C-terminal domain | 11/4864 | 12/18723 | 3.30e-06 | 5.08e-05 | 11 |
| GO:00062893 | Skin | cSCC | nucleotide-excision repair | 27/4864 | 60/18723 | 1.10e-03 | 7.24e-03 | 27 |
| Page: 1 |
| Pathway ID | Tissue | Disease Stage | Description | Gene Ratio | Bg Ratio | pvalue | p.adjust | qvalue | Count |
| hsa0342022 | Esophagus | ESCC | Nucleotide excision repair | 54/4205 | 63/8465 | 2.01e-09 | 2.17e-08 | 1.11e-08 | 54 |
| hsa0520325 | Esophagus | ESCC | Viral carcinogenesis | 137/4205 | 204/8465 | 2.47e-07 | 1.88e-06 | 9.62e-07 | 137 |
| hsa030222 | Esophagus | ESCC | Basal transcription factors | 35/4205 | 45/8465 | 1.01e-04 | 4.06e-04 | 2.08e-04 | 35 |
| hsa0342032 | Esophagus | ESCC | Nucleotide excision repair | 54/4205 | 63/8465 | 2.01e-09 | 2.17e-08 | 1.11e-08 | 54 |
| hsa0520335 | Esophagus | ESCC | Viral carcinogenesis | 137/4205 | 204/8465 | 2.47e-07 | 1.88e-06 | 9.62e-07 | 137 |
| hsa0302211 | Esophagus | ESCC | Basal transcription factors | 35/4205 | 45/8465 | 1.01e-04 | 4.06e-04 | 2.08e-04 | 35 |
| hsa052032 | Liver | HCC | Viral carcinogenesis | 117/4020 | 204/8465 | 2.68e-03 | 8.98e-03 | 5.00e-03 | 117 |
| hsa034202 | Liver | HCC | Nucleotide excision repair | 41/4020 | 63/8465 | 3.59e-03 | 1.12e-02 | 6.22e-03 | 41 |
| hsa052033 | Liver | HCC | Viral carcinogenesis | 117/4020 | 204/8465 | 2.68e-03 | 8.98e-03 | 5.00e-03 | 117 |
| hsa034203 | Liver | HCC | Nucleotide excision repair | 41/4020 | 63/8465 | 3.59e-03 | 1.12e-02 | 6.22e-03 | 41 |
| hsa034204 | Oral cavity | OSCC | Nucleotide excision repair | 49/3704 | 63/8465 | 3.48e-08 | 2.91e-07 | 1.48e-07 | 49 |
| hsa052038 | Oral cavity | OSCC | Viral carcinogenesis | 124/3704 | 204/8465 | 5.57e-07 | 3.28e-06 | 1.67e-06 | 124 |
| hsa03022 | Oral cavity | OSCC | Basal transcription factors | 28/3704 | 45/8465 | 9.53e-03 | 2.11e-02 | 1.08e-02 | 28 |
| hsa0342011 | Oral cavity | OSCC | Nucleotide excision repair | 49/3704 | 63/8465 | 3.48e-08 | 2.91e-07 | 1.48e-07 | 49 |
| hsa0520314 | Oral cavity | OSCC | Viral carcinogenesis | 124/3704 | 204/8465 | 5.57e-07 | 3.28e-06 | 1.67e-06 | 124 |
| hsa030221 | Oral cavity | OSCC | Basal transcription factors | 28/3704 | 45/8465 | 9.53e-03 | 2.11e-02 | 1.08e-02 | 28 |
| Page: 1 |
Top |
Cell-cell communication analysis |
| Identification of potential cell-cell interactions between two cell types and their ligand-receptor pairs for different disease states |
| Ligand | Receptor | LRpair | Pathway | Tissue | Disease Stage |
| Page: 1 |
Top |
Single-cell gene regulatory network inference analysis |
| Find out the significant the regulons (TFs) and the target genes of each regulon across cell types for different disease states |
| TF | Cell Type | Tissue | Disease Stage | Target Gene | RSS | Regulon Activity |
| ∗The dot plots of a searched regulon are shown for all cell subpopulations in each disease state of each tissue based on the regulon specific score inferred using pySCENIC and by calculating the average expression. |
| Page: 1 |
Top |
Somatic mutation of malignant transformation related genes |
| Annotation of somatic variants for genes involved in malignant transformation |
| Hugo Symbol | Variant Class | Variant Classification | dbSNP RS | HGVSc | HGVSp | HGVSp Short | SWISSPROT | BIOTYPE | SIFT | PolyPhen | Tumor Sample Barcode | Tissue | Histology | Sex | Age | Stage | Therapy Types | Drugs | Outcome |
| GTF2H3 | SNV | Missense_Mutation | novel | c.115G>C | p.Asp39His | p.D39H | Q13889 | protein_coding | deleterious(0) | possibly_damaging(0.897) | TCGA-5L-AAT1-01 | Breast | breast invasive carcinoma | Female | <65 | III/IV | Hormone Therapy | letrozol | SD |
| GTF2H3 | SNV | Missense_Mutation | novel | c.137N>G | p.Asn46Ser | p.N46S | Q13889 | protein_coding | deleterious(0.03) | possibly_damaging(0.61) | TCGA-A8-A08R-01 | Breast | breast invasive carcinoma | Female | <65 | I/II | Unknown | Unknown | SD |
| GTF2H3 | SNV | Missense_Mutation | c.685N>A | p.Trp229Arg | p.W229R | Q13889 | protein_coding | deleterious(0) | probably_damaging(0.959) | TCGA-BH-A0DQ-01 | Breast | breast invasive carcinoma | Female | <65 | I/II | Chemotherapy | doxorubicin | SD | |
| GTF2H3 | SNV | Missense_Mutation | c.124N>G | p.Met42Val | p.M42V | Q13889 | protein_coding | tolerated(0.58) | benign(0.001) | TCGA-D8-A1XK-01 | Breast | breast invasive carcinoma | Female | <65 | I/II | Chemotherapy | doxorubicine+cyclophosphamide | SD | |
| GTF2H3 | SNV | Missense_Mutation | novel | c.644N>C | p.Leu215Pro | p.L215P | Q13889 | protein_coding | deleterious(0) | probably_damaging(0.995) | TCGA-EA-A3HS-01 | Cervix | cervical & endocervical cancer | Female | <65 | I/II | Unknown | Unknown | SD |
| GTF2H3 | SNV | Missense_Mutation | rs146276537 | c.629C>T | p.Thr210Met | p.T210M | Q13889 | protein_coding | deleterious(0) | probably_damaging(0.993) | TCGA-AA-3710-01 | Colorectum | colon adenocarcinoma | Female | >=65 | I/II | Unknown | Unknown | SD |
| GTF2H3 | SNV | Missense_Mutation | novel | c.873N>G | p.Ile291Met | p.I291M | Q13889 | protein_coding | tolerated(0.16) | benign(0.131) | TCGA-AA-3984-01 | Colorectum | colon adenocarcinoma | Female | <65 | I/II | Unknown | Unknown | SD |
| GTF2H3 | SNV | Missense_Mutation | novel | c.24N>T | p.Leu8Phe | p.L8F | Q13889 | protein_coding | tolerated(0.48) | possibly_damaging(0.516) | TCGA-AZ-4315-01 | Colorectum | colon adenocarcinoma | Male | <65 | I/II | Unknown | Unknown | SD |
| GTF2H3 | insertion | Frame_Shift_Ins | novel | c.64_65insG | p.Gln25AlafsTer66 | p.Q25Afs*66 | Q13889 | protein_coding | TCGA-AA-3949-01 | Colorectum | colon adenocarcinoma | Female | >=65 | III/IV | Unknown | Unknown | SD | ||
| GTF2H3 | SNV | Missense_Mutation | novel | c.657G>T | p.Gln219His | p.Q219H | Q13889 | protein_coding | tolerated(0.24) | benign(0.007) | TCGA-A5-A0G2-01 | Endometrium | uterine corpus endometrioid carcinoma | Female | <65 | III/IV | Unknown | Unknown | SD |
| Page: 1 2 3 4 |
Top |
Related drugs of malignant transformation related genes |
| Identification of chemicals and drugs interact with genes involved in malignant transfromation |
| (DGIdb 4.0) |
| Entrez ID | Symbol | Category | Interaction Types | Drug Claim Name | Drug Name | PMIDs |
| Page: 1 |

Copyright 2023-Present -The University of Texas Health Science Center at Houston |