
|
|||||
|
 | |
| |
| |
| |
| |
| |
|
Gene: GTF2H2C |
Gene summary for GTF2H2C |
| Gene information | Species | Human | Gene symbol | GTF2H2C | Gene ID | 728340 |
| Gene name | GTF2H2 family member C | |
| Gene Alias | GTF2H2C_2 | |
| Cytomap | 5q13.2 | |
| Gene Type | protein-coding | GO ID | GO:0006139 | UniProtAcc | Q6P1K8 |
Top |
Malignant transformation analysis |
| Identification of the aberrant gene expression in precancerous and cancerous lesions by comparing the gene expression of stem-like cells in diseased tissues with normal stem cells |
| Entrez ID | Symbol | Replicates | Species | Organ | Tissue | Adj P-value | Log2FC | Malignancy |
| 728340 | GTF2H2C | LZE7T | Human | Esophagus | ESCC | 2.56e-05 | 2.13e-01 | 0.0667 |
| 728340 | GTF2H2C | LZE20T | Human | Esophagus | ESCC | 3.16e-03 | 1.42e-01 | 0.0662 |
| 728340 | GTF2H2C | LZE24T | Human | Esophagus | ESCC | 2.20e-04 | 1.64e-01 | 0.0596 |
| 728340 | GTF2H2C | LZE21T | Human | Esophagus | ESCC | 6.52e-03 | 2.06e-01 | 0.0655 |
| 728340 | GTF2H2C | LZE6T | Human | Esophagus | ESCC | 1.62e-02 | 1.56e-01 | 0.0845 |
| 728340 | GTF2H2C | P2T-E | Human | Esophagus | ESCC | 4.24e-18 | 3.19e-01 | 0.1177 |
| 728340 | GTF2H2C | P4T-E | Human | Esophagus | ESCC | 4.90e-05 | 1.57e-01 | 0.1323 |
| 728340 | GTF2H2C | P5T-E | Human | Esophagus | ESCC | 3.97e-04 | 1.33e-01 | 0.1327 |
| 728340 | GTF2H2C | P9T-E | Human | Esophagus | ESCC | 3.05e-03 | 1.22e-01 | 0.1131 |
| 728340 | GTF2H2C | P10T-E | Human | Esophagus | ESCC | 8.40e-04 | 1.20e-01 | 0.116 |
| 728340 | GTF2H2C | P11T-E | Human | Esophagus | ESCC | 1.13e-06 | 3.22e-01 | 0.1426 |
| 728340 | GTF2H2C | P12T-E | Human | Esophagus | ESCC | 2.93e-15 | 2.93e-01 | 0.1122 |
| 728340 | GTF2H2C | P15T-E | Human | Esophagus | ESCC | 1.35e-04 | 1.35e-01 | 0.1149 |
| 728340 | GTF2H2C | P16T-E | Human | Esophagus | ESCC | 4.44e-08 | 1.66e-01 | 0.1153 |
| 728340 | GTF2H2C | P17T-E | Human | Esophagus | ESCC | 2.68e-03 | 1.90e-01 | 0.1278 |
| 728340 | GTF2H2C | P19T-E | Human | Esophagus | ESCC | 7.48e-03 | 2.17e-01 | 0.1662 |
| 728340 | GTF2H2C | P20T-E | Human | Esophagus | ESCC | 1.73e-12 | 2.50e-01 | 0.1124 |
| 728340 | GTF2H2C | P21T-E | Human | Esophagus | ESCC | 2.05e-07 | 1.81e-01 | 0.1617 |
| 728340 | GTF2H2C | P23T-E | Human | Esophagus | ESCC | 3.88e-04 | 1.26e-01 | 0.108 |
| 728340 | GTF2H2C | P24T-E | Human | Esophagus | ESCC | 8.40e-04 | 1.02e-01 | 0.1287 |
| Page: 1 2 3 |
| Tissue | Expression Dynamics | Abbreviation |
| Esophagus | 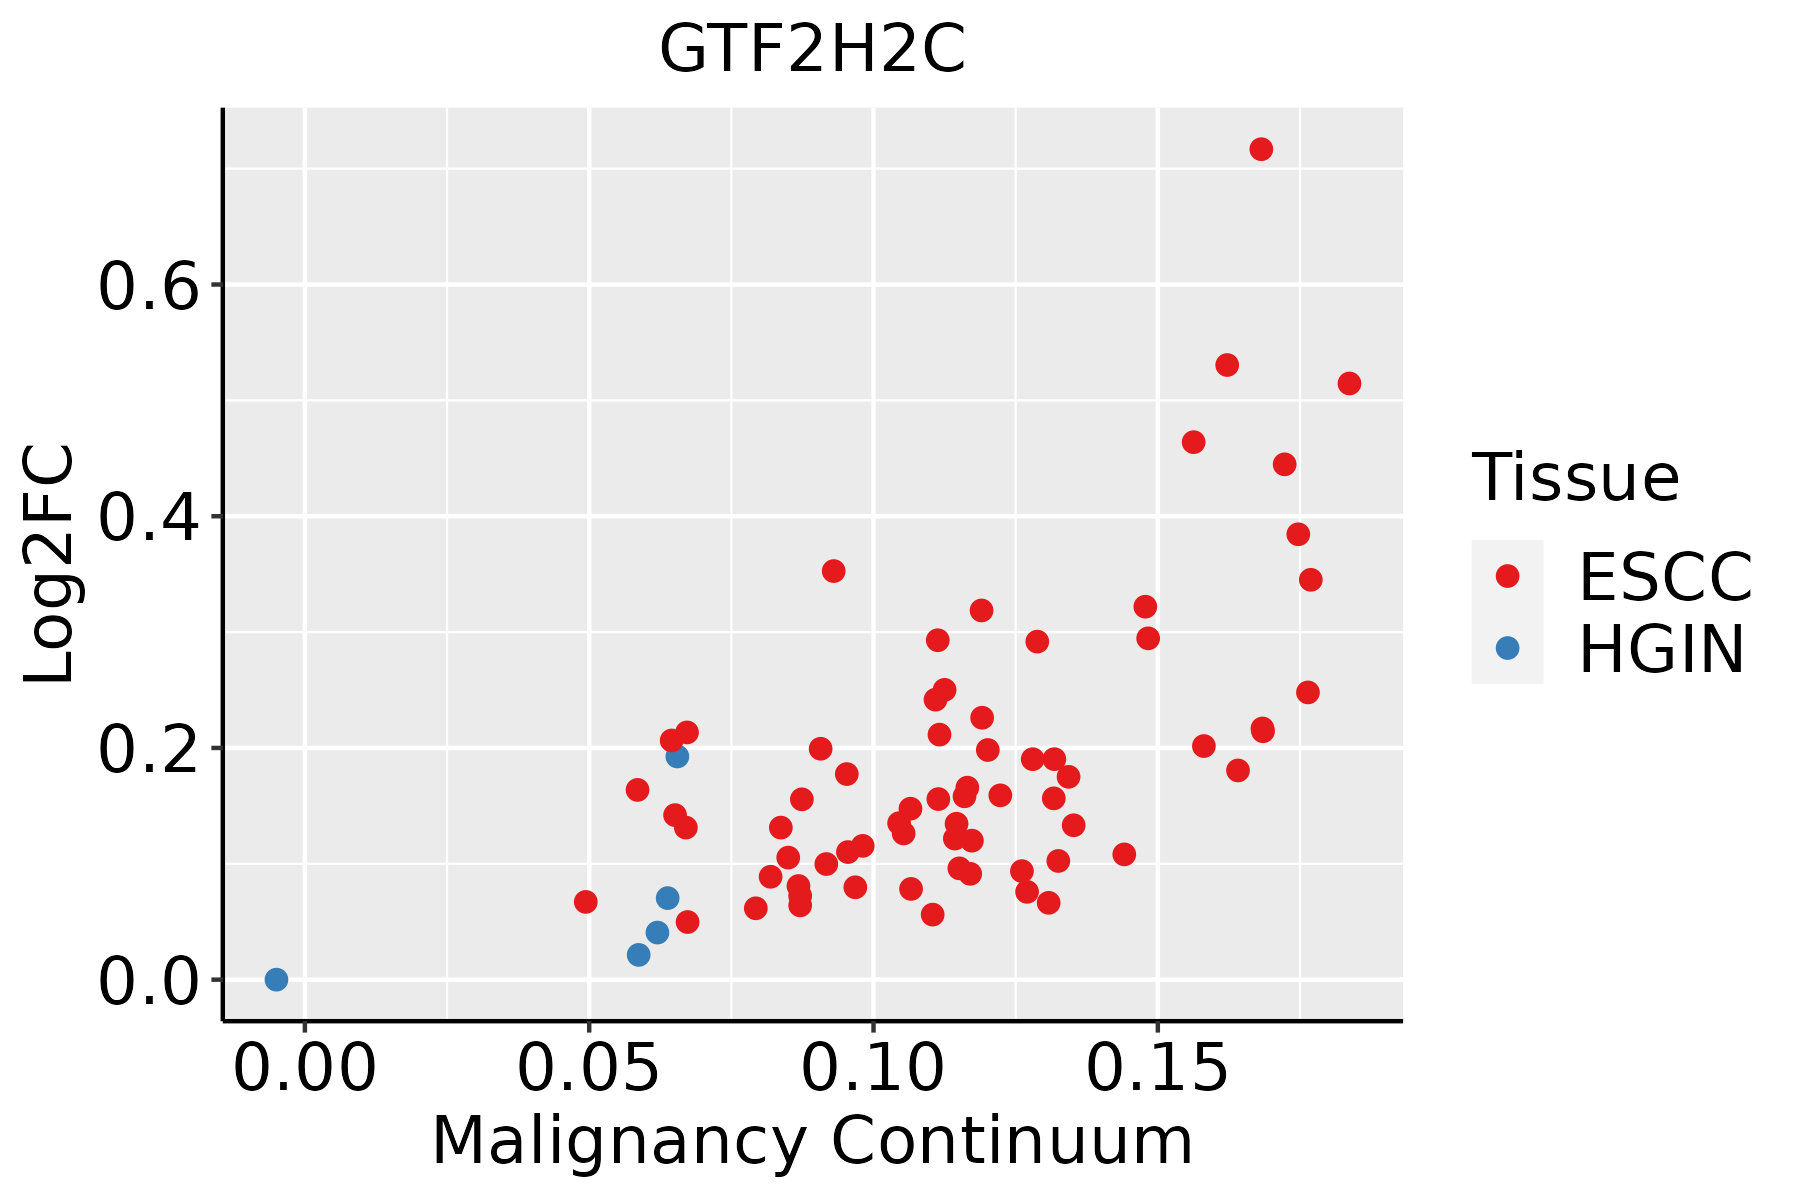 | ESCC: Esophageal squamous cell carcinoma |
| HGIN: High-grade intraepithelial neoplasias | ||
| LGIN: Low-grade intraepithelial neoplasias |
| ∗log2FC in expression of this searched gene in stem-like cells from each diseased tissue sample relative to stem-like cells in normal samples in each tissue plotted against the malignancy continuum. Samples are colored based on if they are from different disease stage. |
Top |
Malignant transformation related pathway analysis |
| Find out the enriched GO biological processes and KEGG pathways involved in transition from healthy to precancer to cancer |
| Tissue | Disease Stage | Enriched GO biological Processes |
| Colorectum | AD |  |
| Colorectum | SER |  |
| Colorectum | MSS |  |
| Colorectum | MSI-H |  |
| Colorectum | FAP |  |
| ∗Top 15 enriched GO BP terms are showed in the bar plot of each disease state in each tissue. Each row represents a significant GO biological process which is colored according to the -log10(p.adjust). |
| Page: 1 2 3 4 5 6 7 8 9 |
| GO ID | Tissue | Disease Stage | Description | Gene Ratio | Bg Ratio | pvalue | p.adjust | Count |
| GO:00062891 | Esophagus | ESCC | nucleotide-excision repair | 42/8552 | 60/18723 | 1.18e-04 | 8.14e-04 | 42 |
| Page: 1 |
| Pathway ID | Tissue | Disease Stage | Description | Gene Ratio | Bg Ratio | pvalue | p.adjust | qvalue | Count |
| hsa0342022 | Esophagus | ESCC | Nucleotide excision repair | 54/4205 | 63/8465 | 2.01e-09 | 2.17e-08 | 1.11e-08 | 54 |
| hsa0520325 | Esophagus | ESCC | Viral carcinogenesis | 137/4205 | 204/8465 | 2.47e-07 | 1.88e-06 | 9.62e-07 | 137 |
| hsa030222 | Esophagus | ESCC | Basal transcription factors | 35/4205 | 45/8465 | 1.01e-04 | 4.06e-04 | 2.08e-04 | 35 |
| hsa0342032 | Esophagus | ESCC | Nucleotide excision repair | 54/4205 | 63/8465 | 2.01e-09 | 2.17e-08 | 1.11e-08 | 54 |
| hsa0520335 | Esophagus | ESCC | Viral carcinogenesis | 137/4205 | 204/8465 | 2.47e-07 | 1.88e-06 | 9.62e-07 | 137 |
| hsa0302211 | Esophagus | ESCC | Basal transcription factors | 35/4205 | 45/8465 | 1.01e-04 | 4.06e-04 | 2.08e-04 | 35 |
| Page: 1 |
Top |
Cell-cell communication analysis |
| Identification of potential cell-cell interactions between two cell types and their ligand-receptor pairs for different disease states |
| Ligand | Receptor | LRpair | Pathway | Tissue | Disease Stage |
| Page: 1 |
Top |
Single-cell gene regulatory network inference analysis |
| Find out the significant the regulons (TFs) and the target genes of each regulon across cell types for different disease states |
| TF | Cell Type | Tissue | Disease Stage | Target Gene | RSS | Regulon Activity |
| ∗The dot plots of a searched regulon are shown for all cell subpopulations in each disease state of each tissue based on the regulon specific score inferred using pySCENIC and by calculating the average expression. |
| Page: 1 |
Top |
Somatic mutation of malignant transformation related genes |
| Annotation of somatic variants for genes involved in malignant transformation |
| Hugo Symbol | Variant Class | Variant Classification | dbSNP RS | HGVSc | HGVSp | HGVSp Short | SWISSPROT | BIOTYPE | SIFT | PolyPhen | Tumor Sample Barcode | Tissue | Histology | Sex | Age | Stage | Therapy Types | Drugs | Outcome |
| GTF2H2C | SNV | Missense_Mutation | rs748344238 | c.29G>A | p.Arg10Gln | p.R10Q | Q6P1K8 | protein_coding | tolerated(0.07) | probably_damaging(0.974) | TCGA-2W-A8YY-01 | Cervix | cervical & endocervical cancer | Female | <65 | I/II | Chemotherapy | cisplatin | CR |
| GTF2H2C | SNV | Missense_Mutation | novel | c.376A>C | p.Lys126Gln | p.K126Q | Q6P1K8 | protein_coding | tolerated(0.12) | benign(0.056) | TCGA-2W-A8YY-01 | Cervix | cervical & endocervical cancer | Female | <65 | I/II | Chemotherapy | cisplatin | CR |
| GTF2H2C | SNV | Missense_Mutation | novel | c.305N>C | p.Ser102Thr | p.S102T | Q6P1K8 | protein_coding | deleterious(0.02) | probably_damaging(0.992) | TCGA-A5-A0G2-01 | Endometrium | uterine corpus endometrioid carcinoma | Female | <65 | III/IV | Unknown | Unknown | SD |
| GTF2H2C | SNV | Missense_Mutation | rs756750605 | c.422N>A | p.Gly141Glu | p.G141E | Q6P1K8 | protein_coding | deleterious(0) | probably_damaging(0.998) | TCGA-A5-A0G2-01 | Endometrium | uterine corpus endometrioid carcinoma | Female | <65 | III/IV | Unknown | Unknown | SD |
| GTF2H2C | SNV | Missense_Mutation | novel | c.20N>T | p.Arg7Ile | p.R7I | Q6P1K8 | protein_coding | deleterious(0) | benign(0.251) | TCGA-AJ-A3EL-01 | Endometrium | uterine corpus endometrioid carcinoma | Female | <65 | I/II | Unknown | Unknown | SD |
| GTF2H2C | SNV | Missense_Mutation | c.404N>C | p.Val135Ala | p.V135A | Q6P1K8 | protein_coding | tolerated(0.6) | benign(0.012) | TCGA-AP-A054-01 | Endometrium | uterine corpus endometrioid carcinoma | Female | <65 | III/IV | Chemotherapy | carboplatin | PD | |
| GTF2H2C | SNV | Missense_Mutation | novel | c.41G>T | p.Gly14Val | p.G14V | Q6P1K8 | protein_coding | deleterious(0.05) | possibly_damaging(0.89) | TCGA-AP-A0LM-01 | Endometrium | uterine corpus endometrioid carcinoma | Female | <65 | III/IV | Chemotherapy | cisplatin | SD |
| GTF2H2C | SNV | Missense_Mutation | novel | c.122N>T | p.Ala41Val | p.A41V | Q6P1K8 | protein_coding | deleterious(0.02) | benign(0.153) | TCGA-AP-A1DV-01 | Endometrium | uterine corpus endometrioid carcinoma | Female | <65 | I/II | Unknown | Unknown | SD |
| GTF2H2C | SNV | Missense_Mutation | novel | c.320N>G | p.Ile107Ser | p.I107S | Q6P1K8 | protein_coding | deleterious(0) | probably_damaging(0.991) | TCGA-EO-A3B0-01 | Endometrium | uterine corpus endometrioid carcinoma | Female | <65 | III/IV | Unknown | Unknown | SD |
| GTF2H2C | insertion | Frame_Shift_Ins | novel | c.42_43insAG | p.Tyr15SerfsTer21 | p.Y15Sfs*21 | Q6P1K8 | protein_coding | TCGA-AP-A0LM-01 | Endometrium | uterine corpus endometrioid carcinoma | Female | <65 | III/IV | Chemotherapy | cisplatin | SD |
| Page: 1 2 |
Top |
Related drugs of malignant transformation related genes |
| Identification of chemicals and drugs interact with genes involved in malignant transfromation |
| (DGIdb 4.0) |
| Entrez ID | Symbol | Category | Interaction Types | Drug Claim Name | Drug Name | PMIDs |
| Page: 1 |

Copyright 2023-Present -The University of Texas Health Science Center at Houston |