
|
|||||
|
 | |
| |
| |
| |
| |
| |
|
Gene: GTF2H2 |
Gene summary for GTF2H2 |
| Gene information | Species | Human | Gene symbol | GTF2H2 | Gene ID | 2966 |
| Gene name | general transcription factor IIH subunit 2 | |
| Gene Alias | BTF2 | |
| Cytomap | 5q13.2 | |
| Gene Type | protein-coding | GO ID | GO:0002029 | UniProtAcc | Q13888 |
Top |
Malignant transformation analysis |
| Identification of the aberrant gene expression in precancerous and cancerous lesions by comparing the gene expression of stem-like cells in diseased tissues with normal stem cells |
| Entrez ID | Symbol | Replicates | Species | Organ | Tissue | Adj P-value | Log2FC | Malignancy |
| 2966 | GTF2H2 | GSM4909307 | Human | Breast | IDC | 1.86e-02 | 2.92e-01 | 0.1569 |
| 2966 | GTF2H2 | GSM4909308 | Human | Breast | IDC | 2.66e-18 | 5.11e-01 | 0.158 |
| 2966 | GTF2H2 | GSM4909311 | Human | Breast | IDC | 1.27e-03 | -1.07e-01 | 0.1534 |
| 2966 | GTF2H2 | GSM4909319 | Human | Breast | IDC | 2.89e-06 | -8.37e-02 | 0.1563 |
| 2966 | GTF2H2 | M5 | Human | Breast | IDC | 7.93e-05 | 6.96e-01 | 0.1598 |
| 2966 | GTF2H2 | DCIS2 | Human | Breast | DCIS | 2.84e-14 | 2.15e-02 | 0.0085 |
| 2966 | GTF2H2 | HTA11_78_2000001011 | Human | Colorectum | AD | 5.62e-10 | 6.25e-01 | -0.1088 |
| 2966 | GTF2H2 | HTA11_347_2000001011 | Human | Colorectum | AD | 7.07e-09 | 4.68e-01 | -0.1954 |
| 2966 | GTF2H2 | HTA11_866_2000001011 | Human | Colorectum | AD | 2.93e-03 | 2.87e-01 | -0.1001 |
| 2966 | GTF2H2 | A015-C-203 | Human | Colorectum | FAP | 3.89e-10 | -2.33e-01 | -0.1294 |
| 2966 | GTF2H2 | A015-C-204 | Human | Colorectum | FAP | 1.72e-03 | -2.15e-01 | -0.0228 |
| 2966 | GTF2H2 | A002-C-201 | Human | Colorectum | FAP | 1.06e-05 | -2.24e-01 | 0.0324 |
| 2966 | GTF2H2 | A002-C-203 | Human | Colorectum | FAP | 9.87e-03 | -1.45e-01 | 0.2786 |
| 2966 | GTF2H2 | A001-C-119 | Human | Colorectum | FAP | 1.88e-02 | -2.00e-01 | -0.1557 |
| 2966 | GTF2H2 | A001-C-108 | Human | Colorectum | FAP | 1.30e-08 | -2.37e-01 | -0.0272 |
| 2966 | GTF2H2 | A002-C-205 | Human | Colorectum | FAP | 2.10e-07 | -2.42e-01 | -0.1236 |
| 2966 | GTF2H2 | A001-C-104 | Human | Colorectum | FAP | 6.90e-04 | -2.06e-01 | 0.0184 |
| 2966 | GTF2H2 | A015-C-005 | Human | Colorectum | FAP | 2.22e-02 | -2.09e-01 | -0.0336 |
| 2966 | GTF2H2 | A015-C-006 | Human | Colorectum | FAP | 1.88e-04 | -2.49e-01 | -0.0994 |
| 2966 | GTF2H2 | A015-C-106 | Human | Colorectum | FAP | 1.38e-07 | -2.38e-01 | -0.0511 |
| Page: 1 2 3 4 5 |
| Tissue | Expression Dynamics | Abbreviation |
| Breast | 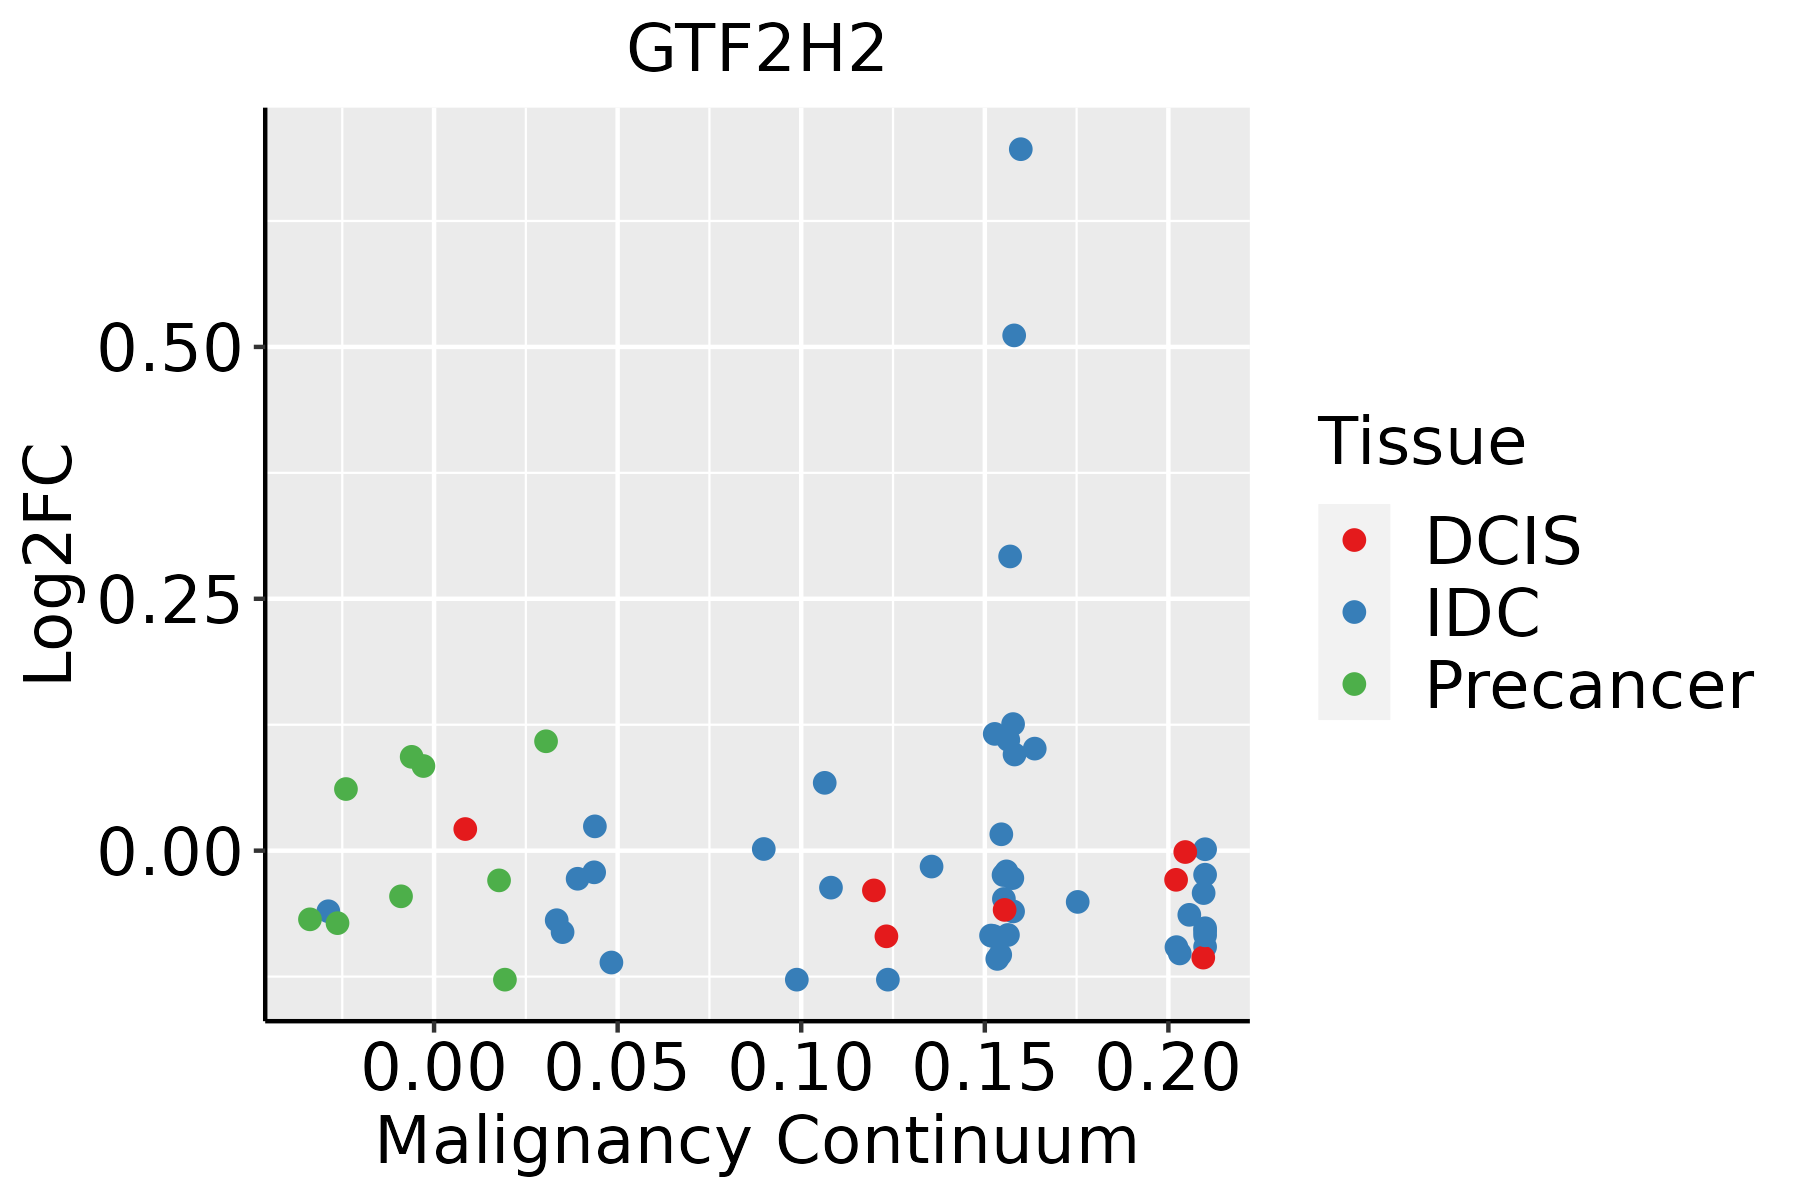 | IDC: Invasive ductal carcinoma |
| DCIS: Ductal carcinoma in situ | ||
| Precancer(BRCA1-mut): Precancerous lesion from BRCA1 mutation carriers | ||
| Colorectum (GSE201348) |  | FAP: Familial adenomatous polyposis |
| CRC: Colorectal cancer | ||
| Colorectum (HTA11) |  | AD: Adenomas |
| SER: Sessile serrated lesions | ||
| MSI-H: Microsatellite-high colorectal cancer | ||
| MSS: Microsatellite stable colorectal cancer | ||
| Esophagus | 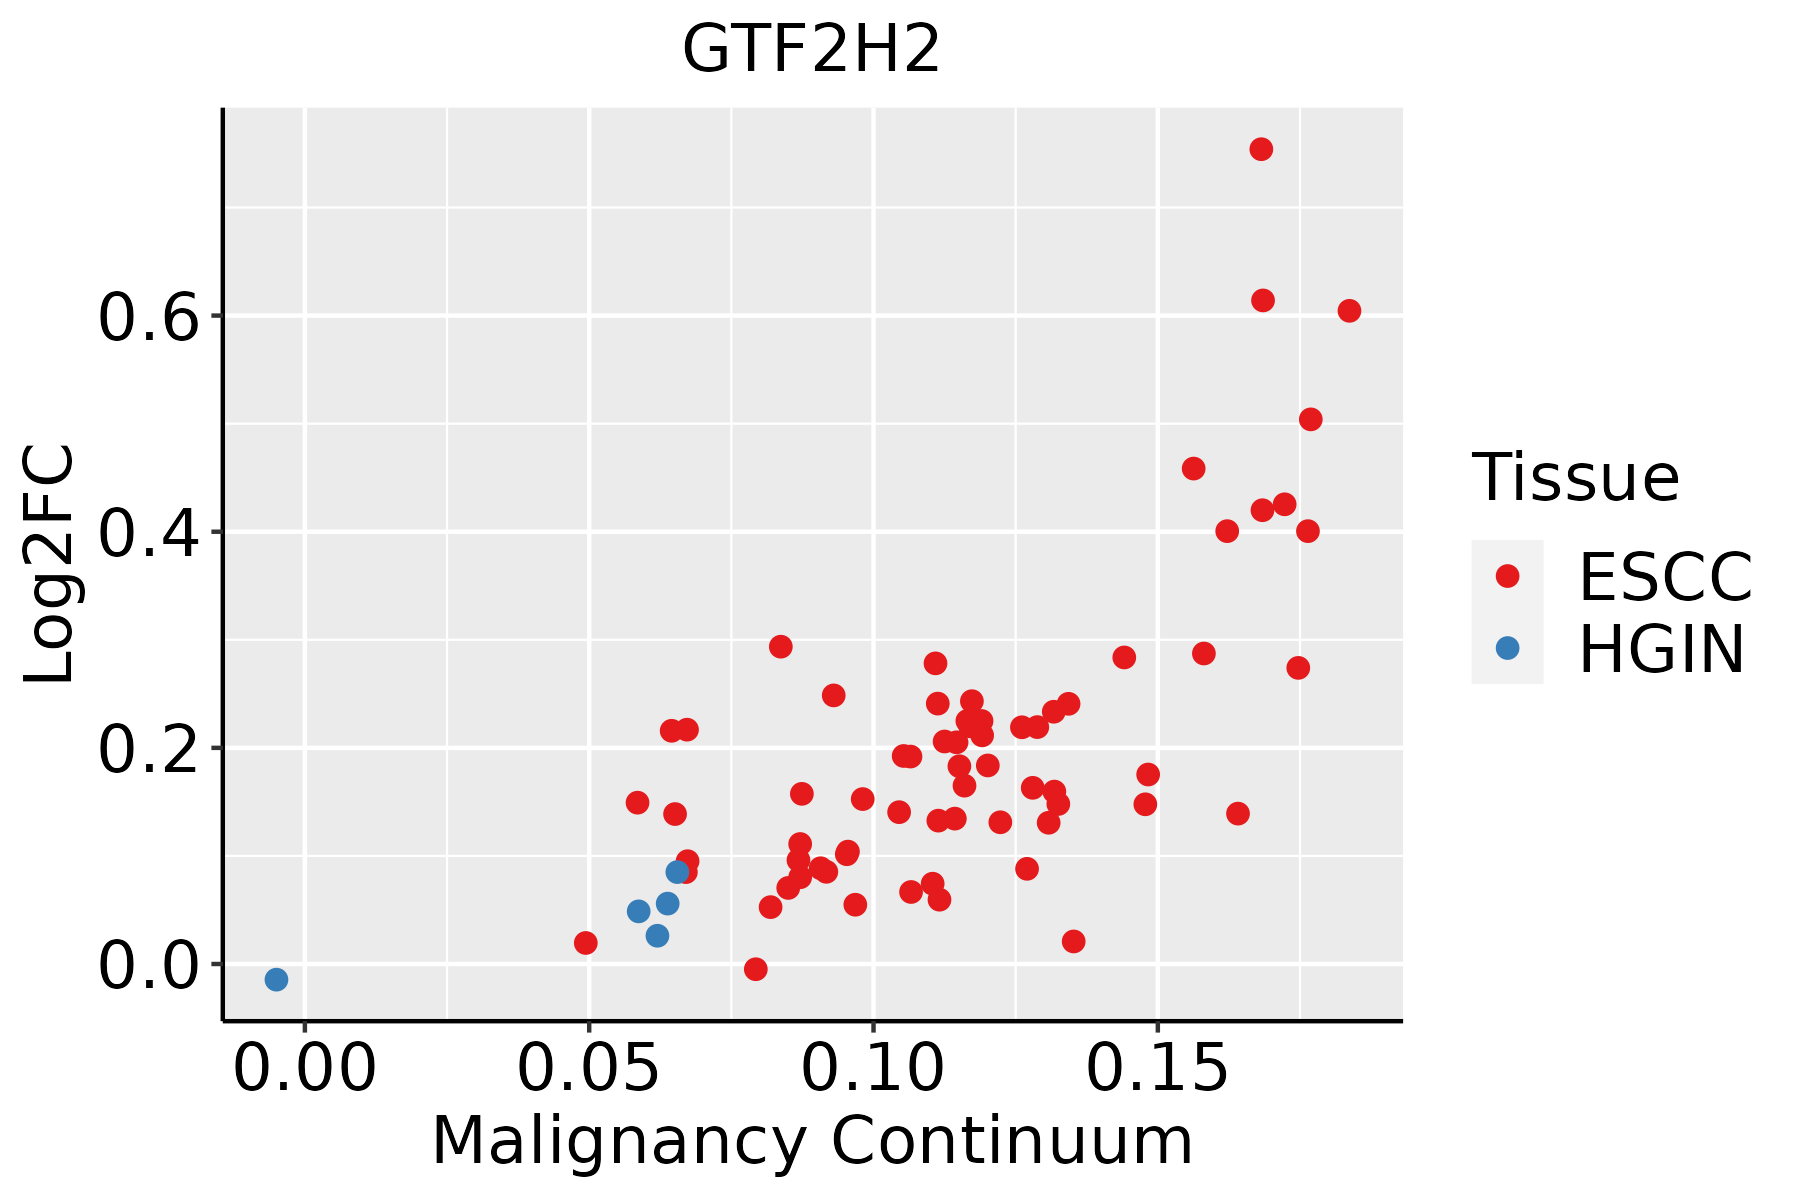 | ESCC: Esophageal squamous cell carcinoma |
| HGIN: High-grade intraepithelial neoplasias | ||
| LGIN: Low-grade intraepithelial neoplasias | ||
| Thyroid |  | ATC: Anaplastic thyroid cancer |
| HT: Hashimoto's thyroiditis | ||
| PTC: Papillary thyroid cancer |
| ∗log2FC in expression of this searched gene in stem-like cells from each diseased tissue sample relative to stem-like cells in normal samples in each tissue plotted against the malignancy continuum. Samples are colored based on if they are from different disease stage. |
Top |
Malignant transformation related pathway analysis |
| Find out the enriched GO biological processes and KEGG pathways involved in transition from healthy to precancer to cancer |
| Tissue | Disease Stage | Enriched GO biological Processes |
| Colorectum | AD |  |
| Colorectum | SER |  |
| Colorectum | MSS |  |
| Colorectum | MSI-H |  |
| Colorectum | FAP |  |
| ∗Top 15 enriched GO BP terms are showed in the bar plot of each disease state in each tissue. Each row represents a significant GO biological process which is colored according to the -log10(p.adjust). |
| Page: 1 2 3 4 5 6 7 8 9 |
| GO ID | Tissue | Disease Stage | Description | Gene Ratio | Bg Ratio | pvalue | p.adjust | Count |
| GO:000931412 | Breast | IDC | response to radiation | 62/1434 | 456/18723 | 6.91e-06 | 2.10e-04 | 62 |
| GO:000689813 | Breast | IDC | receptor-mediated endocytosis | 35/1434 | 244/18723 | 2.38e-04 | 3.75e-03 | 35 |
| GO:003162311 | Breast | IDC | receptor internalization | 19/1434 | 113/18723 | 9.17e-04 | 1.05e-02 | 19 |
| GO:200125212 | Breast | IDC | positive regulation of chromosome organization | 15/1434 | 82/18723 | 1.28e-03 | 1.35e-02 | 15 |
| GO:00330445 | Breast | IDC | regulation of chromosome organization | 26/1434 | 187/18723 | 2.22e-03 | 2.06e-02 | 26 |
| GO:00431126 | Breast | IDC | receptor metabolic process | 23/1434 | 166/18723 | 4.04e-03 | 3.25e-02 | 23 |
| GO:000931422 | Breast | DCIS | response to radiation | 62/1390 | 456/18723 | 2.56e-06 | 8.87e-05 | 62 |
| GO:000689823 | Breast | DCIS | receptor-mediated endocytosis | 35/1390 | 244/18723 | 1.31e-04 | 2.25e-03 | 35 |
| GO:003162321 | Breast | DCIS | receptor internalization | 19/1390 | 113/18723 | 6.30e-04 | 7.90e-03 | 19 |
| GO:200125221 | Breast | DCIS | positive regulation of chromosome organization | 15/1390 | 82/18723 | 9.37e-04 | 1.06e-02 | 15 |
| GO:003304412 | Breast | DCIS | regulation of chromosome organization | 26/1390 | 187/18723 | 1.44e-03 | 1.47e-02 | 26 |
| GO:004311213 | Breast | DCIS | receptor metabolic process | 23/1390 | 166/18723 | 2.75e-03 | 2.41e-02 | 23 |
| GO:00094111 | Breast | DCIS | response to UV | 20/1390 | 149/18723 | 7.13e-03 | 4.85e-02 | 20 |
| GO:0043112 | Colorectum | AD | receptor metabolic process | 62/3918 | 166/18723 | 8.18e-07 | 2.85e-05 | 62 |
| GO:2001252 | Colorectum | AD | positive regulation of chromosome organization | 35/3918 | 82/18723 | 6.90e-06 | 1.72e-04 | 35 |
| GO:0006898 | Colorectum | AD | receptor-mediated endocytosis | 76/3918 | 244/18723 | 1.07e-04 | 1.59e-03 | 76 |
| GO:0033044 | Colorectum | AD | regulation of chromosome organization | 60/3918 | 187/18723 | 2.25e-04 | 2.94e-03 | 60 |
| GO:0032392 | Colorectum | AD | DNA geometric change | 31/3918 | 90/18723 | 2.02e-03 | 1.63e-02 | 31 |
| GO:0031623 | Colorectum | AD | receptor internalization | 35/3918 | 113/18723 | 7.72e-03 | 4.66e-02 | 35 |
| GO:00068982 | Colorectum | FAP | receptor-mediated endocytosis | 62/2622 | 244/18723 | 1.47e-06 | 6.39e-05 | 62 |
| Page: 1 2 3 4 |
| Pathway ID | Tissue | Disease Stage | Description | Gene Ratio | Bg Ratio | pvalue | p.adjust | qvalue | Count |
| hsa0520341 | Breast | DCIS | Viral carcinogenesis | 34/846 | 204/8465 | 1.88e-03 | 1.27e-02 | 9.33e-03 | 34 |
| hsa052035 | Breast | DCIS | Viral carcinogenesis | 34/846 | 204/8465 | 1.88e-03 | 1.27e-02 | 9.33e-03 | 34 |
| hsa0342022 | Esophagus | ESCC | Nucleotide excision repair | 54/4205 | 63/8465 | 2.01e-09 | 2.17e-08 | 1.11e-08 | 54 |
| hsa0520325 | Esophagus | ESCC | Viral carcinogenesis | 137/4205 | 204/8465 | 2.47e-07 | 1.88e-06 | 9.62e-07 | 137 |
| hsa030222 | Esophagus | ESCC | Basal transcription factors | 35/4205 | 45/8465 | 1.01e-04 | 4.06e-04 | 2.08e-04 | 35 |
| hsa0342032 | Esophagus | ESCC | Nucleotide excision repair | 54/4205 | 63/8465 | 2.01e-09 | 2.17e-08 | 1.11e-08 | 54 |
| hsa0520335 | Esophagus | ESCC | Viral carcinogenesis | 137/4205 | 204/8465 | 2.47e-07 | 1.88e-06 | 9.62e-07 | 137 |
| hsa0302211 | Esophagus | ESCC | Basal transcription factors | 35/4205 | 45/8465 | 1.01e-04 | 4.06e-04 | 2.08e-04 | 35 |
| Page: 1 |
Top |
Cell-cell communication analysis |
| Identification of potential cell-cell interactions between two cell types and their ligand-receptor pairs for different disease states |
| Ligand | Receptor | LRpair | Pathway | Tissue | Disease Stage |
| Page: 1 |
Top |
Single-cell gene regulatory network inference analysis |
| Find out the significant the regulons (TFs) and the target genes of each regulon across cell types for different disease states |
| TF | Cell Type | Tissue | Disease Stage | Target Gene | RSS | Regulon Activity |
| ∗The dot plots of a searched regulon are shown for all cell subpopulations in each disease state of each tissue based on the regulon specific score inferred using pySCENIC and by calculating the average expression. |
| Page: 1 |
Top |
Somatic mutation of malignant transformation related genes |
| Annotation of somatic variants for genes involved in malignant transformation |
| Hugo Symbol | Variant Class | Variant Classification | dbSNP RS | HGVSc | HGVSp | HGVSp Short | SWISSPROT | BIOTYPE | SIFT | PolyPhen | Tumor Sample Barcode | Tissue | Histology | Sex | Age | Stage | Therapy Types | Drugs | Outcome |
| GTF2H2 | SNV | Missense_Mutation | novel | c.563C>A | p.Thr188Asn | p.T188N | Q13888 | protein_coding | tolerated(0.47) | benign(0.003) | TCGA-2W-A8YY-01 | Cervix | cervical & endocervical cancer | Female | <65 | I/II | Chemotherapy | cisplatin | CR |
| GTF2H2 | SNV | Missense_Mutation | novel | c.638N>A | p.Arg213His | p.R213H | Q13888 | protein_coding | tolerated(0.07) | possibly_damaging(0.786) | TCGA-WS-AB45-01 | Colorectum | colon adenocarcinoma | Female | <65 | I/II | Unknown | Unknown | SD |
| GTF2H2 | SNV | Missense_Mutation | novel | c.820G>A | p.Ala274Thr | p.A274T | Q13888 | protein_coding | deleterious(0.03) | benign(0.079) | TCGA-AJ-A3EK-01 | Endometrium | uterine corpus endometrioid carcinoma | Female | <65 | I/II | Chemotherapy | carboplatin | CR |
| GTF2H2 | SNV | Missense_Mutation | novel | c.616N>T | p.Arg206Cys | p.R206C | Q13888 | protein_coding | tolerated(0.09) | probably_damaging(0.964) | TCGA-E6-A1LX-01 | Endometrium | uterine corpus endometrioid carcinoma | Female | <65 | I/II | Unknown | Unknown | SD |
| GTF2H2 | SNV | Missense_Mutation | novel | c.406G>A | p.Asp136Asn | p.D136N | Q13888 | protein_coding | tolerated(0.33) | benign(0.105) | TCGA-EO-A22U-01 | Endometrium | uterine corpus endometrioid carcinoma | Female | >=65 | I/II | Unknown | Unknown | SD |
| GTF2H2 | SNV | Missense_Mutation | novel | c.718C>T | p.Pro240Ser | p.P240S | Q13888 | protein_coding | deleterious(0.04) | benign(0.133) | TCGA-18-3409-01 | Lung | lung squamous cell carcinoma | Male | >=65 | I/II | Unknown | Unknown | PD |
| Page: 1 |
Top |
Related drugs of malignant transformation related genes |
| Identification of chemicals and drugs interact with genes involved in malignant transfromation |
| (DGIdb 4.0) |
| Entrez ID | Symbol | Category | Interaction Types | Drug Claim Name | Drug Name | PMIDs |
| Page: 1 |

Copyright 2023-Present -The University of Texas Health Science Center at Houston |