
|
|||||
|
 | |
| |
| |
| |
| |
| |
|
Gene: GTF2H1 |
Gene summary for GTF2H1 |
| Gene information | Species | Human | Gene symbol | GTF2H1 | Gene ID | 2965 |
| Gene name | general transcription factor IIH subunit 1 | |
| Gene Alias | BTF2 | |
| Cytomap | 11p15.1 | |
| Gene Type | protein-coding | GO ID | GO:0000079 | UniProtAcc | P32780 |
Top |
Malignant transformation analysis |
| Identification of the aberrant gene expression in precancerous and cancerous lesions by comparing the gene expression of stem-like cells in diseased tissues with normal stem cells |
| Entrez ID | Symbol | Replicates | Species | Organ | Tissue | Adj P-value | Log2FC | Malignancy |
| 2965 | GTF2H1 | LZE4T | Human | Esophagus | ESCC | 4.25e-07 | 3.72e-01 | 0.0811 |
| 2965 | GTF2H1 | LZE7T | Human | Esophagus | ESCC | 2.62e-04 | 3.18e-01 | 0.0667 |
| 2965 | GTF2H1 | LZE8T | Human | Esophagus | ESCC | 3.65e-06 | 1.48e-01 | 0.067 |
| 2965 | GTF2H1 | LZE20T | Human | Esophagus | ESCC | 1.56e-06 | 5.97e-03 | 0.0662 |
| 2965 | GTF2H1 | LZE22T | Human | Esophagus | ESCC | 2.57e-05 | 3.56e-01 | 0.068 |
| 2965 | GTF2H1 | LZE24T | Human | Esophagus | ESCC | 4.65e-11 | 3.20e-01 | 0.0596 |
| 2965 | GTF2H1 | LZE6T | Human | Esophagus | ESCC | 2.52e-03 | -2.77e-03 | 0.0845 |
| 2965 | GTF2H1 | P1T-E | Human | Esophagus | ESCC | 4.47e-06 | 6.40e-02 | 0.0875 |
| 2965 | GTF2H1 | P2T-E | Human | Esophagus | ESCC | 1.92e-23 | 4.47e-01 | 0.1177 |
| 2965 | GTF2H1 | P4T-E | Human | Esophagus | ESCC | 5.24e-18 | 1.57e-01 | 0.1323 |
| 2965 | GTF2H1 | P5T-E | Human | Esophagus | ESCC | 1.30e-15 | 6.04e-02 | 0.1327 |
| 2965 | GTF2H1 | P8T-E | Human | Esophagus | ESCC | 2.42e-22 | 3.84e-01 | 0.0889 |
| 2965 | GTF2H1 | P9T-E | Human | Esophagus | ESCC | 2.72e-11 | 2.60e-01 | 0.1131 |
| 2965 | GTF2H1 | P10T-E | Human | Esophagus | ESCC | 1.60e-22 | 3.39e-01 | 0.116 |
| 2965 | GTF2H1 | P11T-E | Human | Esophagus | ESCC | 2.22e-09 | 7.16e-01 | 0.1426 |
| 2965 | GTF2H1 | P12T-E | Human | Esophagus | ESCC | 5.26e-20 | 2.98e-01 | 0.1122 |
| 2965 | GTF2H1 | P15T-E | Human | Esophagus | ESCC | 6.57e-23 | 4.07e-01 | 0.1149 |
| 2965 | GTF2H1 | P16T-E | Human | Esophagus | ESCC | 4.64e-29 | 2.91e-01 | 0.1153 |
| 2965 | GTF2H1 | P17T-E | Human | Esophagus | ESCC | 4.13e-13 | 4.39e-01 | 0.1278 |
| 2965 | GTF2H1 | P20T-E | Human | Esophagus | ESCC | 2.07e-22 | 5.04e-01 | 0.1124 |
| Page: 1 2 3 4 5 |
| Tissue | Expression Dynamics | Abbreviation |
| Esophagus | 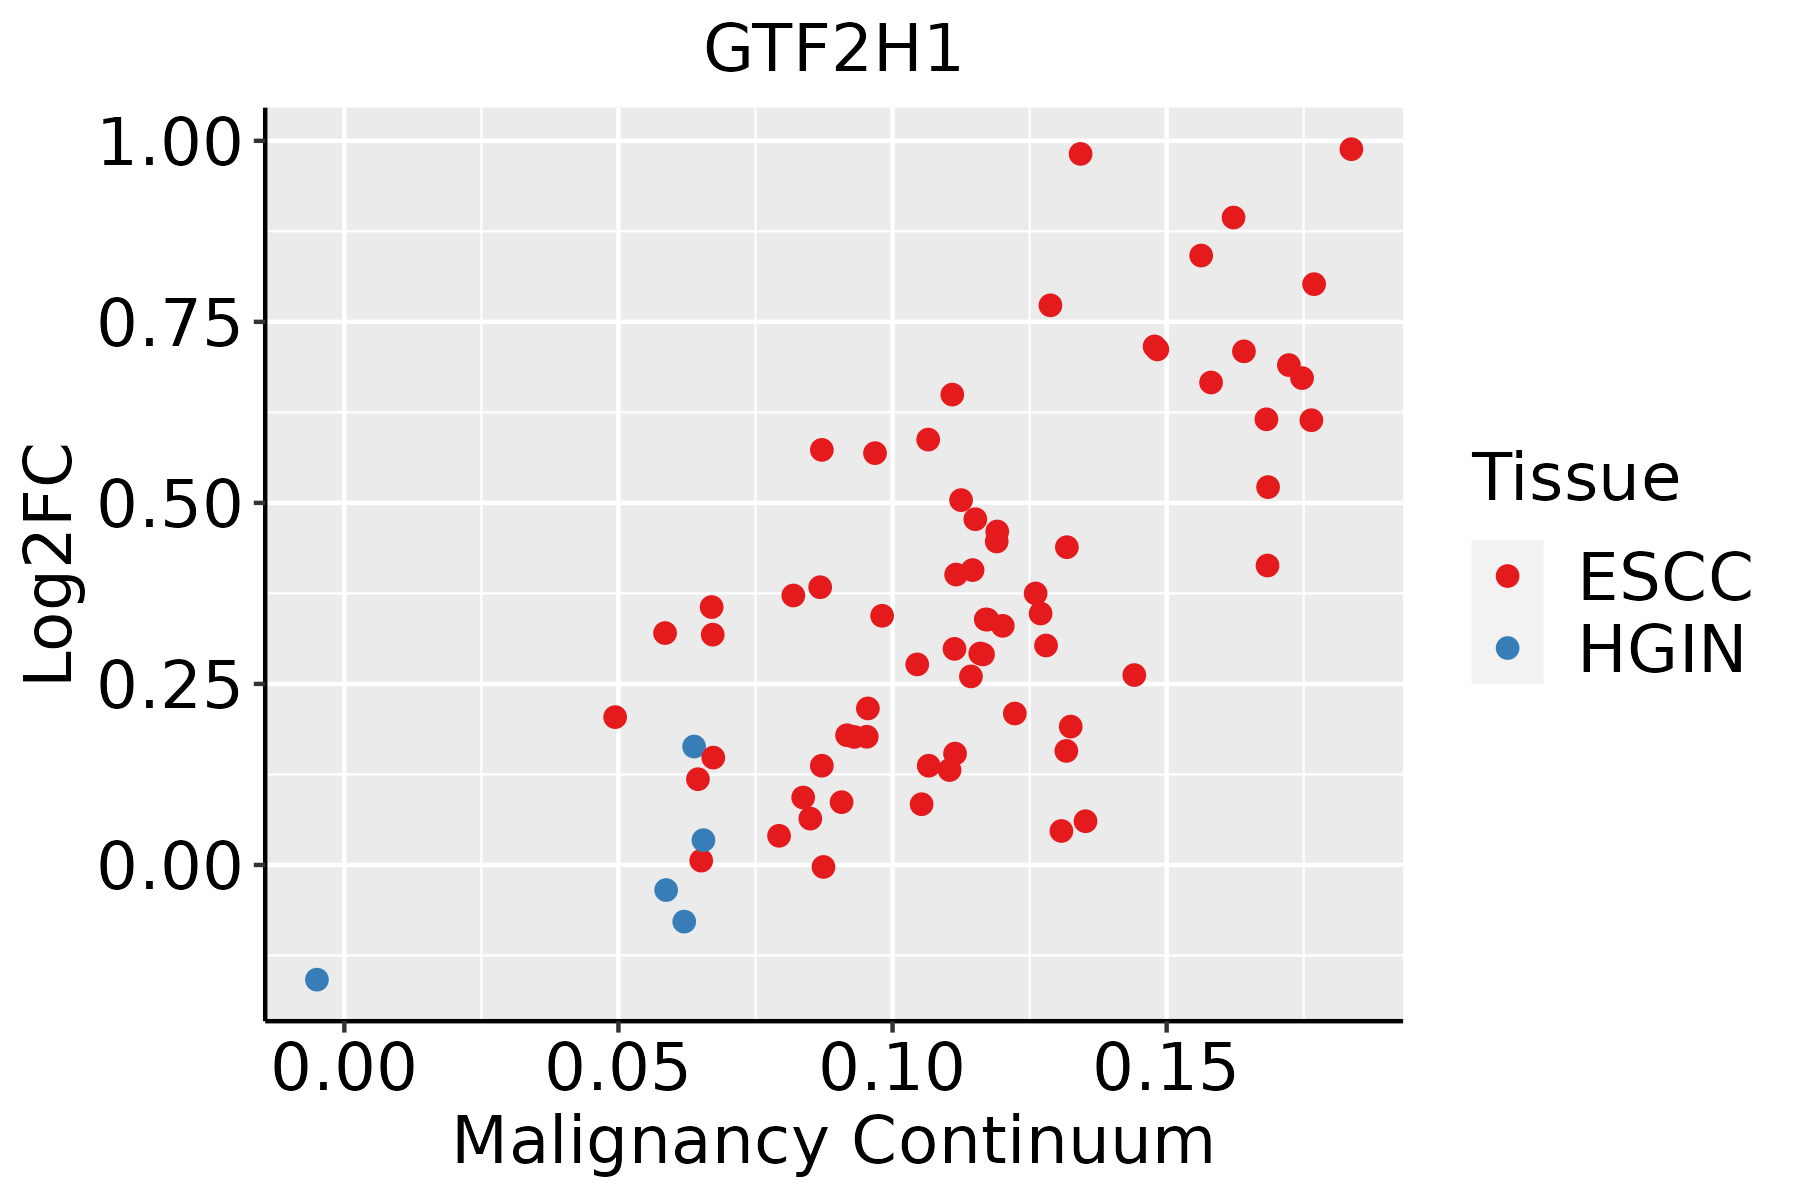 | ESCC: Esophageal squamous cell carcinoma |
| HGIN: High-grade intraepithelial neoplasias | ||
| LGIN: Low-grade intraepithelial neoplasias | ||
| Liver | 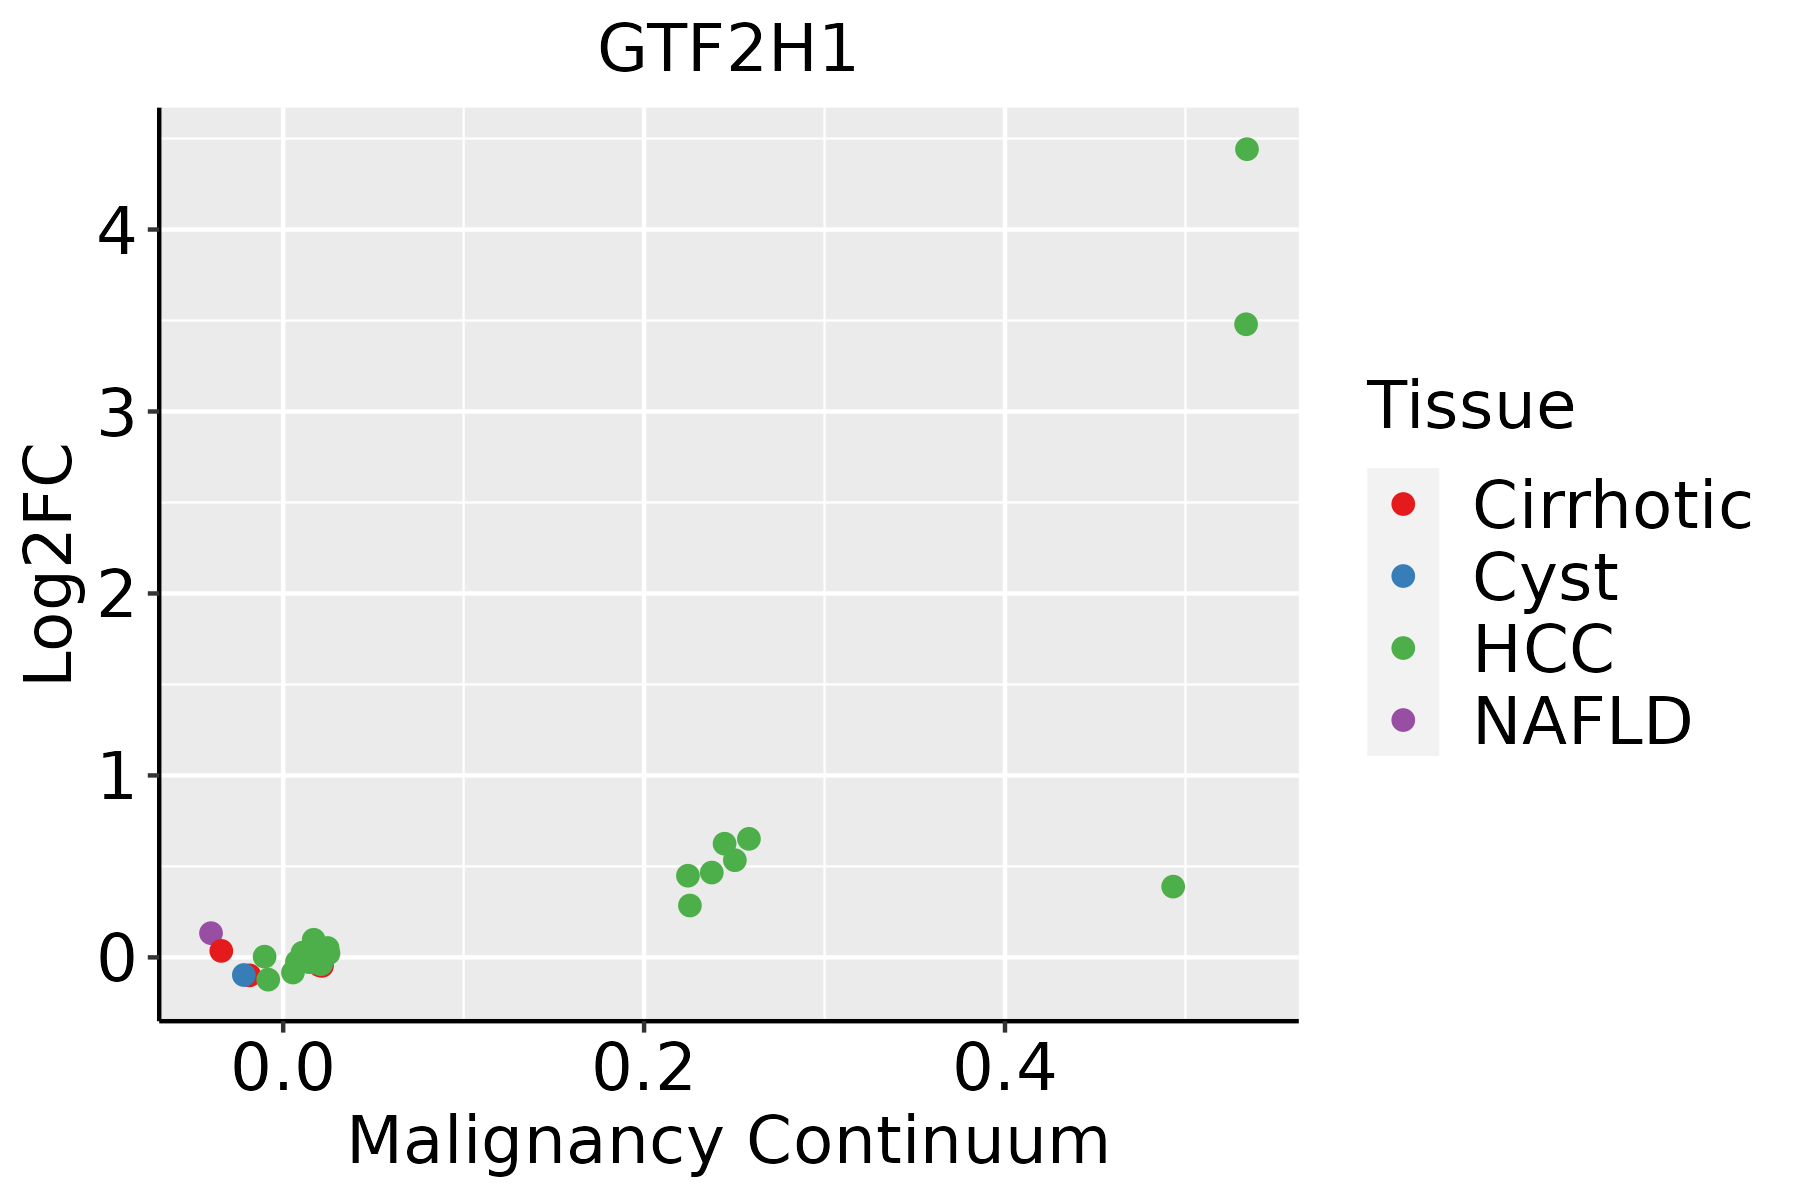 | HCC: Hepatocellular carcinoma |
| NAFLD: Non-alcoholic fatty liver disease | ||
| Oral Cavity |  | EOLP: Erosive Oral lichen planus |
| LP: leukoplakia | ||
| NEOLP: Non-erosive oral lichen planus | ||
| OSCC: Oral squamous cell carcinoma | ||
| Skin | 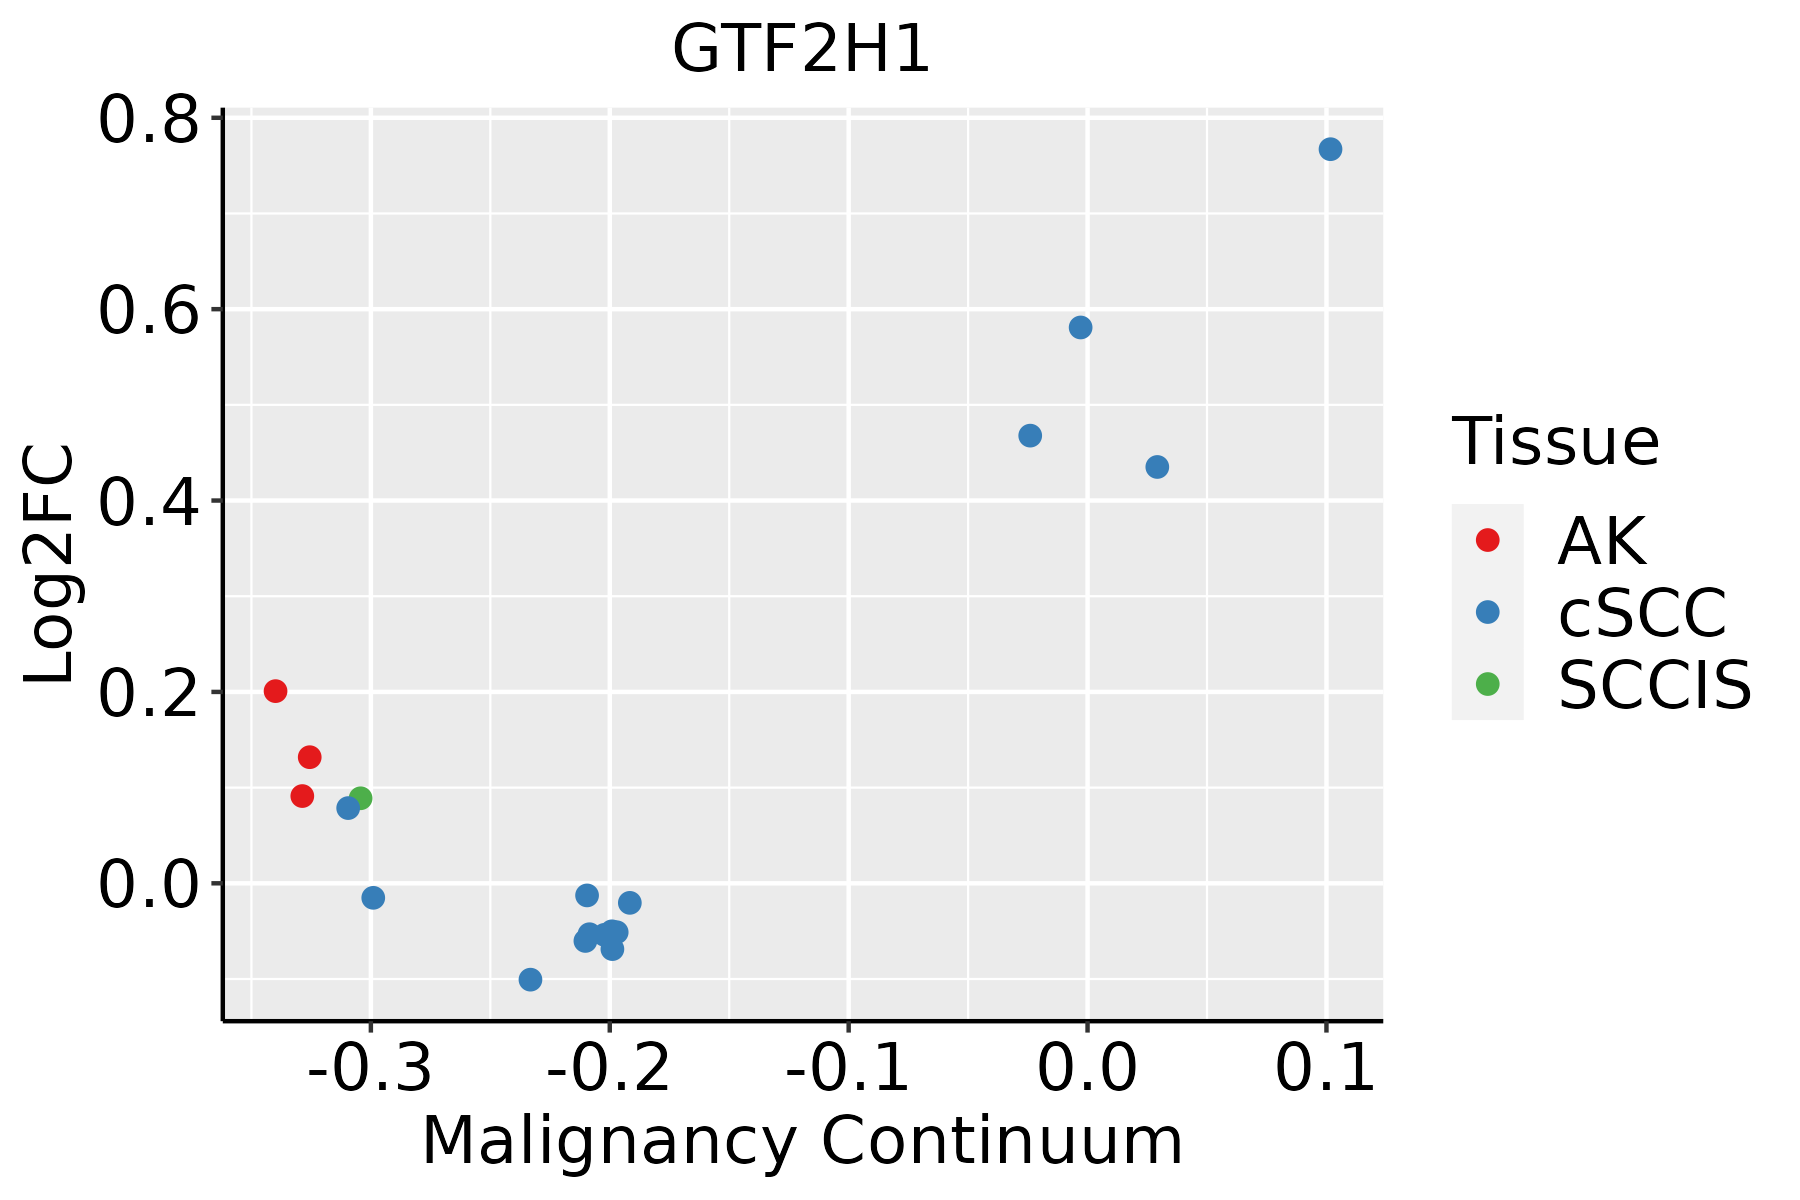 | AK: Actinic keratosis |
| cSCC: Cutaneous squamous cell carcinoma | ||
| SCCIS:squamous cell carcinoma in situ |
| ∗log2FC in expression of this searched gene in stem-like cells from each diseased tissue sample relative to stem-like cells in normal samples in each tissue plotted against the malignancy continuum. Samples are colored based on if they are from different disease stage. |
Top |
Malignant transformation related pathway analysis |
| Find out the enriched GO biological processes and KEGG pathways involved in transition from healthy to precancer to cancer |
| Tissue | Disease Stage | Enriched GO biological Processes |
| Colorectum | AD |  |
| Colorectum | SER |  |
| Colorectum | MSS |  |
| Colorectum | MSI-H |  |
| Colorectum | FAP |  |
| ∗Top 15 enriched GO BP terms are showed in the bar plot of each disease state in each tissue. Each row represents a significant GO biological process which is colored according to the -log10(p.adjust). |
| Page: 1 2 3 4 5 6 7 8 9 |
| GO ID | Tissue | Disease Stage | Description | Gene Ratio | Bg Ratio | pvalue | p.adjust | Count |
| GO:007190016 | Esophagus | ESCC | regulation of protein serine/threonine kinase activity | 227/8552 | 359/18723 | 1.12e-11 | 4.10e-10 | 227 |
| GO:19040294 | Esophagus | ESCC | regulation of cyclin-dependent protein kinase activity | 69/8552 | 98/18723 | 6.04e-07 | 7.91e-06 | 69 |
| GO:00000794 | Esophagus | ESCC | regulation of cyclin-dependent protein serine/threonine kinase activity | 66/8552 | 94/18723 | 1.24e-06 | 1.53e-05 | 66 |
| GO:00063602 | Esophagus | ESCC | transcription by RNA polymerase I | 42/8552 | 55/18723 | 3.41e-06 | 3.78e-05 | 42 |
| GO:00708161 | Esophagus | ESCC | phosphorylation of RNA polymerase II C-terminal domain | 12/8552 | 12/18723 | 8.21e-05 | 6.01e-04 | 12 |
| GO:00062891 | Esophagus | ESCC | nucleotide-excision repair | 42/8552 | 60/18723 | 1.18e-04 | 8.14e-04 | 42 |
| GO:000975516 | Esophagus | ESCC | hormone-mediated signaling pathway | 106/8552 | 190/18723 | 3.13e-03 | 1.30e-02 | 106 |
| GO:007190021 | Liver | HCC | regulation of protein serine/threonine kinase activity | 189/7958 | 359/18723 | 5.97e-05 | 5.47e-04 | 189 |
| GO:000975521 | Liver | HCC | hormone-mediated signaling pathway | 106/7958 | 190/18723 | 1.45e-04 | 1.17e-03 | 106 |
| GO:0006360 | Liver | HCC | transcription by RNA polymerase I | 36/7958 | 55/18723 | 4.94e-04 | 3.23e-03 | 36 |
| GO:0000079 | Liver | HCC | regulation of cyclin-dependent protein serine/threonine kinase activity | 55/7958 | 94/18723 | 1.25e-03 | 6.91e-03 | 55 |
| GO:1904029 | Liver | HCC | regulation of cyclin-dependent protein kinase activity | 57/7958 | 98/18723 | 1.26e-03 | 6.92e-03 | 57 |
| GO:007190010 | Oral cavity | OSCC | regulation of protein serine/threonine kinase activity | 201/7305 | 359/18723 | 3.90e-11 | 1.27e-09 | 201 |
| GO:19040293 | Oral cavity | OSCC | regulation of cyclin-dependent protein kinase activity | 60/7305 | 98/18723 | 6.90e-06 | 7.56e-05 | 60 |
| GO:00000793 | Oral cavity | OSCC | regulation of cyclin-dependent protein serine/threonine kinase activity | 58/7305 | 94/18723 | 6.92e-06 | 7.57e-05 | 58 |
| GO:00063601 | Oral cavity | OSCC | transcription by RNA polymerase I | 36/7305 | 55/18723 | 6.42e-05 | 5.22e-04 | 36 |
| GO:0006289 | Oral cavity | OSCC | nucleotide-excision repair | 37/7305 | 60/18723 | 3.15e-04 | 1.96e-03 | 37 |
| GO:0070816 | Oral cavity | OSCC | phosphorylation of RNA polymerase II C-terminal domain | 9/7305 | 12/18723 | 1.27e-02 | 4.24e-02 | 9 |
| GO:007081611 | Skin | cSCC | phosphorylation of RNA polymerase II C-terminal domain | 11/4864 | 12/18723 | 3.30e-06 | 5.08e-05 | 11 |
| GO:00063603 | Skin | cSCC | transcription by RNA polymerase I | 30/4864 | 55/18723 | 6.13e-06 | 8.70e-05 | 30 |
| Page: 1 2 |
| Pathway ID | Tissue | Disease Stage | Description | Gene Ratio | Bg Ratio | pvalue | p.adjust | qvalue | Count |
| hsa0342022 | Esophagus | ESCC | Nucleotide excision repair | 54/4205 | 63/8465 | 2.01e-09 | 2.17e-08 | 1.11e-08 | 54 |
| hsa0520325 | Esophagus | ESCC | Viral carcinogenesis | 137/4205 | 204/8465 | 2.47e-07 | 1.88e-06 | 9.62e-07 | 137 |
| hsa030222 | Esophagus | ESCC | Basal transcription factors | 35/4205 | 45/8465 | 1.01e-04 | 4.06e-04 | 2.08e-04 | 35 |
| hsa0342032 | Esophagus | ESCC | Nucleotide excision repair | 54/4205 | 63/8465 | 2.01e-09 | 2.17e-08 | 1.11e-08 | 54 |
| hsa0520335 | Esophagus | ESCC | Viral carcinogenesis | 137/4205 | 204/8465 | 2.47e-07 | 1.88e-06 | 9.62e-07 | 137 |
| hsa0302211 | Esophagus | ESCC | Basal transcription factors | 35/4205 | 45/8465 | 1.01e-04 | 4.06e-04 | 2.08e-04 | 35 |
| hsa052032 | Liver | HCC | Viral carcinogenesis | 117/4020 | 204/8465 | 2.68e-03 | 8.98e-03 | 5.00e-03 | 117 |
| hsa034202 | Liver | HCC | Nucleotide excision repair | 41/4020 | 63/8465 | 3.59e-03 | 1.12e-02 | 6.22e-03 | 41 |
| hsa052033 | Liver | HCC | Viral carcinogenesis | 117/4020 | 204/8465 | 2.68e-03 | 8.98e-03 | 5.00e-03 | 117 |
| hsa034203 | Liver | HCC | Nucleotide excision repair | 41/4020 | 63/8465 | 3.59e-03 | 1.12e-02 | 6.22e-03 | 41 |
| hsa034204 | Oral cavity | OSCC | Nucleotide excision repair | 49/3704 | 63/8465 | 3.48e-08 | 2.91e-07 | 1.48e-07 | 49 |
| hsa052038 | Oral cavity | OSCC | Viral carcinogenesis | 124/3704 | 204/8465 | 5.57e-07 | 3.28e-06 | 1.67e-06 | 124 |
| hsa03022 | Oral cavity | OSCC | Basal transcription factors | 28/3704 | 45/8465 | 9.53e-03 | 2.11e-02 | 1.08e-02 | 28 |
| hsa0342011 | Oral cavity | OSCC | Nucleotide excision repair | 49/3704 | 63/8465 | 3.48e-08 | 2.91e-07 | 1.48e-07 | 49 |
| hsa0520314 | Oral cavity | OSCC | Viral carcinogenesis | 124/3704 | 204/8465 | 5.57e-07 | 3.28e-06 | 1.67e-06 | 124 |
| hsa030221 | Oral cavity | OSCC | Basal transcription factors | 28/3704 | 45/8465 | 9.53e-03 | 2.11e-02 | 1.08e-02 | 28 |
| Page: 1 |
Top |
Cell-cell communication analysis |
| Identification of potential cell-cell interactions between two cell types and their ligand-receptor pairs for different disease states |
| Ligand | Receptor | LRpair | Pathway | Tissue | Disease Stage |
| Page: 1 |
Top |
Single-cell gene regulatory network inference analysis |
| Find out the significant the regulons (TFs) and the target genes of each regulon across cell types for different disease states |
| TF | Cell Type | Tissue | Disease Stage | Target Gene | RSS | Regulon Activity |
| ∗The dot plots of a searched regulon are shown for all cell subpopulations in each disease state of each tissue based on the regulon specific score inferred using pySCENIC and by calculating the average expression. |
| Page: 1 |
Top |
Somatic mutation of malignant transformation related genes |
| Annotation of somatic variants for genes involved in malignant transformation |
| Hugo Symbol | Variant Class | Variant Classification | dbSNP RS | HGVSc | HGVSp | HGVSp Short | SWISSPROT | BIOTYPE | SIFT | PolyPhen | Tumor Sample Barcode | Tissue | Histology | Sex | Age | Stage | Therapy Types | Drugs | Outcome |
| GTF2H1 | SNV | Missense_Mutation | rs755416297 | c.127N>G | p.Ile43Val | p.I43V | P32780 | protein_coding | tolerated(1) | benign(0) | TCGA-AN-A046-01 | Breast | breast invasive carcinoma | Female | >=65 | I/II | Unknown | Unknown | SD |
| GTF2H1 | SNV | Missense_Mutation | rs751551035 | c.1584N>A | p.Met528Ile | p.M528I | P32780 | protein_coding | tolerated(0.13) | benign(0.421) | TCGA-B6-A0RL-01 | Breast | breast invasive carcinoma | Female | <65 | I/II | Unknown | Unknown | SD |
| GTF2H1 | SNV | Missense_Mutation | c.1171T>G | p.Ser391Ala | p.S391A | P32780 | protein_coding | tolerated(0.47) | benign(0.13) | TCGA-AA-3977-01 | Colorectum | colon adenocarcinoma | Male | >=65 | I/II | Unknown | Unknown | SD | |
| GTF2H1 | SNV | Missense_Mutation | c.781G>C | p.Gly261Arg | p.G261R | P32780 | protein_coding | tolerated(0.08) | benign(0.043) | TCGA-AA-A00O-01 | Colorectum | colon adenocarcinoma | Female | >=65 | III/IV | Unknown | Unknown | SD | |
| GTF2H1 | SNV | Missense_Mutation | rs377563352 | c.1625G>A | p.Arg542Gln | p.R542Q | P32780 | protein_coding | deleterious(0.01) | probably_damaging(0.967) | TCGA-AD-6901-01 | Colorectum | colon adenocarcinoma | Male | >=65 | I/II | Chemotherapy | xeloda | PD |
| GTF2H1 | SNV | Missense_Mutation | c.1490T>C | p.Leu497Ser | p.L497S | P32780 | protein_coding | deleterious(0.02) | benign(0.351) | TCGA-AM-5820-01 | Colorectum | colon adenocarcinoma | Female | <65 | I/II | Unknown | Unknown | SD | |
| GTF2H1 | SNV | Missense_Mutation | novel | c.849N>G | p.Ile283Met | p.I283M | P32780 | protein_coding | tolerated(0.22) | benign(0.081) | TCGA-CA-6717-01 | Colorectum | colon adenocarcinoma | Male | <65 | I/II | Chemotherapy | oxaliplatin | CR |
| GTF2H1 | SNV | Missense_Mutation | c.1468N>A | p.Val490Ile | p.V490I | P32780 | protein_coding | tolerated(0.09) | benign(0.139) | TCGA-WS-AB45-01 | Colorectum | colon adenocarcinoma | Female | <65 | I/II | Unknown | Unknown | SD | |
| GTF2H1 | SNV | Missense_Mutation | c.179N>C | p.Lys60Thr | p.K60T | P32780 | protein_coding | deleterious(0) | probably_damaging(0.952) | TCGA-AG-3890-01 | Colorectum | rectum adenocarcinoma | Male | <65 | I/II | Unknown | Unknown | SD | |
| GTF2H1 | SNV | Missense_Mutation | novel | c.1217N>T | p.Ser406Ile | p.S406I | P32780 | protein_coding | tolerated(0.27) | benign(0.001) | TCGA-AG-A002-01 | Colorectum | rectum adenocarcinoma | Male | <65 | I/II | Unknown | Unknown | SD |
| Page: 1 2 3 4 5 6 |
Top |
Related drugs of malignant transformation related genes |
| Identification of chemicals and drugs interact with genes involved in malignant transfromation |
| (DGIdb 4.0) |
| Entrez ID | Symbol | Category | Interaction Types | Drug Claim Name | Drug Name | PMIDs |
| Page: 1 |

Copyright 2023-Present -The University of Texas Health Science Center at Houston |