
|
|||||
|
 | |
| |
| |
| |
| |
| |
|
Gene: GTF2F2 |
Gene summary for GTF2F2 |
| Gene information | Species | Human | Gene symbol | GTF2F2 | Gene ID | 2963 |
| Gene name | general transcription factor IIF subunit 2 | |
| Gene Alias | BTF4 | |
| Cytomap | 13q14.12-q14.13 | |
| Gene Type | protein-coding | GO ID | GO:0006139 | UniProtAcc | A0A024RDU9 |
Top |
Malignant transformation analysis |
| Identification of the aberrant gene expression in precancerous and cancerous lesions by comparing the gene expression of stem-like cells in diseased tissues with normal stem cells |
| Entrez ID | Symbol | Replicates | Species | Organ | Tissue | Adj P-value | Log2FC | Malignancy |
| 2963 | GTF2F2 | HTA11_3410_2000001011 | Human | Colorectum | AD | 3.58e-06 | -3.57e-01 | 0.0155 |
| 2963 | GTF2F2 | HTA11_2487_2000001011 | Human | Colorectum | SER | 5.78e-05 | -3.82e-01 | -0.1808 |
| 2963 | GTF2F2 | HTA11_10711_2000001011 | Human | Colorectum | AD | 1.97e-02 | -3.61e-01 | 0.0338 |
| 2963 | GTF2F2 | HTA11_7696_3000711011 | Human | Colorectum | AD | 2.00e-02 | -2.97e-01 | 0.0674 |
| 2963 | GTF2F2 | HTA11_99999970781_79442 | Human | Colorectum | MSS | 6.40e-05 | -3.63e-01 | 0.294 |
| 2963 | GTF2F2 | HTA11_99999965104_69814 | Human | Colorectum | MSS | 7.92e-04 | 6.09e-01 | 0.281 |
| 2963 | GTF2F2 | A001-C-207 | Human | Colorectum | FAP | 2.20e-04 | -1.89e-01 | 0.1278 |
| 2963 | GTF2F2 | A015-C-203 | Human | Colorectum | FAP | 1.28e-26 | -4.39e-01 | -0.1294 |
| 2963 | GTF2F2 | A015-C-204 | Human | Colorectum | FAP | 1.53e-06 | -2.38e-01 | -0.0228 |
| 2963 | GTF2F2 | A014-C-040 | Human | Colorectum | FAP | 1.35e-05 | -4.55e-01 | -0.1184 |
| 2963 | GTF2F2 | A002-C-201 | Human | Colorectum | FAP | 1.33e-16 | -3.85e-01 | 0.0324 |
| 2963 | GTF2F2 | A002-C-203 | Human | Colorectum | FAP | 3.51e-03 | -1.40e-01 | 0.2786 |
| 2963 | GTF2F2 | A001-C-119 | Human | Colorectum | FAP | 1.64e-09 | -3.99e-01 | -0.1557 |
| 2963 | GTF2F2 | A001-C-108 | Human | Colorectum | FAP | 7.72e-19 | -2.55e-01 | -0.0272 |
| 2963 | GTF2F2 | A002-C-205 | Human | Colorectum | FAP | 1.67e-23 | -4.38e-01 | -0.1236 |
| 2963 | GTF2F2 | A001-C-104 | Human | Colorectum | FAP | 3.67e-04 | -1.89e-01 | 0.0184 |
| 2963 | GTF2F2 | A015-C-005 | Human | Colorectum | FAP | 4.33e-09 | -3.65e-01 | -0.0336 |
| 2963 | GTF2F2 | A015-C-006 | Human | Colorectum | FAP | 8.00e-17 | -4.51e-01 | -0.0994 |
| 2963 | GTF2F2 | A015-C-106 | Human | Colorectum | FAP | 2.11e-15 | -3.64e-01 | -0.0511 |
| 2963 | GTF2F2 | A002-C-114 | Human | Colorectum | FAP | 2.45e-20 | -4.17e-01 | -0.1561 |
| Page: 1 2 3 4 5 6 7 8 |
| Tissue | Expression Dynamics | Abbreviation |
| Colorectum (GSE201348) |  | FAP: Familial adenomatous polyposis |
| CRC: Colorectal cancer | ||
| Colorectum (HTA11) |  | AD: Adenomas |
| SER: Sessile serrated lesions | ||
| MSI-H: Microsatellite-high colorectal cancer | ||
| MSS: Microsatellite stable colorectal cancer | ||
| Esophagus | 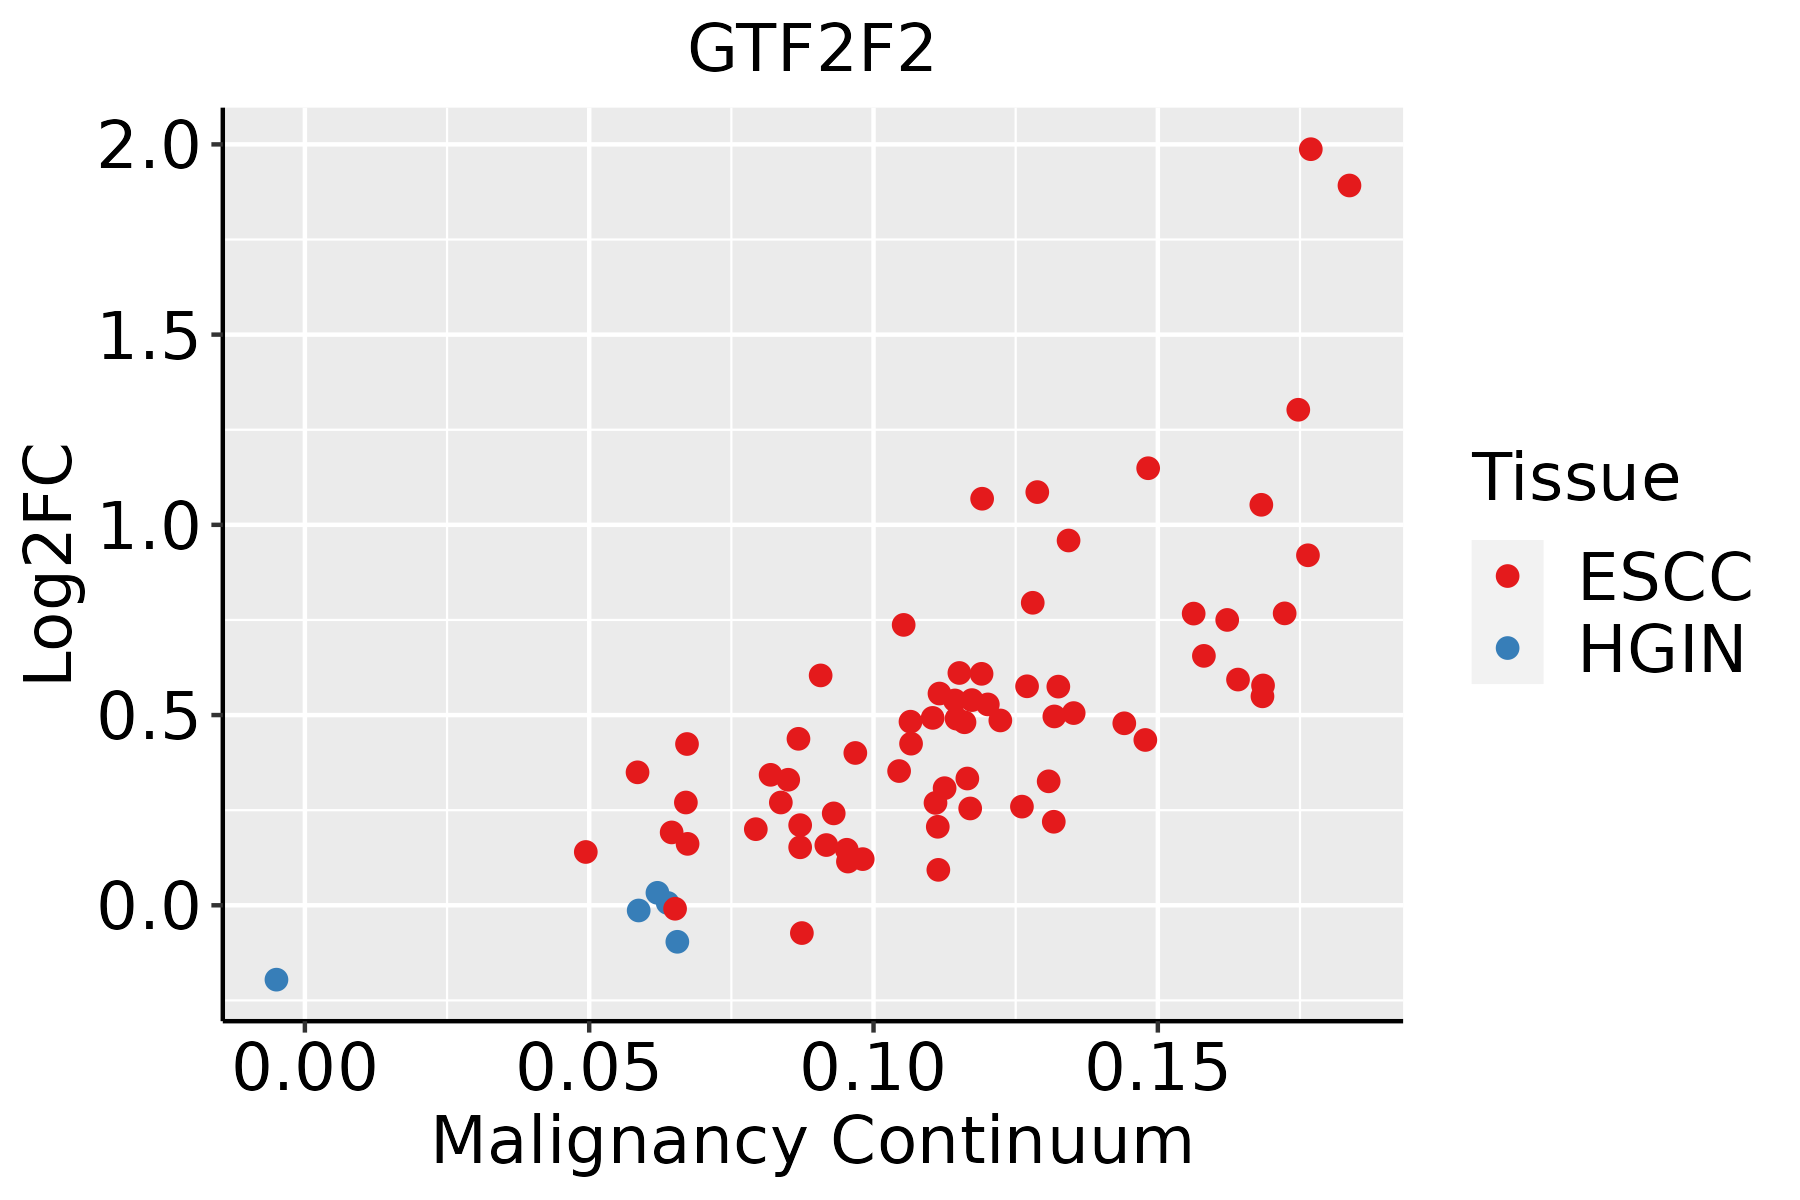 | ESCC: Esophageal squamous cell carcinoma |
| HGIN: High-grade intraepithelial neoplasias | ||
| LGIN: Low-grade intraepithelial neoplasias | ||
| Liver | 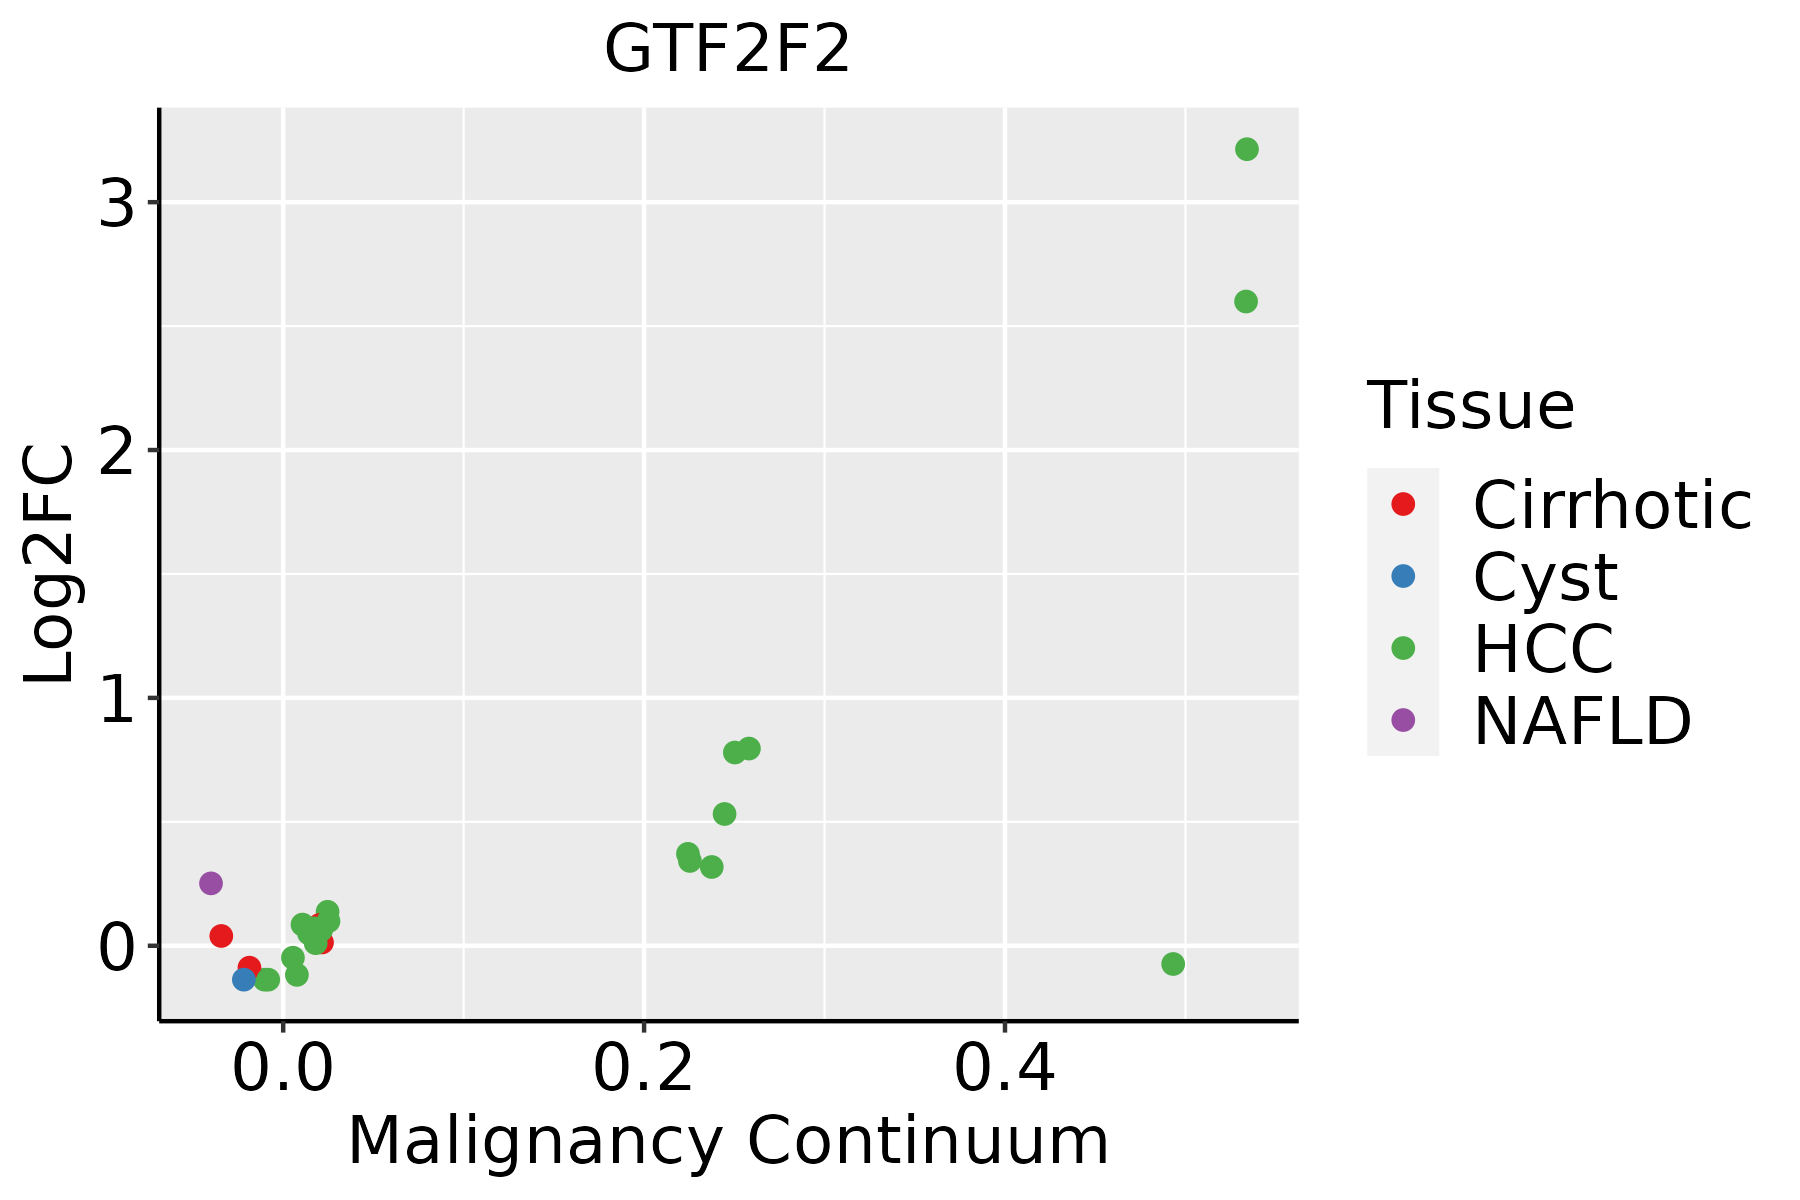 | HCC: Hepatocellular carcinoma |
| NAFLD: Non-alcoholic fatty liver disease | ||
| Oral Cavity |  | EOLP: Erosive Oral lichen planus |
| LP: leukoplakia | ||
| NEOLP: Non-erosive oral lichen planus | ||
| OSCC: Oral squamous cell carcinoma | ||
| Skin |  | AK: Actinic keratosis |
| cSCC: Cutaneous squamous cell carcinoma | ||
| SCCIS:squamous cell carcinoma in situ | ||
| Thyroid | 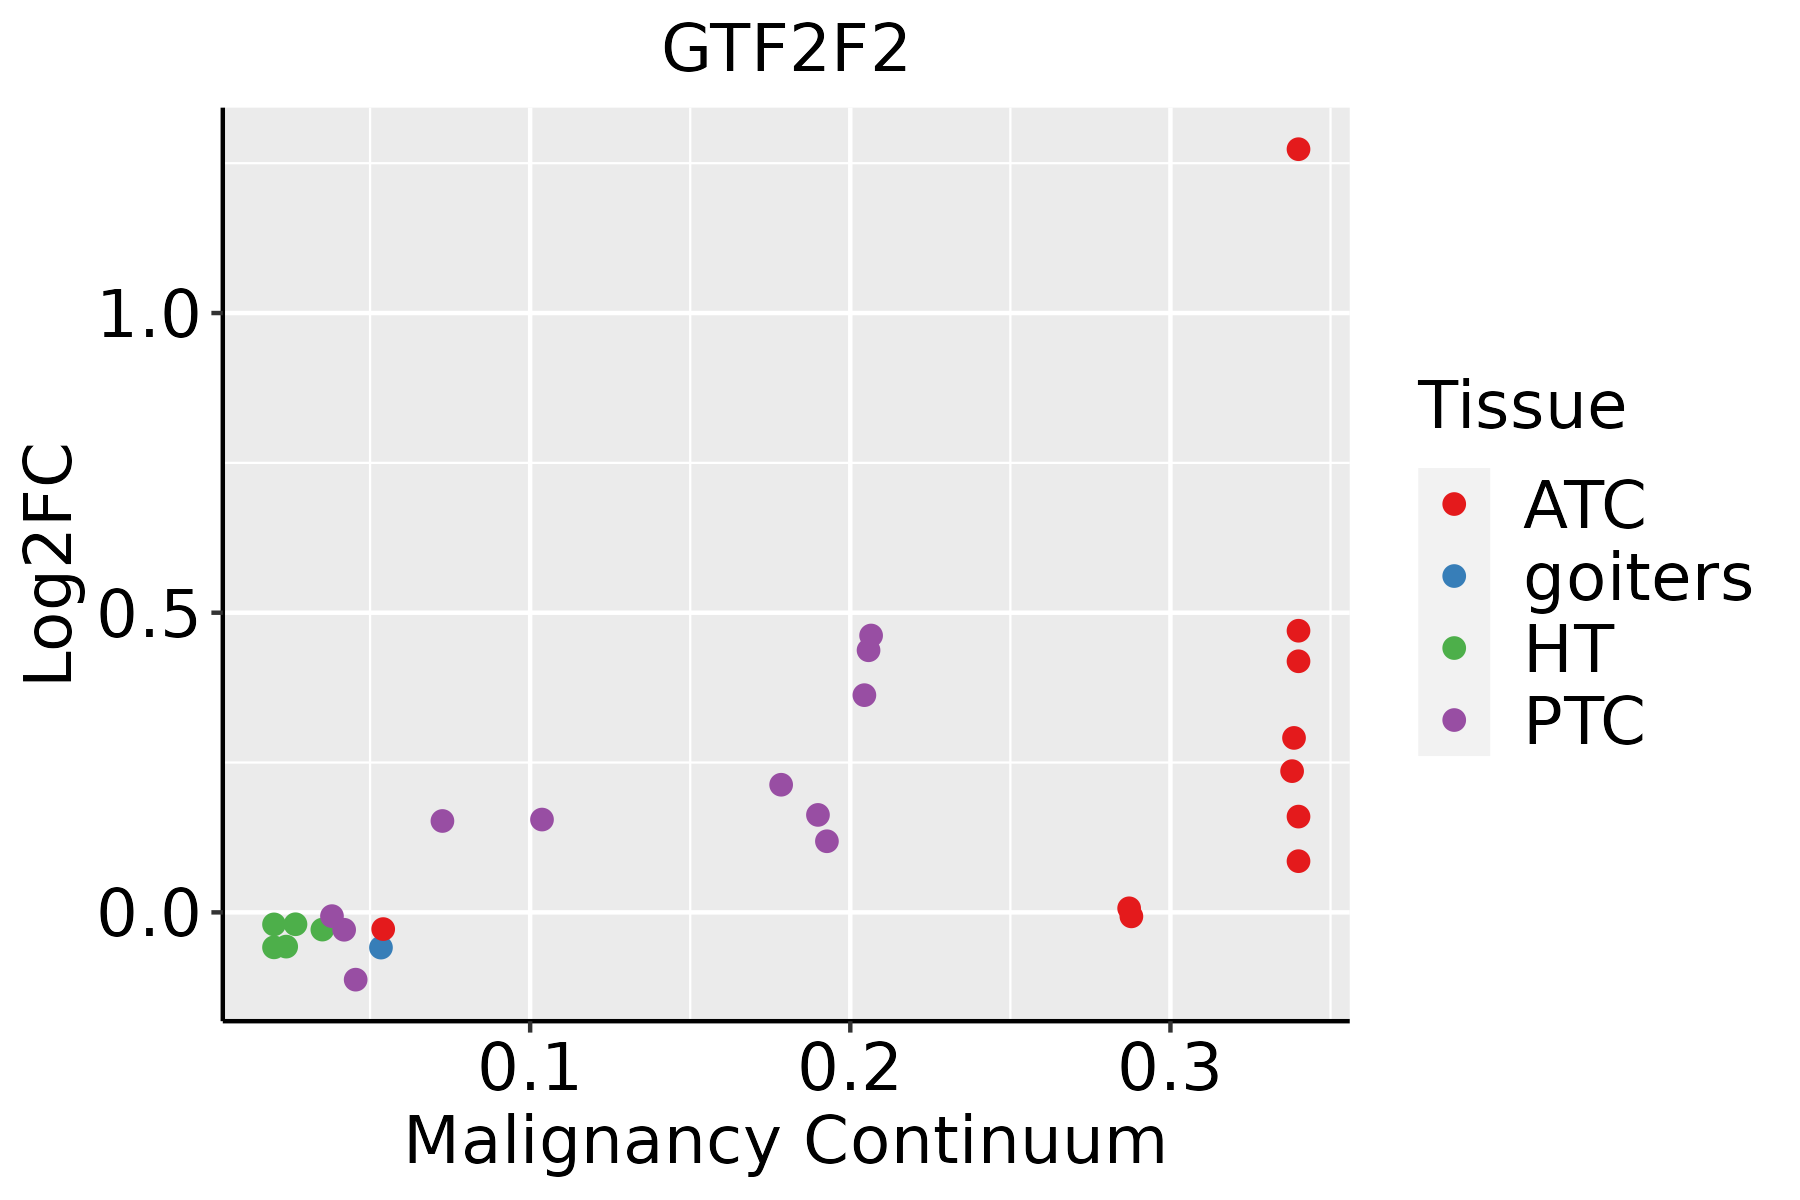 | ATC: Anaplastic thyroid cancer |
| HT: Hashimoto's thyroiditis | ||
| PTC: Papillary thyroid cancer |
| ∗log2FC in expression of this searched gene in stem-like cells from each diseased tissue sample relative to stem-like cells in normal samples in each tissue plotted against the malignancy continuum. Samples are colored based on if they are from different disease stage. |
Top |
Malignant transformation related pathway analysis |
| Find out the enriched GO biological processes and KEGG pathways involved in transition from healthy to precancer to cancer |
| Tissue | Disease Stage | Enriched GO biological Processes |
| Colorectum | AD |  |
| Colorectum | SER |  |
| Colorectum | MSS |  |
| Colorectum | MSI-H |  |
| Colorectum | FAP |  |
| ∗Top 15 enriched GO BP terms are showed in the bar plot of each disease state in each tissue. Each row represents a significant GO biological process which is colored according to the -log10(p.adjust). |
| Page: 1 2 3 4 5 6 7 8 9 |
| GO ID | Tissue | Disease Stage | Description | Gene Ratio | Bg Ratio | pvalue | p.adjust | Count |
| GO:0032392 | Colorectum | AD | DNA geometric change | 31/3918 | 90/18723 | 2.02e-03 | 1.63e-02 | 31 |
| GO:0006354 | Colorectum | AD | DNA-templated transcription, elongation | 31/3918 | 91/18723 | 2.46e-03 | 1.90e-02 | 31 |
| GO:0006368 | Colorectum | AD | transcription elongation from RNA polymerase II promoter | 24/3918 | 69/18723 | 5.35e-03 | 3.52e-02 | 24 |
| GO:00323921 | Colorectum | MSS | DNA geometric change | 29/3467 | 90/18723 | 1.26e-03 | 1.20e-02 | 29 |
| GO:00063541 | Colorectum | MSS | DNA-templated transcription, elongation | 29/3467 | 91/18723 | 1.52e-03 | 1.39e-02 | 29 |
| GO:00063681 | Colorectum | MSS | transcription elongation from RNA polymerase II promoter | 22/3467 | 69/18723 | 5.31e-03 | 3.62e-02 | 22 |
| GO:0032508 | Colorectum | MSS | DNA duplex unwinding | 25/3467 | 84/18723 | 8.27e-03 | 4.99e-02 | 25 |
| GO:00063682 | Colorectum | FAP | transcription elongation from RNA polymerase II promoter | 20/2622 | 69/18723 | 9.25e-04 | 9.26e-03 | 20 |
| GO:00063542 | Colorectum | FAP | DNA-templated transcription, elongation | 24/2622 | 91/18723 | 1.32e-03 | 1.22e-02 | 24 |
| GO:00063543 | Colorectum | CRC | DNA-templated transcription, elongation | 19/2078 | 91/18723 | 4.74e-03 | 3.67e-02 | 19 |
| GO:000635414 | Esophagus | ESCC | DNA-templated transcription, elongation | 76/8552 | 91/18723 | 8.35e-14 | 4.11e-12 | 76 |
| GO:000636814 | Esophagus | ESCC | transcription elongation from RNA polymerase II promoter | 56/8552 | 69/18723 | 1.40e-09 | 3.30e-08 | 56 |
| GO:00063673 | Esophagus | ESCC | transcription initiation from RNA polymerase II promoter | 56/8552 | 77/18723 | 1.30e-06 | 1.59e-05 | 56 |
| GO:000635211 | Esophagus | ESCC | DNA-templated transcription, initiation | 86/8552 | 130/18723 | 1.88e-06 | 2.19e-05 | 86 |
| GO:003239214 | Esophagus | ESCC | DNA geometric change | 62/8552 | 90/18723 | 7.02e-06 | 7.04e-05 | 62 |
| GO:003250813 | Esophagus | ESCC | DNA duplex unwinding | 58/8552 | 84/18723 | 1.23e-05 | 1.14e-04 | 58 |
| GO:000635411 | Liver | HCC | DNA-templated transcription, elongation | 64/7958 | 91/18723 | 7.00e-08 | 1.44e-06 | 64 |
| GO:000636811 | Liver | HCC | transcription elongation from RNA polymerase II promoter | 50/7958 | 69/18723 | 4.32e-07 | 7.22e-06 | 50 |
| GO:00063671 | Liver | HCC | transcription initiation from RNA polymerase II promoter | 52/7958 | 77/18723 | 7.87e-06 | 9.27e-05 | 52 |
| GO:0006352 | Liver | HCC | DNA-templated transcription, initiation | 78/7958 | 130/18723 | 4.19e-05 | 4.11e-04 | 78 |
| Page: 1 2 3 |
| Pathway ID | Tissue | Disease Stage | Description | Gene Ratio | Bg Ratio | pvalue | p.adjust | qvalue | Count |
| hsa030222 | Esophagus | ESCC | Basal transcription factors | 35/4205 | 45/8465 | 1.01e-04 | 4.06e-04 | 2.08e-04 | 35 |
| hsa0302211 | Esophagus | ESCC | Basal transcription factors | 35/4205 | 45/8465 | 1.01e-04 | 4.06e-04 | 2.08e-04 | 35 |
| hsa03022 | Oral cavity | OSCC | Basal transcription factors | 28/3704 | 45/8465 | 9.53e-03 | 2.11e-02 | 1.08e-02 | 28 |
| hsa030221 | Oral cavity | OSCC | Basal transcription factors | 28/3704 | 45/8465 | 9.53e-03 | 2.11e-02 | 1.08e-02 | 28 |
| Page: 1 |
Top |
Cell-cell communication analysis |
| Identification of potential cell-cell interactions between two cell types and their ligand-receptor pairs for different disease states |
| Ligand | Receptor | LRpair | Pathway | Tissue | Disease Stage |
| Page: 1 |
Top |
Single-cell gene regulatory network inference analysis |
| Find out the significant the regulons (TFs) and the target genes of each regulon across cell types for different disease states |
| TF | Cell Type | Tissue | Disease Stage | Target Gene | RSS | Regulon Activity |
| ∗The dot plots of a searched regulon are shown for all cell subpopulations in each disease state of each tissue based on the regulon specific score inferred using pySCENIC and by calculating the average expression. |
| Page: 1 |
Top |
Somatic mutation of malignant transformation related genes |
| Annotation of somatic variants for genes involved in malignant transformation |
| Hugo Symbol | Variant Class | Variant Classification | dbSNP RS | HGVSc | HGVSp | HGVSp Short | SWISSPROT | BIOTYPE | SIFT | PolyPhen | Tumor Sample Barcode | Tissue | Histology | Sex | Age | Stage | Therapy Types | Drugs | Outcome |
| GTF2F2 | SNV | Missense_Mutation | novel | c.428N>G | p.Gln143Arg | p.Q143R | P13984 | protein_coding | deleterious(0.02) | possibly_damaging(0.616) | TCGA-AP-A1DK-01 | Endometrium | uterine corpus endometrioid carcinoma | Female | <65 | I/II | Unknown | Unknown | SD |
| GTF2F2 | SNV | Missense_Mutation | novel | c.296N>T | p.Ser99Ile | p.S99I | P13984 | protein_coding | tolerated(0.09) | possibly_damaging(0.521) | TCGA-AX-A06F-01 | Endometrium | uterine corpus endometrioid carcinoma | Female | <65 | III/IV | Chemotherapy | carboplatin | SD |
| GTF2F2 | SNV | Missense_Mutation | novel | c.152N>T | p.Arg51Met | p.R51M | P13984 | protein_coding | tolerated(0.13) | benign(0.085) | TCGA-AX-A2HC-01 | Endometrium | uterine corpus endometrioid carcinoma | Female | <65 | III/IV | Chemotherapy | paclitaxel | PD |
| GTF2F2 | SNV | Missense_Mutation | c.193N>T | p.Ile65Phe | p.I65F | P13984 | protein_coding | tolerated(0.12) | benign(0.203) | TCGA-B5-A0JV-01 | Endometrium | uterine corpus endometrioid carcinoma | Female | <65 | I/II | Unknown | Unknown | PD | |
| GTF2F2 | SNV | Missense_Mutation | rs768761643 | c.490G>A | p.Glu164Lys | p.E164K | P13984 | protein_coding | deleterious(0) | benign(0.009) | TCGA-E6-A1LX-01 | Endometrium | uterine corpus endometrioid carcinoma | Female | <65 | I/II | Unknown | Unknown | SD |
| GTF2F2 | SNV | Missense_Mutation | novel | c.311T>C | p.Leu104Pro | p.L104P | P13984 | protein_coding | deleterious(0.01) | benign(0.324) | TCGA-EY-A5W2-01 | Endometrium | uterine corpus endometrioid carcinoma | Female | >=65 | I/II | Unknown | Unknown | SD |
| GTF2F2 | SNV | Missense_Mutation | novel | c.269G>A | p.Gly90Glu | p.G90E | P13984 | protein_coding | tolerated(0.07) | probably_damaging(0.926) | TCGA-22-5481-01 | Lung | lung squamous cell carcinoma | Female | >=65 | I/II | Unknown | Unknown | PD |
| GTF2F2 | SNV | Missense_Mutation | c.491A>T | p.Glu164Val | p.E164V | P13984 | protein_coding | deleterious(0.02) | benign(0.035) | TCGA-CV-A45W-01 | Oral cavity | head & neck squamous cell carcinoma | Male | >=65 | I/II | Unknown | Unknown | SD | |
| GTF2F2 | SNV | Missense_Mutation | novel | c.68N>C | p.Val23Ala | p.V23A | P13984 | protein_coding | deleterious(0) | probably_damaging(0.991) | TCGA-F7-A624-01 | Oral cavity | head & neck squamous cell carcinoma | Male | >=65 | I/II | Unknown | Unknown | SD |
| GTF2F2 | SNV | Missense_Mutation | c.535N>A | p.Asp179Asn | p.D179N | P13984 | protein_coding | deleterious(0.02) | possibly_damaging(0.744) | TCGA-BR-6452-01 | Stomach | stomach adenocarcinoma | Female | >=65 | I/II | Unknown | Unknown | SD |
| Page: 1 2 |
Top |
Related drugs of malignant transformation related genes |
| Identification of chemicals and drugs interact with genes involved in malignant transfromation |
| (DGIdb 4.0) |
| Entrez ID | Symbol | Category | Interaction Types | Drug Claim Name | Drug Name | PMIDs |
| Page: 1 |

Copyright 2023-Present -The University of Texas Health Science Center at Houston |