
|
|||||
|
 | |
| |
| |
| |
| |
| |
|
Gene: GTF2E2 |
Gene summary for GTF2E2 |
| Gene information | Species | Human | Gene symbol | GTF2E2 | Gene ID | 2961 |
| Gene name | general transcription factor IIE subunit 2 | |
| Gene Alias | FE | |
| Cytomap | 8p12 | |
| Gene Type | protein-coding | GO ID | GO:0006139 | UniProtAcc | P29084 |
Top |
Malignant transformation analysis |
| Identification of the aberrant gene expression in precancerous and cancerous lesions by comparing the gene expression of stem-like cells in diseased tissues with normal stem cells |
| Entrez ID | Symbol | Replicates | Species | Organ | Tissue | Adj P-value | Log2FC | Malignancy |
| 2961 | GTF2E2 | LZE4T | Human | Esophagus | ESCC | 2.42e-20 | 4.16e-01 | 0.0811 |
| 2961 | GTF2E2 | LZE8T | Human | Esophagus | ESCC | 6.23e-04 | 2.07e-02 | 0.067 |
| 2961 | GTF2E2 | LZE20T | Human | Esophagus | ESCC | 5.35e-11 | 1.63e-01 | 0.0662 |
| 2961 | GTF2E2 | LZE22T | Human | Esophagus | ESCC | 1.39e-06 | 6.68e-01 | 0.068 |
| 2961 | GTF2E2 | LZE24T | Human | Esophagus | ESCC | 3.02e-36 | 1.20e+00 | 0.0596 |
| 2961 | GTF2E2 | P1T-E | Human | Esophagus | ESCC | 1.46e-07 | 5.42e-01 | 0.0875 |
| 2961 | GTF2E2 | P2T-E | Human | Esophagus | ESCC | 2.87e-42 | 7.11e-01 | 0.1177 |
| 2961 | GTF2E2 | P4T-E | Human | Esophagus | ESCC | 1.72e-45 | 1.14e+00 | 0.1323 |
| 2961 | GTF2E2 | P5T-E | Human | Esophagus | ESCC | 2.57e-14 | 2.29e-01 | 0.1327 |
| 2961 | GTF2E2 | P8T-E | Human | Esophagus | ESCC | 2.11e-35 | 6.17e-01 | 0.0889 |
| 2961 | GTF2E2 | P9T-E | Human | Esophagus | ESCC | 1.11e-22 | 3.21e-01 | 0.1131 |
| 2961 | GTF2E2 | P10T-E | Human | Esophagus | ESCC | 1.11e-36 | 5.95e-01 | 0.116 |
| 2961 | GTF2E2 | P11T-E | Human | Esophagus | ESCC | 4.31e-11 | 4.05e-01 | 0.1426 |
| 2961 | GTF2E2 | P12T-E | Human | Esophagus | ESCC | 5.13e-30 | 6.33e-01 | 0.1122 |
| 2961 | GTF2E2 | P15T-E | Human | Esophagus | ESCC | 7.69e-65 | 1.54e+00 | 0.1149 |
| 2961 | GTF2E2 | P16T-E | Human | Esophagus | ESCC | 9.83e-31 | 5.51e-01 | 0.1153 |
| 2961 | GTF2E2 | P17T-E | Human | Esophagus | ESCC | 3.53e-10 | 5.35e-01 | 0.1278 |
| 2961 | GTF2E2 | P19T-E | Human | Esophagus | ESCC | 2.97e-06 | 6.88e-01 | 0.1662 |
| 2961 | GTF2E2 | P20T-E | Human | Esophagus | ESCC | 1.13e-37 | 8.49e-01 | 0.1124 |
| 2961 | GTF2E2 | P21T-E | Human | Esophagus | ESCC | 5.77e-42 | 6.76e-01 | 0.1617 |
| Page: 1 2 3 4 5 6 |
| Tissue | Expression Dynamics | Abbreviation |
| Esophagus | 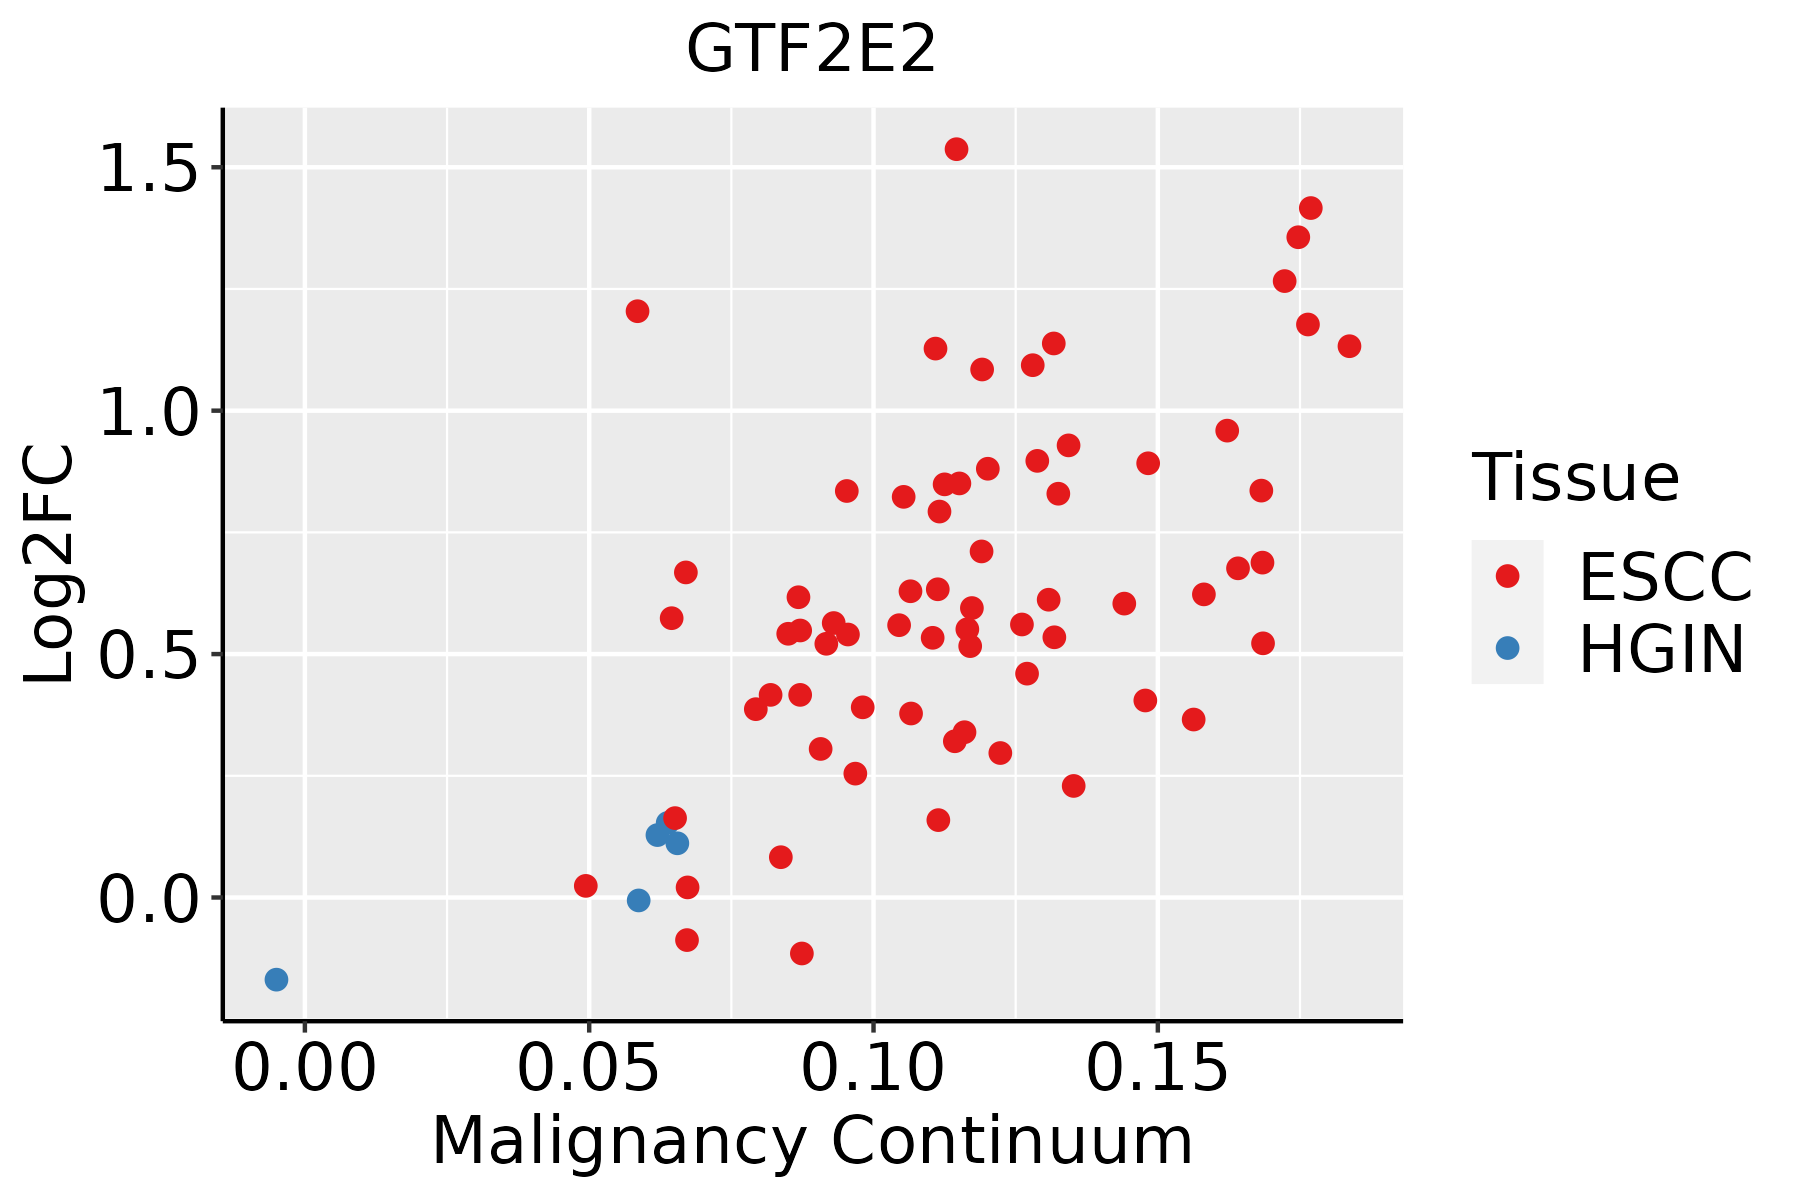 | ESCC: Esophageal squamous cell carcinoma |
| HGIN: High-grade intraepithelial neoplasias | ||
| LGIN: Low-grade intraepithelial neoplasias | ||
| Liver |  | HCC: Hepatocellular carcinoma |
| NAFLD: Non-alcoholic fatty liver disease | ||
| Oral Cavity | 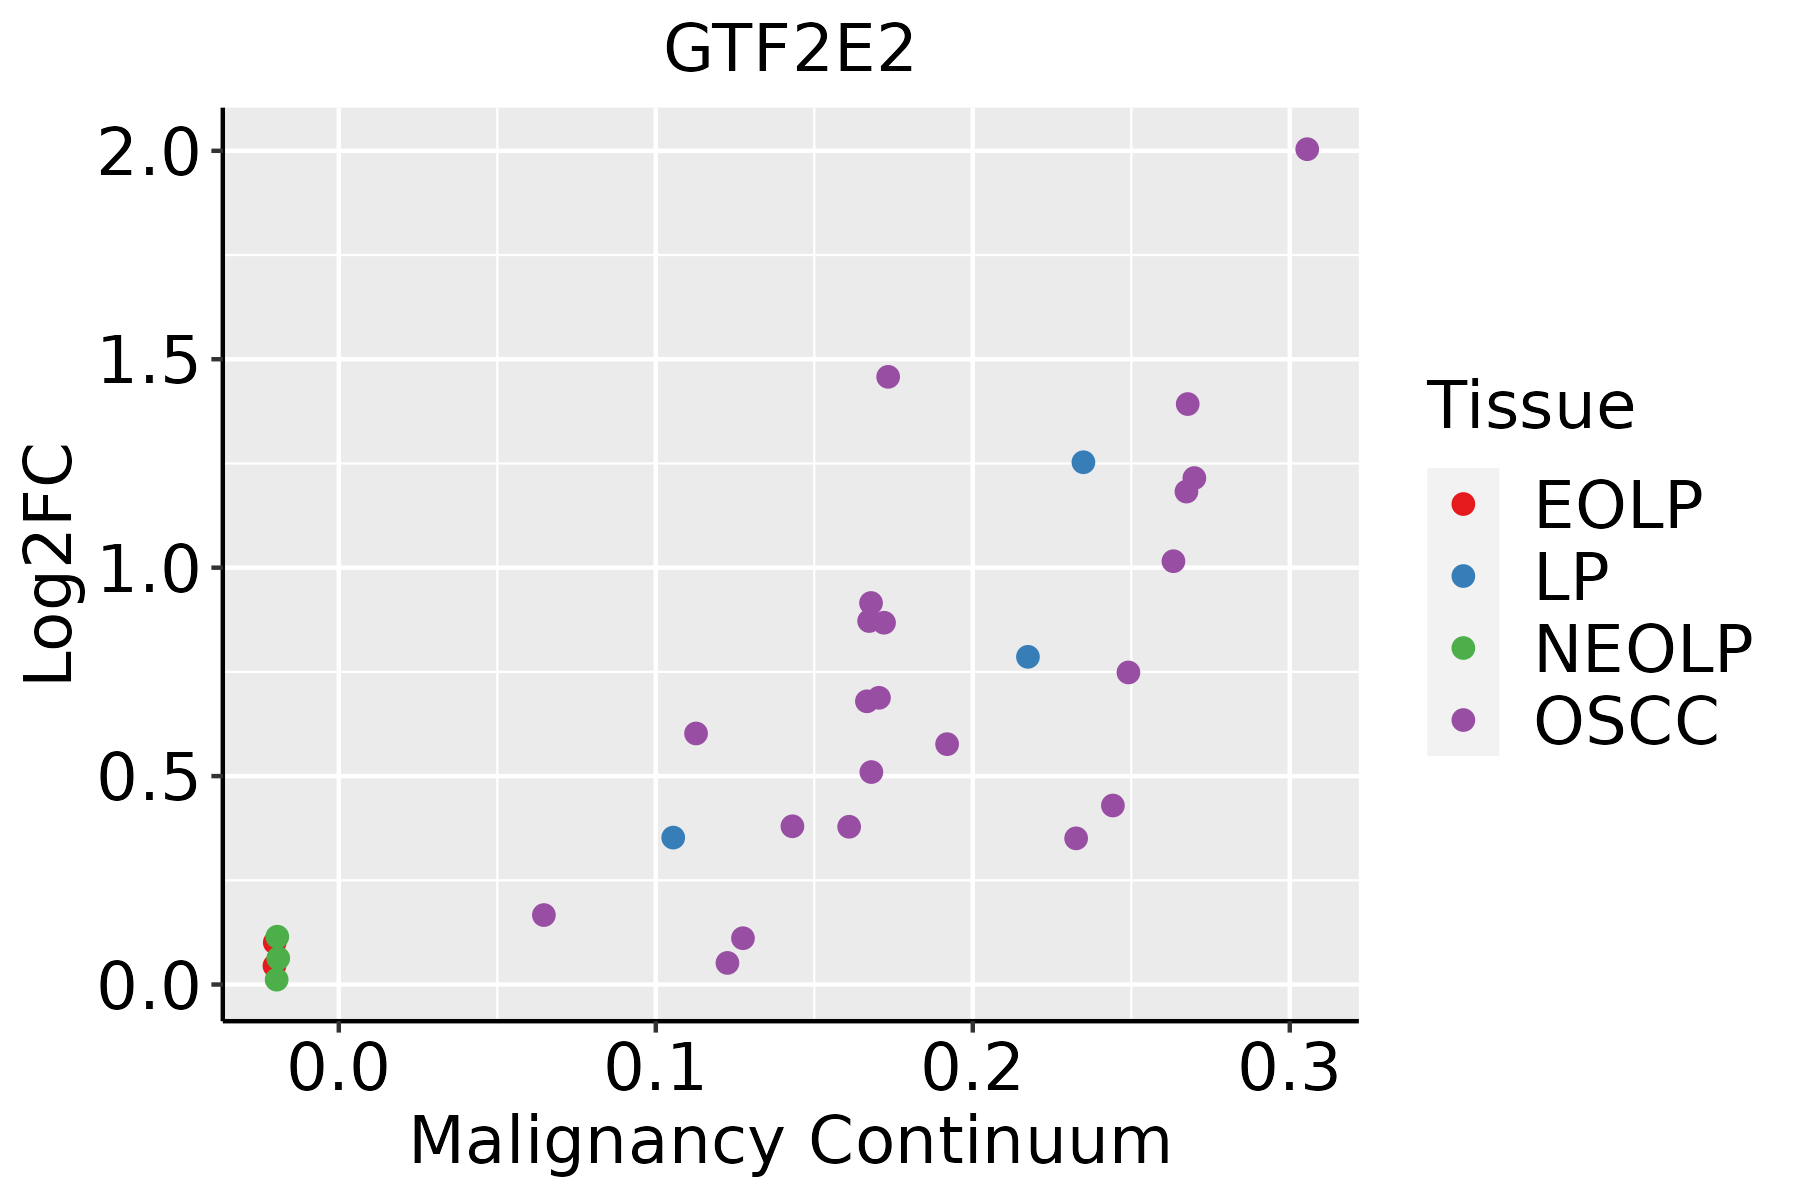 | EOLP: Erosive Oral lichen planus |
| LP: leukoplakia | ||
| NEOLP: Non-erosive oral lichen planus | ||
| OSCC: Oral squamous cell carcinoma | ||
| Skin |  | AK: Actinic keratosis |
| cSCC: Cutaneous squamous cell carcinoma | ||
| SCCIS:squamous cell carcinoma in situ | ||
| Thyroid |  | ATC: Anaplastic thyroid cancer |
| HT: Hashimoto's thyroiditis | ||
| PTC: Papillary thyroid cancer |
| ∗log2FC in expression of this searched gene in stem-like cells from each diseased tissue sample relative to stem-like cells in normal samples in each tissue plotted against the malignancy continuum. Samples are colored based on if they are from different disease stage. |
Top |
Malignant transformation related pathway analysis |
| Find out the enriched GO biological processes and KEGG pathways involved in transition from healthy to precancer to cancer |
| Tissue | Disease Stage | Enriched GO biological Processes |
| Colorectum | AD |  |
| Colorectum | SER |  |
| Colorectum | MSS |  |
| Colorectum | MSI-H |  |
| Colorectum | FAP |  |
| ∗Top 15 enriched GO BP terms are showed in the bar plot of each disease state in each tissue. Each row represents a significant GO biological process which is colored according to the -log10(p.adjust). |
| Page: 1 2 3 4 5 6 7 8 9 |
| GO ID | Tissue | Disease Stage | Description | Gene Ratio | Bg Ratio | pvalue | p.adjust | Count |
| GO:00063673 | Esophagus | ESCC | transcription initiation from RNA polymerase II promoter | 56/8552 | 77/18723 | 1.30e-06 | 1.59e-05 | 56 |
| GO:000635211 | Esophagus | ESCC | DNA-templated transcription, initiation | 86/8552 | 130/18723 | 1.88e-06 | 2.19e-05 | 86 |
| GO:0006367 | Liver | Cirrhotic | transcription initiation from RNA polymerase II promoter | 31/4634 | 77/18723 | 1.91e-03 | 1.20e-02 | 31 |
| GO:00063671 | Liver | HCC | transcription initiation from RNA polymerase II promoter | 52/7958 | 77/18723 | 7.87e-06 | 9.27e-05 | 52 |
| GO:0006352 | Liver | HCC | DNA-templated transcription, initiation | 78/7958 | 130/18723 | 4.19e-05 | 4.11e-04 | 78 |
| GO:00063522 | Oral cavity | OSCC | DNA-templated transcription, initiation | 74/7305 | 130/18723 | 2.56e-05 | 2.39e-04 | 74 |
| GO:00063672 | Oral cavity | OSCC | transcription initiation from RNA polymerase II promoter | 46/7305 | 77/18723 | 1.82e-04 | 1.24e-03 | 46 |
| GO:000636711 | Oral cavity | LP | transcription initiation from RNA polymerase II promoter | 31/4623 | 77/18723 | 1.83e-03 | 1.38e-02 | 31 |
| GO:00063521 | Oral cavity | LP | DNA-templated transcription, initiation | 45/4623 | 130/18723 | 7.03e-03 | 3.96e-02 | 45 |
| GO:000635212 | Skin | cSCC | DNA-templated transcription, initiation | 57/4864 | 130/18723 | 7.28e-06 | 1.01e-04 | 57 |
| GO:00063674 | Skin | cSCC | transcription initiation from RNA polymerase II promoter | 37/4864 | 77/18723 | 2.53e-05 | 2.87e-04 | 37 |
| GO:00063675 | Thyroid | PTC | transcription initiation from RNA polymerase II promoter | 44/5968 | 77/18723 | 4.04e-06 | 5.05e-05 | 44 |
| GO:00063525 | Thyroid | PTC | DNA-templated transcription, initiation | 63/5968 | 130/18723 | 5.72e-05 | 5.05e-04 | 63 |
| GO:000636712 | Thyroid | ATC | transcription initiation from RNA polymerase II promoter | 44/6293 | 77/18723 | 1.86e-05 | 1.70e-04 | 44 |
| GO:000635213 | Thyroid | ATC | DNA-templated transcription, initiation | 64/6293 | 130/18723 | 1.60e-04 | 1.10e-03 | 64 |
| Page: 1 |
| Pathway ID | Tissue | Disease Stage | Description | Gene Ratio | Bg Ratio | pvalue | p.adjust | qvalue | Count |
| hsa0520325 | Esophagus | ESCC | Viral carcinogenesis | 137/4205 | 204/8465 | 2.47e-07 | 1.88e-06 | 9.62e-07 | 137 |
| hsa030222 | Esophagus | ESCC | Basal transcription factors | 35/4205 | 45/8465 | 1.01e-04 | 4.06e-04 | 2.08e-04 | 35 |
| hsa0520335 | Esophagus | ESCC | Viral carcinogenesis | 137/4205 | 204/8465 | 2.47e-07 | 1.88e-06 | 9.62e-07 | 137 |
| hsa0302211 | Esophagus | ESCC | Basal transcription factors | 35/4205 | 45/8465 | 1.01e-04 | 4.06e-04 | 2.08e-04 | 35 |
| hsa05203 | Liver | Cirrhotic | Viral carcinogenesis | 76/2530 | 204/8465 | 1.34e-02 | 4.20e-02 | 2.59e-02 | 76 |
| hsa052031 | Liver | Cirrhotic | Viral carcinogenesis | 76/2530 | 204/8465 | 1.34e-02 | 4.20e-02 | 2.59e-02 | 76 |
| hsa052032 | Liver | HCC | Viral carcinogenesis | 117/4020 | 204/8465 | 2.68e-03 | 8.98e-03 | 5.00e-03 | 117 |
| hsa052033 | Liver | HCC | Viral carcinogenesis | 117/4020 | 204/8465 | 2.68e-03 | 8.98e-03 | 5.00e-03 | 117 |
| hsa052038 | Oral cavity | OSCC | Viral carcinogenesis | 124/3704 | 204/8465 | 5.57e-07 | 3.28e-06 | 1.67e-06 | 124 |
| hsa03022 | Oral cavity | OSCC | Basal transcription factors | 28/3704 | 45/8465 | 9.53e-03 | 2.11e-02 | 1.08e-02 | 28 |
| hsa0520314 | Oral cavity | OSCC | Viral carcinogenesis | 124/3704 | 204/8465 | 5.57e-07 | 3.28e-06 | 1.67e-06 | 124 |
| hsa030221 | Oral cavity | OSCC | Basal transcription factors | 28/3704 | 45/8465 | 9.53e-03 | 2.11e-02 | 1.08e-02 | 28 |
| hsa0520324 | Oral cavity | LP | Viral carcinogenesis | 90/2418 | 204/8465 | 1.20e-06 | 1.38e-05 | 8.89e-06 | 90 |
| hsa0520334 | Oral cavity | LP | Viral carcinogenesis | 90/2418 | 204/8465 | 1.20e-06 | 1.38e-05 | 8.89e-06 | 90 |
| Page: 1 |
Top |
Cell-cell communication analysis |
| Identification of potential cell-cell interactions between two cell types and their ligand-receptor pairs for different disease states |
| Ligand | Receptor | LRpair | Pathway | Tissue | Disease Stage |
| Page: 1 |
Top |
Single-cell gene regulatory network inference analysis |
| Find out the significant the regulons (TFs) and the target genes of each regulon across cell types for different disease states |
| TF | Cell Type | Tissue | Disease Stage | Target Gene | RSS | Regulon Activity |
| ∗The dot plots of a searched regulon are shown for all cell subpopulations in each disease state of each tissue based on the regulon specific score inferred using pySCENIC and by calculating the average expression. |
| Page: 1 |
Top |
Somatic mutation of malignant transformation related genes |
| Annotation of somatic variants for genes involved in malignant transformation |
| Hugo Symbol | Variant Class | Variant Classification | dbSNP RS | HGVSc | HGVSp | HGVSp Short | SWISSPROT | BIOTYPE | SIFT | PolyPhen | Tumor Sample Barcode | Tissue | Histology | Sex | Age | Stage | Therapy Types | Drugs | Outcome |
| GTF2E2 | SNV | Missense_Mutation | rs774545618 | c.92N>T | p.Ser31Leu | p.S31L | P29084 | protein_coding | tolerated(0.1) | benign(0.119) | TCGA-BH-A0HP-01 | Breast | breast invasive carcinoma | Female | >=65 | III/IV | Chemotherapy | doxorubicin | SD |
| GTF2E2 | SNV | Missense_Mutation | c.386N>G | p.Lys129Arg | p.K129R | P29084 | protein_coding | tolerated(0.05) | possibly_damaging(0.777) | TCGA-AZ-6601-01 | Colorectum | colon adenocarcinoma | Male | >=65 | I/II | Unknown | Unknown | PD | |
| GTF2E2 | SNV | Missense_Mutation | rs780571452 | c.586N>A | p.Asp196Asn | p.D196N | P29084 | protein_coding | tolerated(0.05) | possibly_damaging(0.762) | TCGA-CA-6718-01 | Colorectum | colon adenocarcinoma | Male | <65 | I/II | Unknown | Unknown | PD |
| GTF2E2 | SNV | Missense_Mutation | novel | c.380N>C | p.Asn127Thr | p.N127T | P29084 | protein_coding | deleterious(0) | probably_damaging(1) | TCGA-AG-3892-01 | Colorectum | rectum adenocarcinoma | Female | <65 | I/II | Unknown | Unknown | SD |
| GTF2E2 | SNV | Missense_Mutation | c.823G>A | p.Glu275Lys | p.E275K | P29084 | protein_coding | deleterious(0.01) | benign(0.251) | TCGA-EI-6917-01 | Colorectum | rectum adenocarcinoma | Male | <65 | III/IV | Chemotherapy | 5fluorouracil+oxaciplatina+l-folinian | SD | |
| GTF2E2 | SNV | Missense_Mutation | novel | c.680C>T | p.Ser227Phe | p.S227F | P29084 | protein_coding | deleterious(0.02) | possibly_damaging(0.862) | TCGA-A5-A0G2-01 | Endometrium | uterine corpus endometrioid carcinoma | Female | <65 | III/IV | Unknown | Unknown | SD |
| GTF2E2 | SNV | Missense_Mutation | rs760282859 | c.547A>G | p.Lys183Glu | p.K183E | P29084 | protein_coding | tolerated(0.11) | benign(0.225) | TCGA-A5-A0GP-01 | Endometrium | uterine corpus endometrioid carcinoma | Female | <65 | I/II | Unknown | Unknown | SD |
| GTF2E2 | SNV | Missense_Mutation | rs527328234 | c.581N>A | p.Arg194His | p.R194H | P29084 | protein_coding | deleterious(0.03) | probably_damaging(0.931) | TCGA-AJ-A3BH-01 | Endometrium | uterine corpus endometrioid carcinoma | Female | Unknown | I/II | Unknown | Unknown | SD |
| GTF2E2 | SNV | Missense_Mutation | novel | c.49N>A | p.Leu17Ile | p.L17I | P29084 | protein_coding | tolerated(0.18) | possibly_damaging(0.492) | TCGA-AJ-A3EL-01 | Endometrium | uterine corpus endometrioid carcinoma | Female | <65 | I/II | Unknown | Unknown | SD |
| GTF2E2 | SNV | Missense_Mutation | novel | c.160A>C | p.Asn54His | p.N54H | P29084 | protein_coding | tolerated(0.12) | benign(0.336) | TCGA-AJ-A5DW-01 | Endometrium | uterine corpus endometrioid carcinoma | Female | <65 | I/II | Unknown | Unknown | SD |
| Page: 1 2 3 4 |
Top |
Related drugs of malignant transformation related genes |
| Identification of chemicals and drugs interact with genes involved in malignant transfromation |
| (DGIdb 4.0) |
| Entrez ID | Symbol | Category | Interaction Types | Drug Claim Name | Drug Name | PMIDs |
| Page: 1 |

Copyright 2023-Present -The University of Texas Health Science Center at Houston |