
|
|||||
|
 | |
| |
| |
| |
| |
| |
|
Gene: GTF2B |
Gene summary for GTF2B |
| Gene information | Species | Human | Gene symbol | GTF2B | Gene ID | 2959 |
| Gene name | general transcription factor IIB | |
| Gene Alias | TF2B | |
| Cytomap | 1p22.2 | |
| Gene Type | protein-coding | GO ID | GO:0001173 | UniProtAcc | Q00403 |
Top |
Malignant transformation analysis |
| Identification of the aberrant gene expression in precancerous and cancerous lesions by comparing the gene expression of stem-like cells in diseased tissues with normal stem cells |
| Entrez ID | Symbol | Replicates | Species | Organ | Tissue | Adj P-value | Log2FC | Malignancy |
| 2959 | GTF2B | LZE2T | Human | Esophagus | ESCC | 1.01e-02 | 1.28e-01 | 0.082 |
| 2959 | GTF2B | LZE4T | Human | Esophagus | ESCC | 1.25e-12 | 3.36e-01 | 0.0811 |
| 2959 | GTF2B | LZE5T | Human | Esophagus | ESCC | 8.09e-05 | 2.28e-01 | 0.0514 |
| 2959 | GTF2B | LZE7T | Human | Esophagus | ESCC | 1.21e-11 | 5.93e-01 | 0.0667 |
| 2959 | GTF2B | LZE8T | Human | Esophagus | ESCC | 3.01e-12 | 7.69e-01 | 0.067 |
| 2959 | GTF2B | LZE20T | Human | Esophagus | ESCC | 4.67e-07 | 3.47e-01 | 0.0662 |
| 2959 | GTF2B | LZE22D1 | Human | Esophagus | HGIN | 9.70e-03 | 2.23e-02 | 0.0595 |
| 2959 | GTF2B | LZE22T | Human | Esophagus | ESCC | 4.57e-02 | -1.24e-01 | 0.068 |
| 2959 | GTF2B | LZE24T | Human | Esophagus | ESCC | 5.13e-20 | 5.77e-01 | 0.0596 |
| 2959 | GTF2B | LZE21T | Human | Esophagus | ESCC | 4.55e-03 | 4.56e-01 | 0.0655 |
| 2959 | GTF2B | LZE6T | Human | Esophagus | ESCC | 3.04e-06 | 3.98e-01 | 0.0845 |
| 2959 | GTF2B | P1T-E | Human | Esophagus | ESCC | 4.02e-02 | 5.76e-01 | 0.0875 |
| 2959 | GTF2B | P2T-E | Human | Esophagus | ESCC | 5.84e-32 | 6.49e-01 | 0.1177 |
| 2959 | GTF2B | P4T-E | Human | Esophagus | ESCC | 4.39e-25 | 5.08e-01 | 0.1323 |
| 2959 | GTF2B | P5T-E | Human | Esophagus | ESCC | 1.59e-16 | 4.87e-01 | 0.1327 |
| 2959 | GTF2B | P8T-E | Human | Esophagus | ESCC | 1.09e-26 | 4.16e-01 | 0.0889 |
| 2959 | GTF2B | P9T-E | Human | Esophagus | ESCC | 2.27e-21 | 1.87e-01 | 0.1131 |
| 2959 | GTF2B | P10T-E | Human | Esophagus | ESCC | 3.02e-32 | 5.97e-01 | 0.116 |
| 2959 | GTF2B | P11T-E | Human | Esophagus | ESCC | 1.42e-13 | 7.30e-01 | 0.1426 |
| 2959 | GTF2B | P12T-E | Human | Esophagus | ESCC | 1.50e-75 | 2.43e+00 | 0.1122 |
| Page: 1 2 3 4 5 6 7 |
| Tissue | Expression Dynamics | Abbreviation |
| Esophagus | 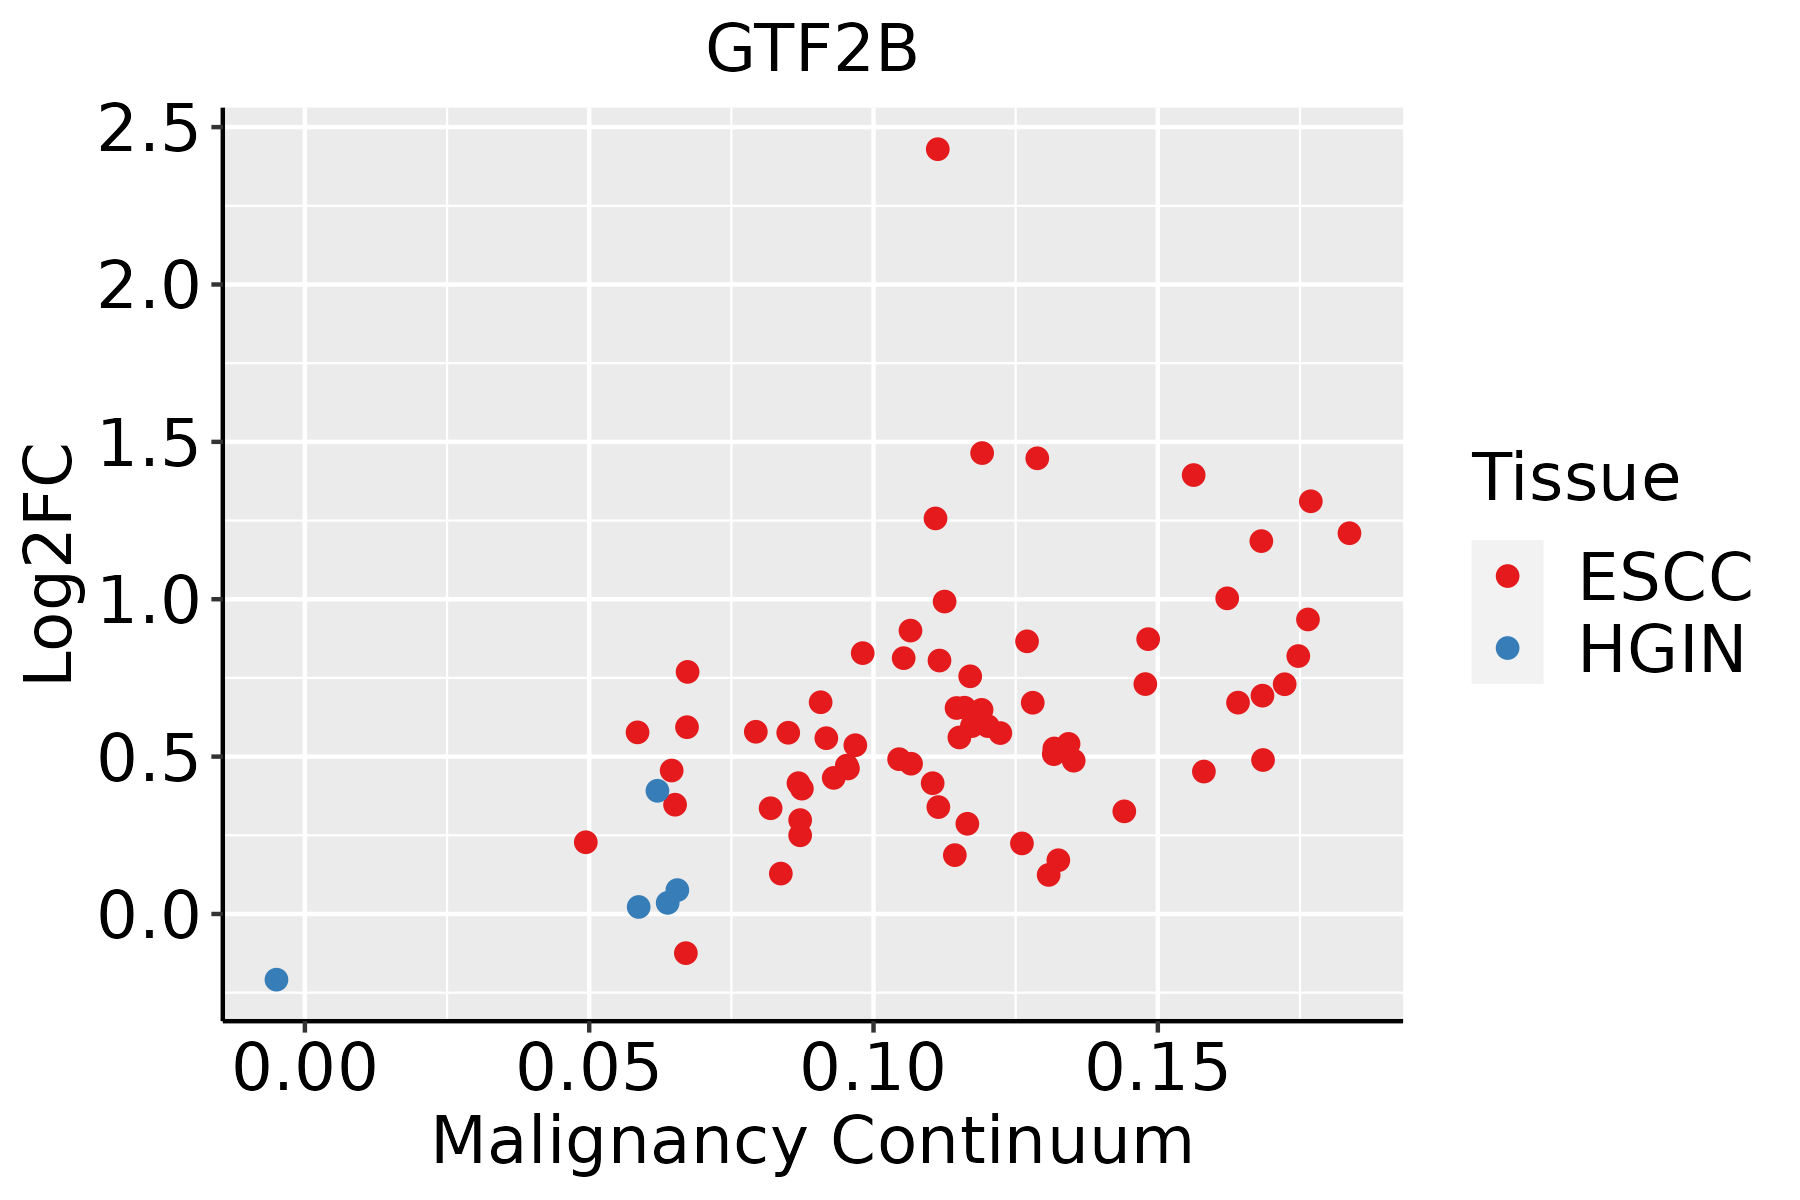 | ESCC: Esophageal squamous cell carcinoma |
| HGIN: High-grade intraepithelial neoplasias | ||
| LGIN: Low-grade intraepithelial neoplasias | ||
| Liver | 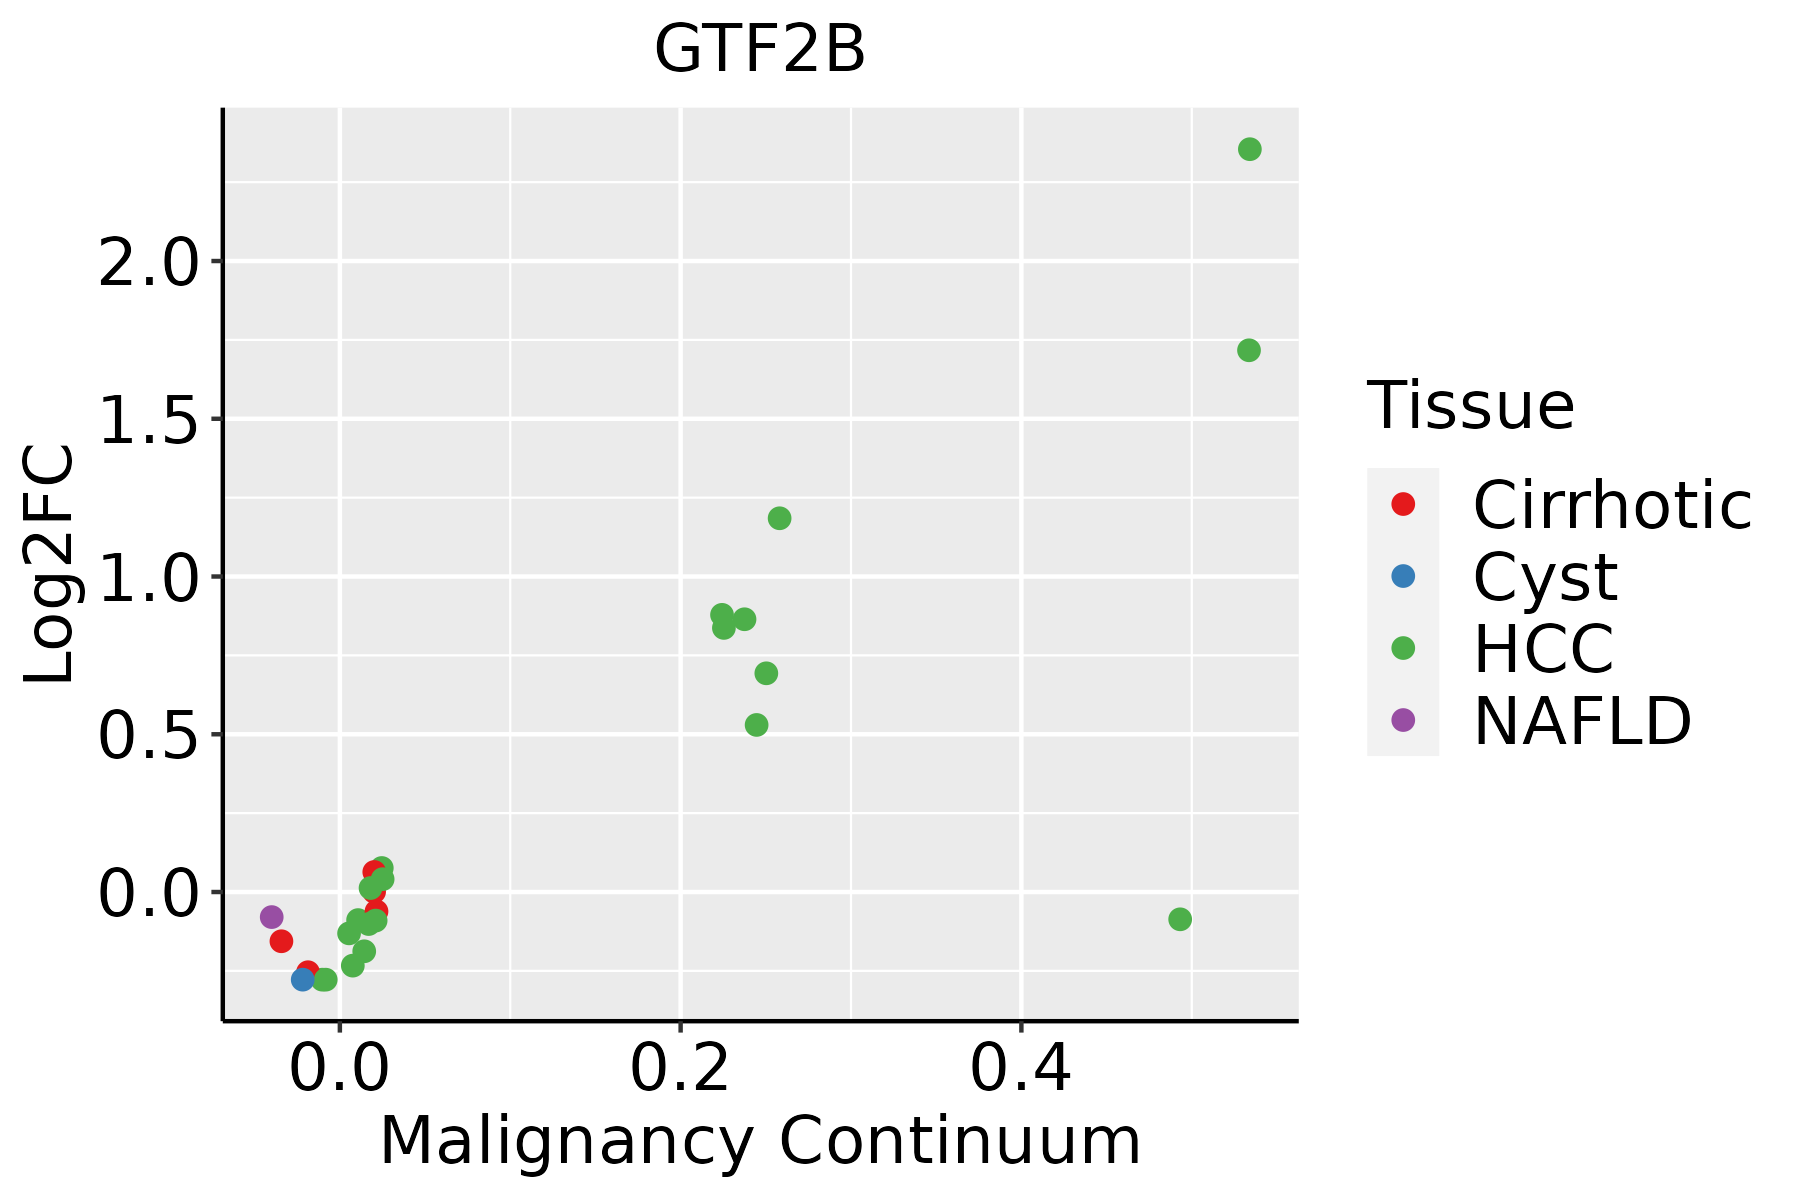 | HCC: Hepatocellular carcinoma |
| NAFLD: Non-alcoholic fatty liver disease | ||
| Oral Cavity | 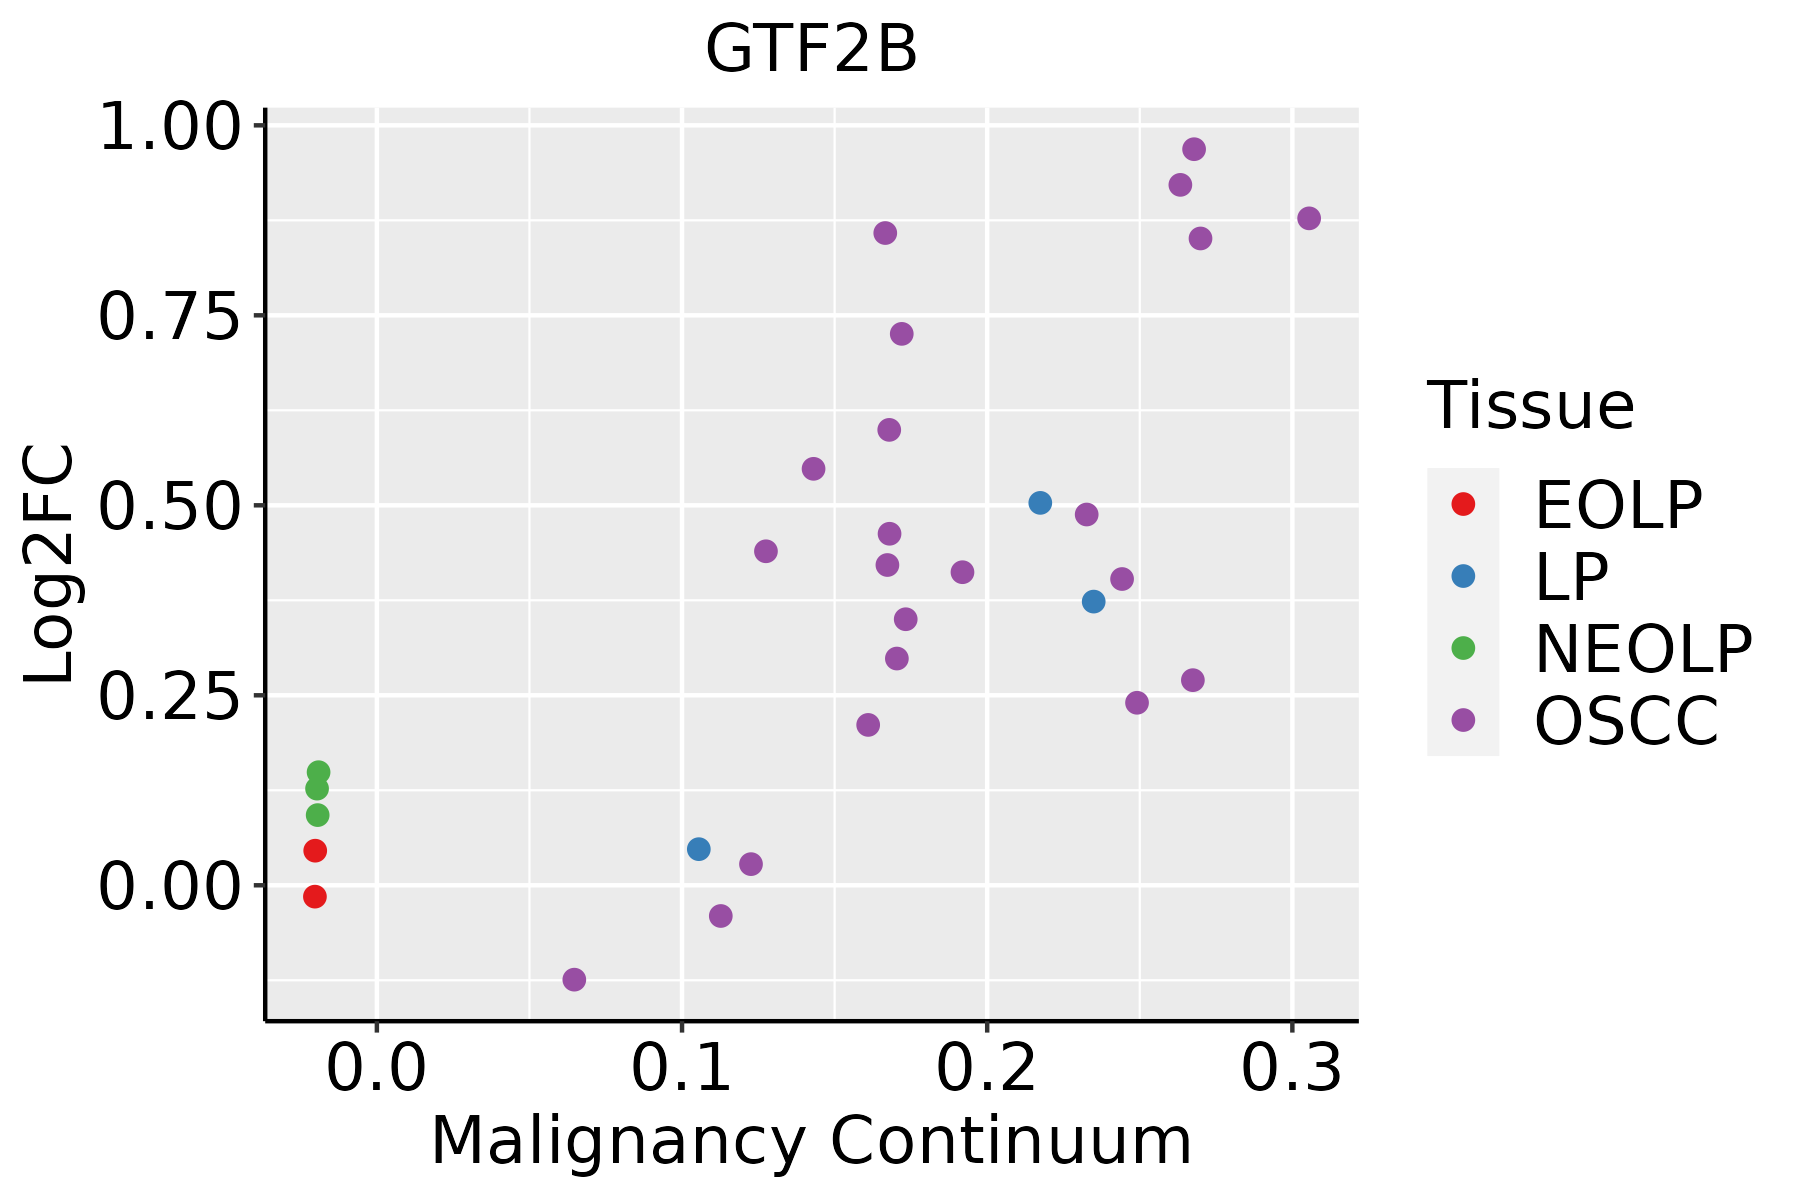 | EOLP: Erosive Oral lichen planus |
| LP: leukoplakia | ||
| NEOLP: Non-erosive oral lichen planus | ||
| OSCC: Oral squamous cell carcinoma | ||
| Prostate | 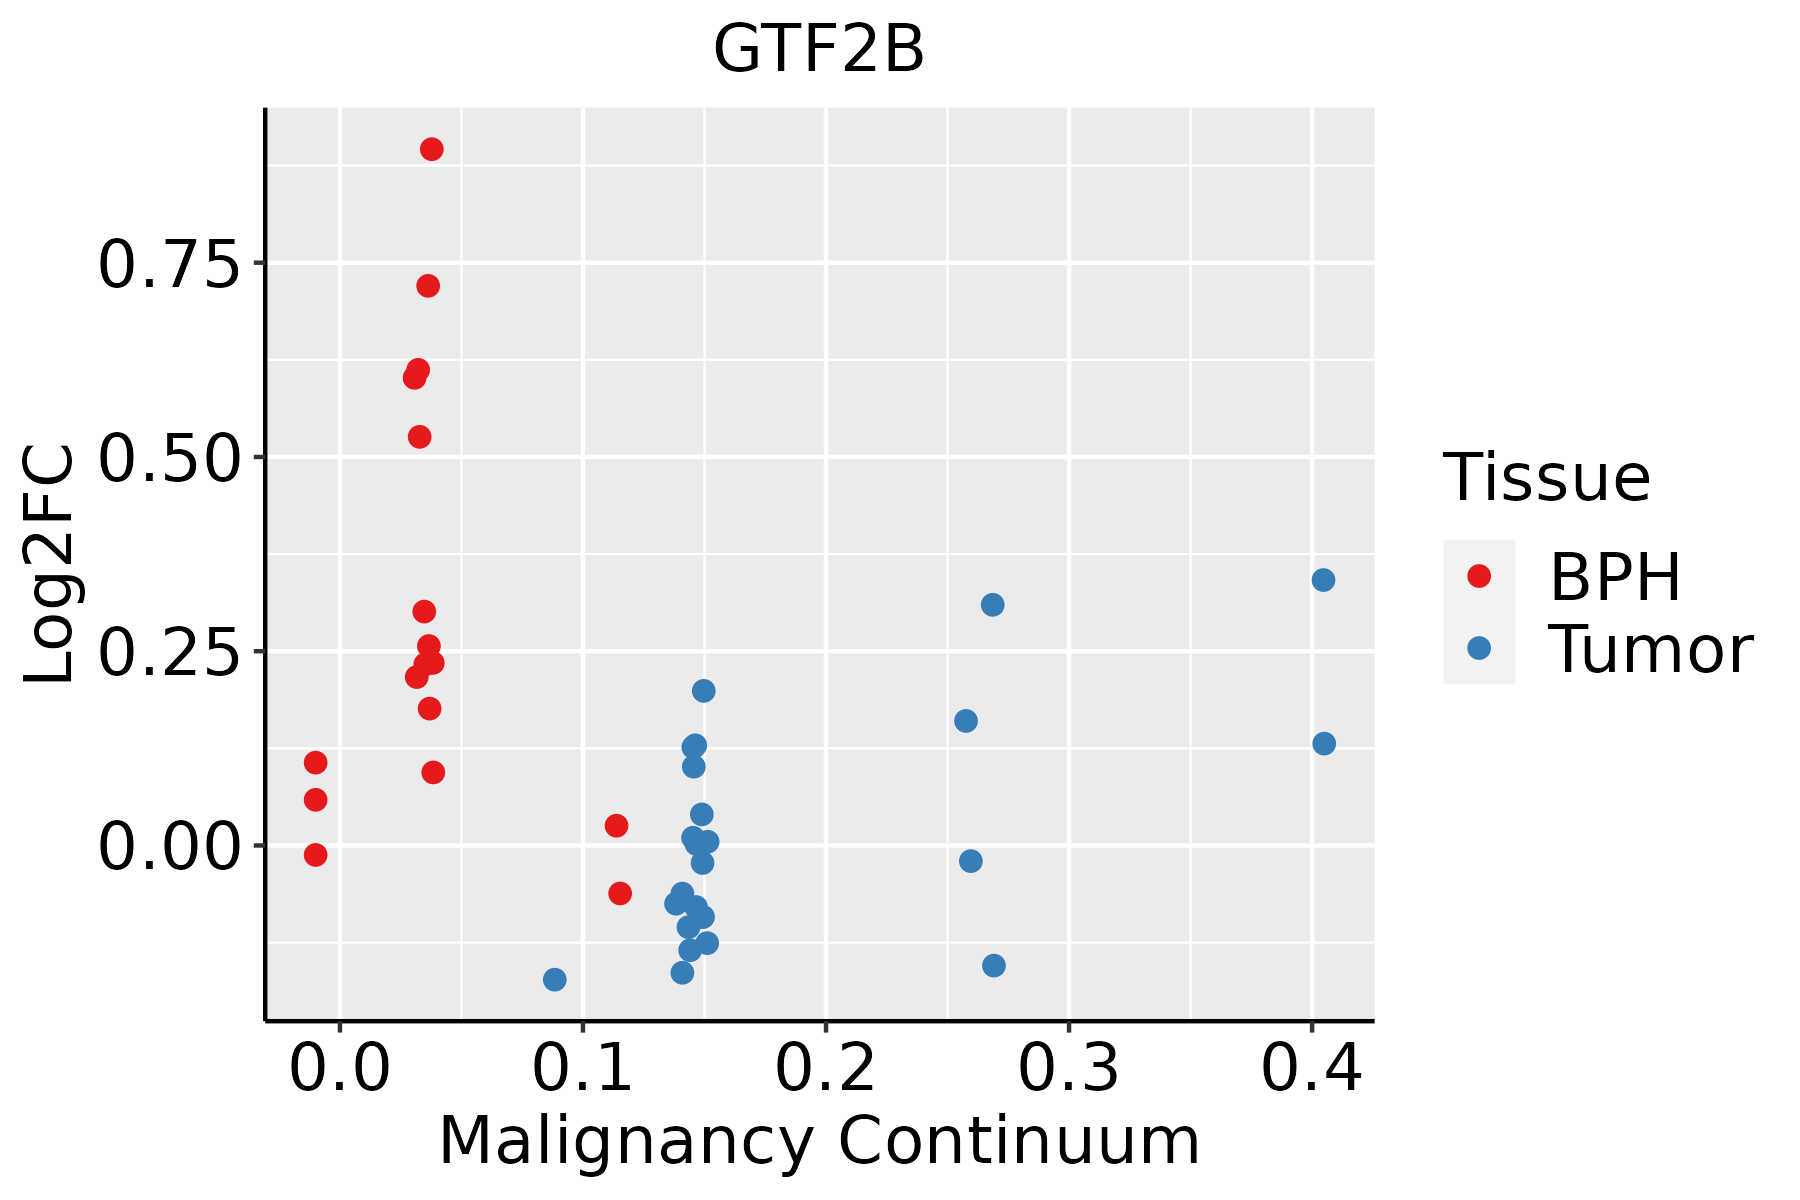 | BPH: Benign Prostatic Hyperplasia |
| Skin | 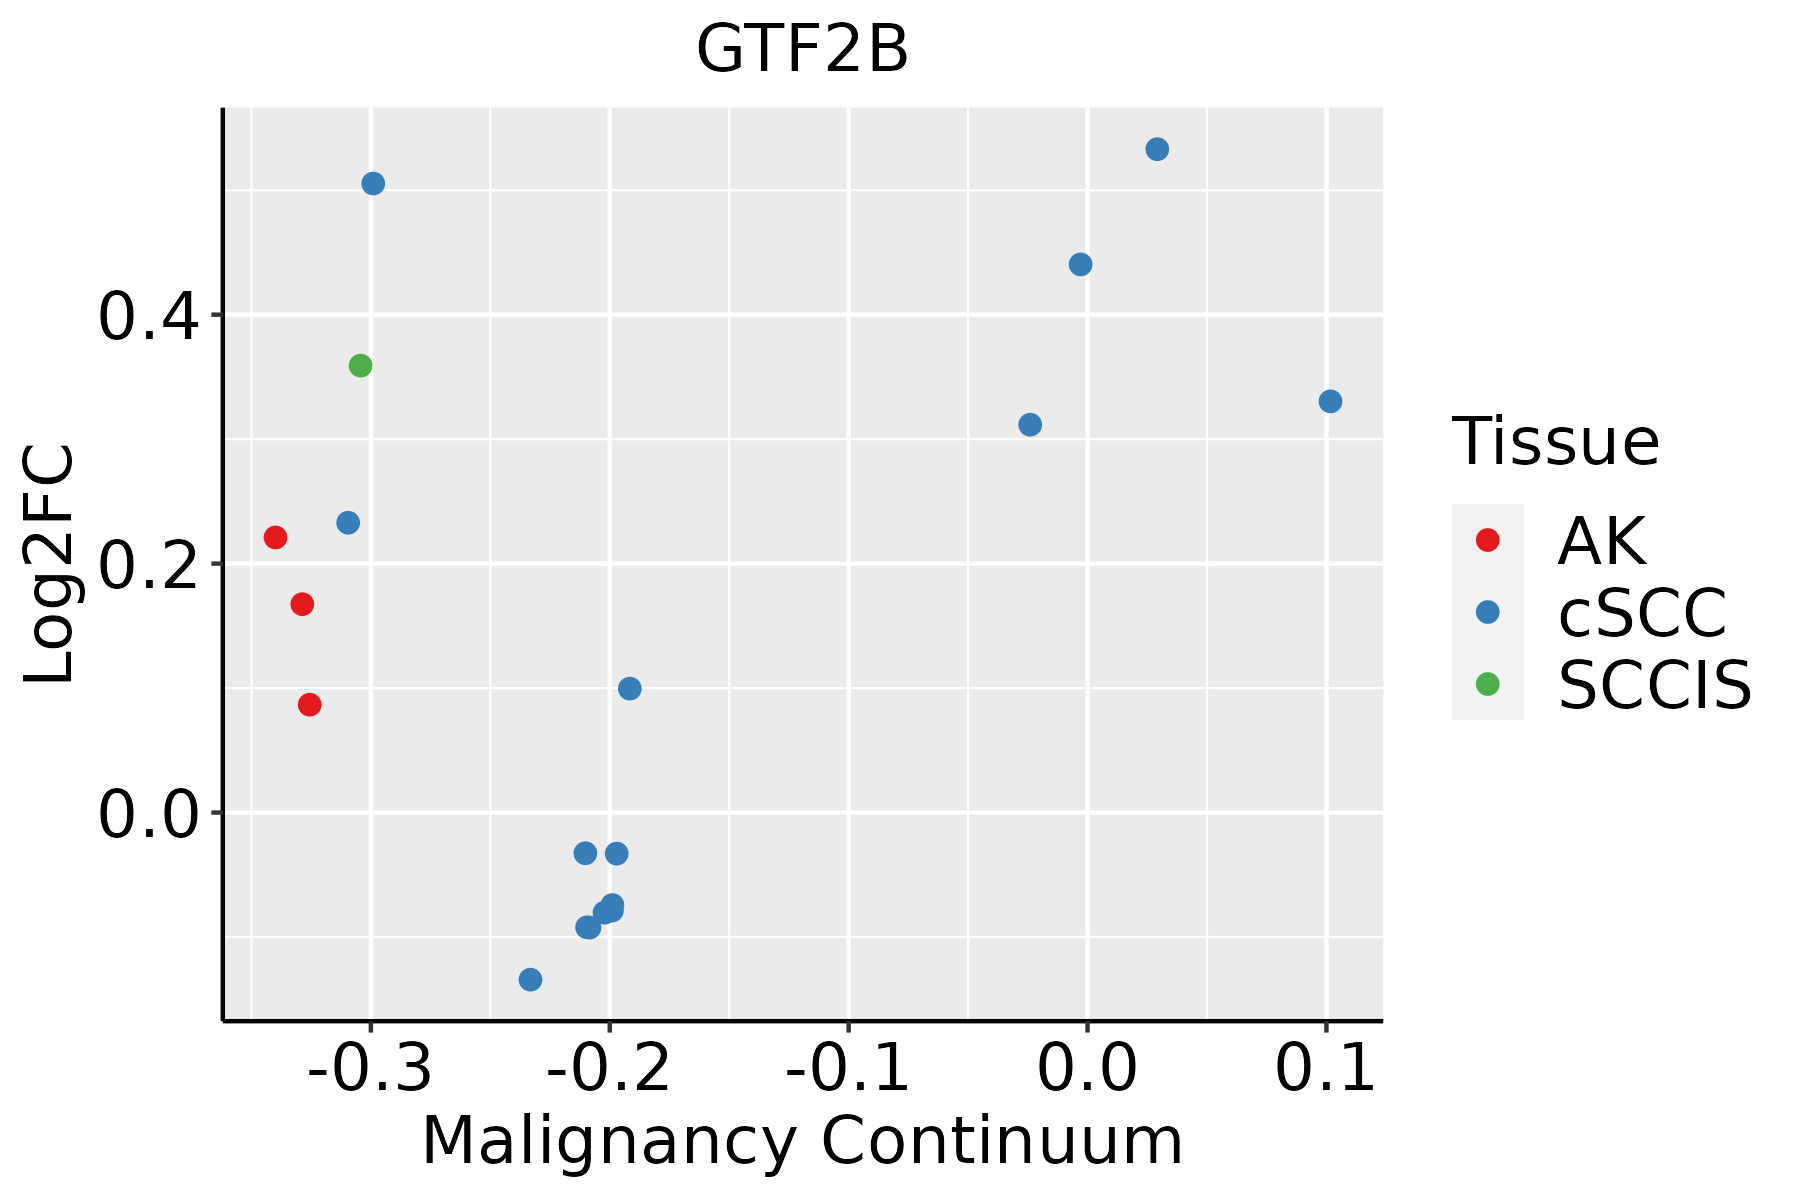 | AK: Actinic keratosis |
| cSCC: Cutaneous squamous cell carcinoma | ||
| SCCIS:squamous cell carcinoma in situ | ||
| Thyroid |  | ATC: Anaplastic thyroid cancer |
| HT: Hashimoto's thyroiditis | ||
| PTC: Papillary thyroid cancer |
| ∗log2FC in expression of this searched gene in stem-like cells from each diseased tissue sample relative to stem-like cells in normal samples in each tissue plotted against the malignancy continuum. Samples are colored based on if they are from different disease stage. |
Top |
Malignant transformation related pathway analysis |
| Find out the enriched GO biological processes and KEGG pathways involved in transition from healthy to precancer to cancer |
| Tissue | Disease Stage | Enriched GO biological Processes |
| Colorectum | AD |  |
| Colorectum | SER |  |
| Colorectum | MSS |  |
| Colorectum | MSI-H |  |
| Colorectum | FAP |  |
| ∗Top 15 enriched GO BP terms are showed in the bar plot of each disease state in each tissue. Each row represents a significant GO biological process which is colored according to the -log10(p.adjust). |
| Page: 1 2 3 4 5 6 7 8 9 |
| GO ID | Tissue | Disease Stage | Description | Gene Ratio | Bg Ratio | pvalue | p.adjust | Count |
| GO:001603227 | Esophagus | HGIN | viral process | 118/2587 | 415/18723 | 3.01e-15 | 6.22e-13 | 118 |
| GO:00182057 | Esophagus | HGIN | peptidyl-lysine modification | 88/2587 | 376/18723 | 2.99e-07 | 1.39e-05 | 88 |
| GO:005109825 | Esophagus | HGIN | regulation of binding | 78/2587 | 363/18723 | 3.73e-05 | 9.30e-04 | 78 |
| GO:001908016 | Esophagus | HGIN | viral gene expression | 28/2587 | 94/18723 | 4.52e-05 | 1.09e-03 | 28 |
| GO:005109925 | Esophagus | HGIN | positive regulation of binding | 42/2587 | 173/18723 | 1.51e-04 | 2.97e-03 | 42 |
| GO:00165708 | Esophagus | HGIN | histone modification | 92/2587 | 463/18723 | 1.70e-04 | 3.30e-03 | 92 |
| GO:00064735 | Esophagus | HGIN | protein acetylation | 45/2587 | 201/18723 | 6.17e-04 | 8.58e-03 | 45 |
| GO:00183945 | Esophagus | HGIN | peptidyl-lysine acetylation | 39/2587 | 169/18723 | 7.46e-04 | 9.90e-03 | 39 |
| GO:00435435 | Esophagus | HGIN | protein acylation | 51/2587 | 243/18723 | 1.33e-03 | 1.57e-02 | 51 |
| GO:00064755 | Esophagus | HGIN | internal protein amino acid acetylation | 36/2587 | 160/18723 | 1.87e-03 | 2.01e-02 | 36 |
| GO:00190834 | Esophagus | HGIN | viral transcription | 15/2587 | 50/18723 | 2.35e-03 | 2.39e-02 | 15 |
| GO:005110125 | Esophagus | HGIN | regulation of DNA binding | 28/2587 | 118/18723 | 2.54e-03 | 2.51e-02 | 28 |
| GO:00183935 | Esophagus | HGIN | internal peptidyl-lysine acetylation | 35/2587 | 158/18723 | 2.82e-03 | 2.75e-02 | 35 |
| GO:00063523 | Esophagus | HGIN | DNA-templated transcription, initiation | 30/2587 | 130/18723 | 2.86e-03 | 2.79e-02 | 30 |
| GO:004338818 | Esophagus | HGIN | positive regulation of DNA binding | 16/2587 | 56/18723 | 2.96e-03 | 2.86e-02 | 16 |
| GO:0016032111 | Esophagus | ESCC | viral process | 301/8552 | 415/18723 | 3.34e-29 | 1.32e-26 | 301 |
| GO:001657015 | Esophagus | ESCC | histone modification | 323/8552 | 463/18723 | 2.61e-26 | 7.88e-24 | 323 |
| GO:001820514 | Esophagus | ESCC | peptidyl-lysine modification | 259/8552 | 376/18723 | 3.90e-20 | 5.26e-18 | 259 |
| GO:0051098111 | Esophagus | ESCC | regulation of binding | 251/8552 | 363/18723 | 6.73e-20 | 8.46e-18 | 251 |
| GO:001908017 | Esophagus | ESCC | viral gene expression | 80/8552 | 94/18723 | 2.04e-15 | 1.28e-13 | 80 |
| Page: 1 2 3 4 5 6 7 8 9 10 11 12 |
| Pathway ID | Tissue | Disease Stage | Description | Gene Ratio | Bg Ratio | pvalue | p.adjust | qvalue | Count |
| hsa0501727 | Esophagus | HGIN | Spinocerebellar ataxia | 43/1383 | 143/8465 | 2.68e-05 | 3.64e-04 | 2.89e-04 | 43 |
| hsa052039 | Esophagus | HGIN | Viral carcinogenesis | 53/1383 | 204/8465 | 2.58e-04 | 2.71e-03 | 2.15e-03 | 53 |
| hsa05017112 | Esophagus | HGIN | Spinocerebellar ataxia | 43/1383 | 143/8465 | 2.68e-05 | 3.64e-04 | 2.89e-04 | 43 |
| hsa0520315 | Esophagus | HGIN | Viral carcinogenesis | 53/1383 | 204/8465 | 2.58e-04 | 2.71e-03 | 2.15e-03 | 53 |
| hsa0520325 | Esophagus | ESCC | Viral carcinogenesis | 137/4205 | 204/8465 | 2.47e-07 | 1.88e-06 | 9.62e-07 | 137 |
| hsa0501728 | Esophagus | ESCC | Spinocerebellar ataxia | 94/4205 | 143/8465 | 6.77e-05 | 2.90e-04 | 1.48e-04 | 94 |
| hsa0520335 | Esophagus | ESCC | Viral carcinogenesis | 137/4205 | 204/8465 | 2.47e-07 | 1.88e-06 | 9.62e-07 | 137 |
| hsa0501736 | Esophagus | ESCC | Spinocerebellar ataxia | 94/4205 | 143/8465 | 6.77e-05 | 2.90e-04 | 1.48e-04 | 94 |
| hsa0501710 | Liver | Cirrhotic | Spinocerebellar ataxia | 66/2530 | 143/8465 | 2.58e-05 | 2.15e-04 | 1.32e-04 | 66 |
| hsa05203 | Liver | Cirrhotic | Viral carcinogenesis | 76/2530 | 204/8465 | 1.34e-02 | 4.20e-02 | 2.59e-02 | 76 |
| hsa0501711 | Liver | Cirrhotic | Spinocerebellar ataxia | 66/2530 | 143/8465 | 2.58e-05 | 2.15e-04 | 1.32e-04 | 66 |
| hsa052031 | Liver | Cirrhotic | Viral carcinogenesis | 76/2530 | 204/8465 | 1.34e-02 | 4.20e-02 | 2.59e-02 | 76 |
| hsa0501721 | Liver | HCC | Spinocerebellar ataxia | 92/4020 | 143/8465 | 3.20e-05 | 1.88e-04 | 1.04e-04 | 92 |
| hsa052032 | Liver | HCC | Viral carcinogenesis | 117/4020 | 204/8465 | 2.68e-03 | 8.98e-03 | 5.00e-03 | 117 |
| hsa0501731 | Liver | HCC | Spinocerebellar ataxia | 92/4020 | 143/8465 | 3.20e-05 | 1.88e-04 | 1.04e-04 | 92 |
| hsa052033 | Liver | HCC | Viral carcinogenesis | 117/4020 | 204/8465 | 2.68e-03 | 8.98e-03 | 5.00e-03 | 117 |
| hsa052038 | Oral cavity | OSCC | Viral carcinogenesis | 124/3704 | 204/8465 | 5.57e-07 | 3.28e-06 | 1.67e-06 | 124 |
| hsa0501725 | Oral cavity | OSCC | Spinocerebellar ataxia | 86/3704 | 143/8465 | 5.21e-05 | 2.08e-04 | 1.06e-04 | 86 |
| hsa03022 | Oral cavity | OSCC | Basal transcription factors | 28/3704 | 45/8465 | 9.53e-03 | 2.11e-02 | 1.08e-02 | 28 |
| hsa0520314 | Oral cavity | OSCC | Viral carcinogenesis | 124/3704 | 204/8465 | 5.57e-07 | 3.28e-06 | 1.67e-06 | 124 |
| Page: 1 2 |
Top |
Cell-cell communication analysis |
| Identification of potential cell-cell interactions between two cell types and their ligand-receptor pairs for different disease states |
| Ligand | Receptor | LRpair | Pathway | Tissue | Disease Stage |
| Page: 1 |
Top |
Single-cell gene regulatory network inference analysis |
| Find out the significant the regulons (TFs) and the target genes of each regulon across cell types for different disease states |
| TF | Cell Type | Tissue | Disease Stage | Target Gene | RSS | Regulon Activity |
| GTF2B | CD8TRM | Cervix | N_HPV | ANKRD54,DBP,BPGM, etc. | 2.89e-01 |  |
| GTF2B | TH17 | Colorectum | Healthy | GPR155,CCDC66,LINC00894, etc. | 3.72e-02 |  |
| GTF2B | STM | Esophagus | LGIN | LMO4,SPTSSA,RPL5, etc. | 7.05e-01 |  |
| GTF2B | MAIT | Oral cavity | NEOLP | CXCR4,KIAA0226L,DNAJA1, etc. | 2.12e-01 |  |
| GTF2B | CD4TN | Pancreas | PDAC | CXCR4,NFE2L3,DDX5, etc. | 1.98e-01 |  |
| GTF2B | CD8TEX | Pancreas | PDAC | CXCR4,NFE2L3,DDX5, etc. | 9.99e-02 | |
| GTF2B | PARI | Stomach | WIM | TIAM1,TTR,NR2C1, etc. | 1.54e-02 |  |
| ∗The dot plots of a searched regulon are shown for all cell subpopulations in each disease state of each tissue based on the regulon specific score inferred using pySCENIC and by calculating the average expression. |
| Page: 1 |
Top |
Somatic mutation of malignant transformation related genes |
| Annotation of somatic variants for genes involved in malignant transformation |
| Hugo Symbol | Variant Class | Variant Classification | dbSNP RS | HGVSc | HGVSp | HGVSp Short | SWISSPROT | BIOTYPE | SIFT | PolyPhen | Tumor Sample Barcode | Tissue | Histology | Sex | Age | Stage | Therapy Types | Drugs | Outcome |
| GTF2B | SNV | Missense_Mutation | rs144944840 | c.395G>A | p.Arg132Gln | p.R132Q | Q00403 | protein_coding | tolerated(0.35) | benign(0.015) | TCGA-AN-A046-01 | Breast | breast invasive carcinoma | Female | >=65 | I/II | Unknown | Unknown | SD |
| GTF2B | insertion | Frame_Shift_Ins | novel | c.354_355insCTCCTGATCATTTTGAATACTCT | p.Lys119LeufsTer24 | p.K119Lfs*24 | Q00403 | protein_coding | TCGA-AN-A0FS-01 | Breast | breast invasive carcinoma | Female | <65 | I/II | Unknown | Unknown | SD | ||
| GTF2B | SNV | Missense_Mutation | c.578G>A | p.Arg193Gln | p.R193Q | Q00403 | protein_coding | tolerated(0.07) | probably_damaging(0.967) | TCGA-AA-3510-01 | Colorectum | colon adenocarcinoma | Male | >=65 | I/II | Unknown | Unknown | SD | |
| GTF2B | SNV | Missense_Mutation | rs760691499 | c.884N>A | p.Arg295Gln | p.R295Q | Q00403 | protein_coding | tolerated(0.05) | benign(0.039) | TCGA-AA-3984-01 | Colorectum | colon adenocarcinoma | Female | <65 | I/II | Unknown | Unknown | SD |
| GTF2B | SNV | Missense_Mutation | rs144944840 | c.395G>A | p.Arg132Gln | p.R132Q | Q00403 | protein_coding | tolerated(0.35) | benign(0.015) | TCGA-AZ-4315-01 | Colorectum | colon adenocarcinoma | Male | <65 | I/II | Unknown | Unknown | SD |
| GTF2B | SNV | Missense_Mutation | c.146N>T | p.Gly49Val | p.G49V | Q00403 | protein_coding | deleterious(0.02) | probably_damaging(0.978) | TCGA-D5-6928-01 | Colorectum | colon adenocarcinoma | Male | >=65 | I/II | Unknown | Unknown | SD | |
| GTF2B | SNV | Missense_Mutation | novel | c.310C>T | p.Arg104Trp | p.R104W | Q00403 | protein_coding | deleterious(0) | probably_damaging(0.963) | TCGA-F5-6814-01 | Colorectum | rectum adenocarcinoma | Male | <65 | I/II | Unknown | Unknown | SD |
| GTF2B | SNV | Missense_Mutation | novel | c.158N>A | p.Arg53Gln | p.R53Q | Q00403 | protein_coding | deleterious(0.02) | probably_damaging(0.997) | TCGA-A5-A0G1-01 | Endometrium | uterine corpus endometrioid carcinoma | Female | >=65 | I/II | Unknown | Unknown | SD |
| GTF2B | SNV | Missense_Mutation | novel | c.614N>A | p.Ser205Asn | p.S205N | Q00403 | protein_coding | tolerated(0.39) | benign(0) | TCGA-A5-A0GI-01 | Endometrium | uterine corpus endometrioid carcinoma | Female | <65 | I/II | Unknown | Unknown | SD |
| GTF2B | SNV | Missense_Mutation | c.862N>C | p.Ser288Pro | p.S288P | Q00403 | protein_coding | deleterious(0.01) | possibly_damaging(0.884) | TCGA-A5-A0VP-01 | Endometrium | uterine corpus endometrioid carcinoma | Female | >=65 | I/II | Unknown | Unknown | SD |
| Page: 1 2 3 4 |
Top |
Related drugs of malignant transformation related genes |
| Identification of chemicals and drugs interact with genes involved in malignant transfromation |
| (DGIdb 4.0) |
| Entrez ID | Symbol | Category | Interaction Types | Drug Claim Name | Drug Name | PMIDs |
| 2959 | GTF2B | TRANSCRIPTION FACTOR | VITAMIN D | 9013769,7876247 | ||
| 2959 | GTF2B | TRANSCRIPTION FACTOR | PC4 | 8617240 | ||
| 2959 | GTF2B | TRANSCRIPTION FACTOR | STEROID HORMONE | 1517211 |
| Page: 1 |

Copyright 2023-Present -The University of Texas Health Science Center at Houston |