
|
|||||
|
 | |
| |
| |
| |
| |
| |
|
Gene: GTF2A2 |
Gene summary for GTF2A2 |
| Gene information | Species | Human | Gene symbol | GTF2A2 | Gene ID | 2958 |
| Gene name | general transcription factor IIA subunit 2 | |
| Gene Alias | HsT18745 | |
| Cytomap | 15q22.2 | |
| Gene Type | protein-coding | GO ID | GO:0006139 | UniProtAcc | A0A024R5Z5 |
Top |
Malignant transformation analysis |
| Identification of the aberrant gene expression in precancerous and cancerous lesions by comparing the gene expression of stem-like cells in diseased tissues with normal stem cells |
| Entrez ID | Symbol | Replicates | Species | Organ | Tissue | Adj P-value | Log2FC | Malignancy |
| 2958 | GTF2A2 | AEH-subject1 | Human | Endometrium | AEH | 4.36e-17 | -3.95e-01 | -0.3059 |
| 2958 | GTF2A2 | AEH-subject2 | Human | Endometrium | AEH | 7.00e-13 | -3.68e-01 | -0.2525 |
| 2958 | GTF2A2 | AEH-subject3 | Human | Endometrium | AEH | 4.70e-19 | -2.28e-01 | -0.2576 |
| 2958 | GTF2A2 | AEH-subject4 | Human | Endometrium | AEH | 4.96e-12 | -3.37e-01 | -0.2657 |
| 2958 | GTF2A2 | AEH-subject5 | Human | Endometrium | AEH | 1.69e-12 | -3.24e-01 | -0.2953 |
| 2958 | GTF2A2 | EEC-subject1 | Human | Endometrium | EEC | 2.92e-13 | -3.26e-01 | -0.2682 |
| 2958 | GTF2A2 | EEC-subject2 | Human | Endometrium | EEC | 2.08e-17 | -4.38e-01 | -0.2607 |
| 2958 | GTF2A2 | EEC-subject3 | Human | Endometrium | EEC | 3.44e-37 | -3.92e-01 | -0.2525 |
| 2958 | GTF2A2 | EEC-subject4 | Human | Endometrium | EEC | 7.83e-06 | -1.87e-01 | -0.2571 |
| 2958 | GTF2A2 | EEC-subject5 | Human | Endometrium | EEC | 4.26e-11 | -1.25e-01 | -0.249 |
| 2958 | GTF2A2 | GSM5276934 | Human | Endometrium | EEC | 2.21e-05 | -1.36e-01 | -0.0913 |
| 2958 | GTF2A2 | GSM5276937 | Human | Endometrium | EEC | 3.51e-02 | 1.68e-01 | -0.0897 |
| 2958 | GTF2A2 | GSM6177620_NYU_UCEC1_lib1_lib1 | Human | Endometrium | EEC | 5.68e-31 | -2.55e-01 | -0.1869 |
| 2958 | GTF2A2 | GSM6177620_NYU_UCEC1_lib2_lib2 | Human | Endometrium | EEC | 1.19e-31 | -2.94e-01 | -0.1875 |
| 2958 | GTF2A2 | GSM6177620_NYU_UCEC1_lib3_lib3 | Human | Endometrium | EEC | 2.37e-35 | -2.05e-01 | -0.1883 |
| 2958 | GTF2A2 | GSM6177621_NYU_UCEC2_lib1_lib1 | Human | Endometrium | EEC | 2.56e-37 | -2.45e-01 | -0.1934 |
| 2958 | GTF2A2 | GSM6177622_NYU_UCEC3_lib1_lib1 | Human | Endometrium | EEC | 4.73e-48 | -3.24e-01 | -0.1917 |
| 2958 | GTF2A2 | GSM6177622_NYU_UCEC3_lib2_lib2 | Human | Endometrium | EEC | 1.42e-46 | -3.87e-01 | -0.1916 |
| 2958 | GTF2A2 | GSM6177623_NYU_UCEC3_Vis | Human | Endometrium | EEC | 6.10e-07 | -2.16e-01 | -0.1269 |
| 2958 | GTF2A2 | LZE3D | Human | Esophagus | HGIN | 1.98e-02 | 2.73e-01 | 0.0668 |
| Page: 1 2 3 4 5 6 7 8 9 |
| Tissue | Expression Dynamics | Abbreviation |
| Endometrium | 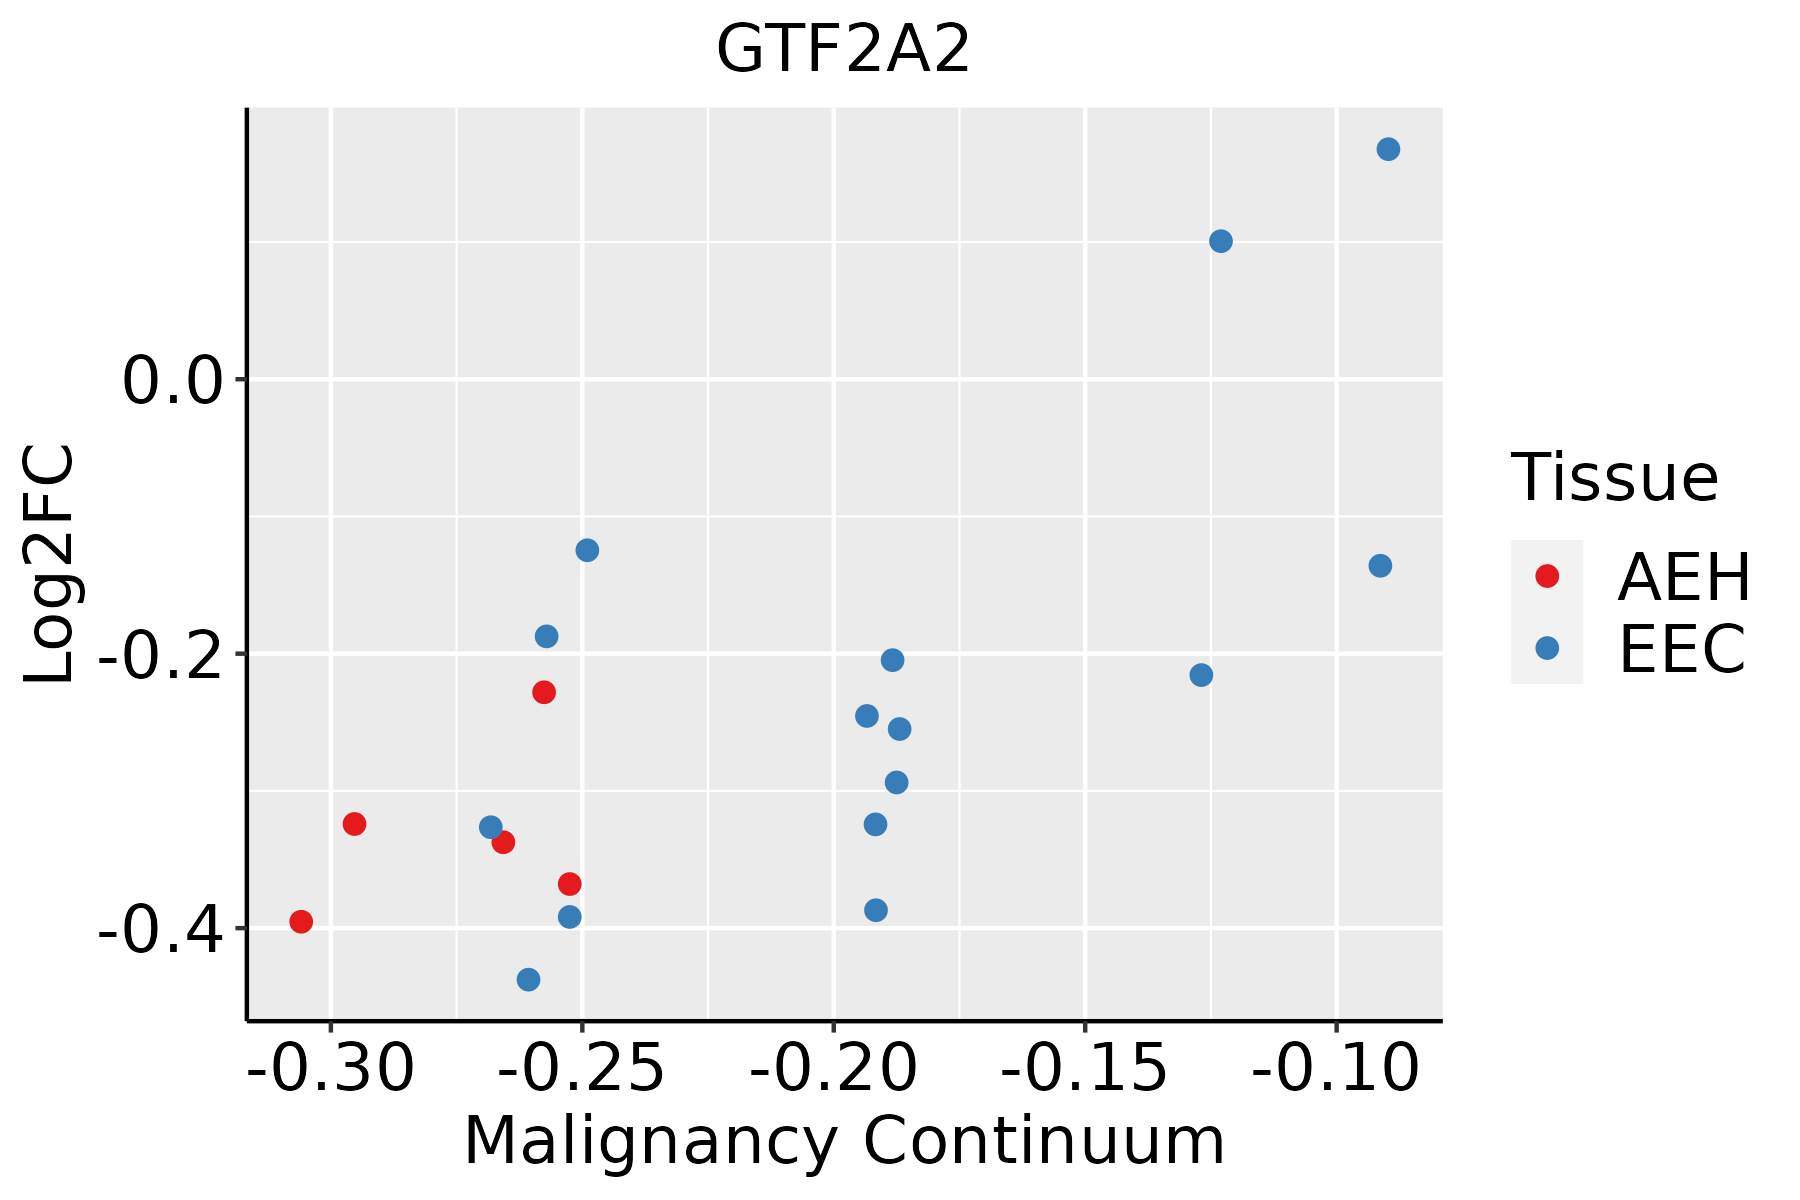 | AEH: Atypical endometrial hyperplasia |
| EEC: Endometrioid Cancer | ||
| Esophagus |  | ESCC: Esophageal squamous cell carcinoma |
| HGIN: High-grade intraepithelial neoplasias | ||
| LGIN: Low-grade intraepithelial neoplasias | ||
| Liver |  | HCC: Hepatocellular carcinoma |
| NAFLD: Non-alcoholic fatty liver disease | ||
| Oral Cavity | 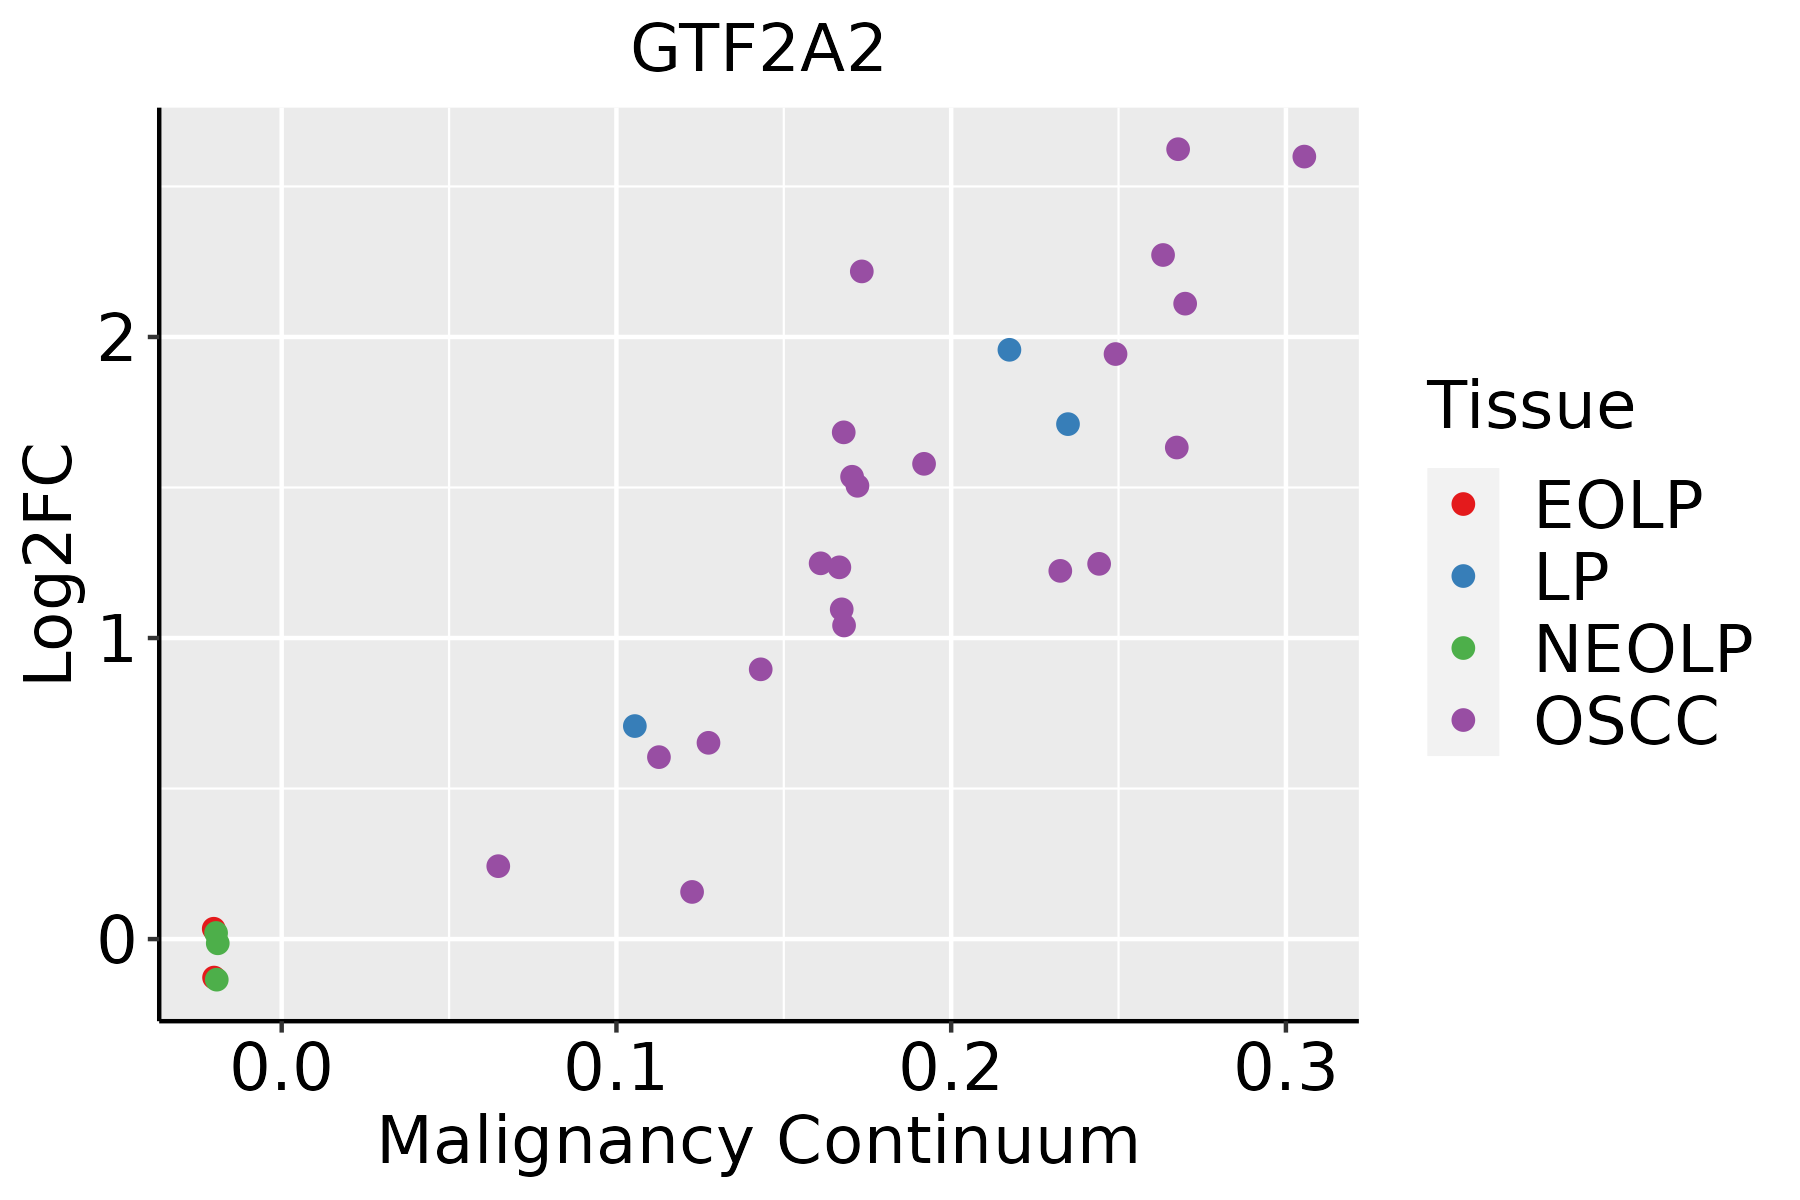 | EOLP: Erosive Oral lichen planus |
| LP: leukoplakia | ||
| NEOLP: Non-erosive oral lichen planus | ||
| OSCC: Oral squamous cell carcinoma | ||
| Prostate | 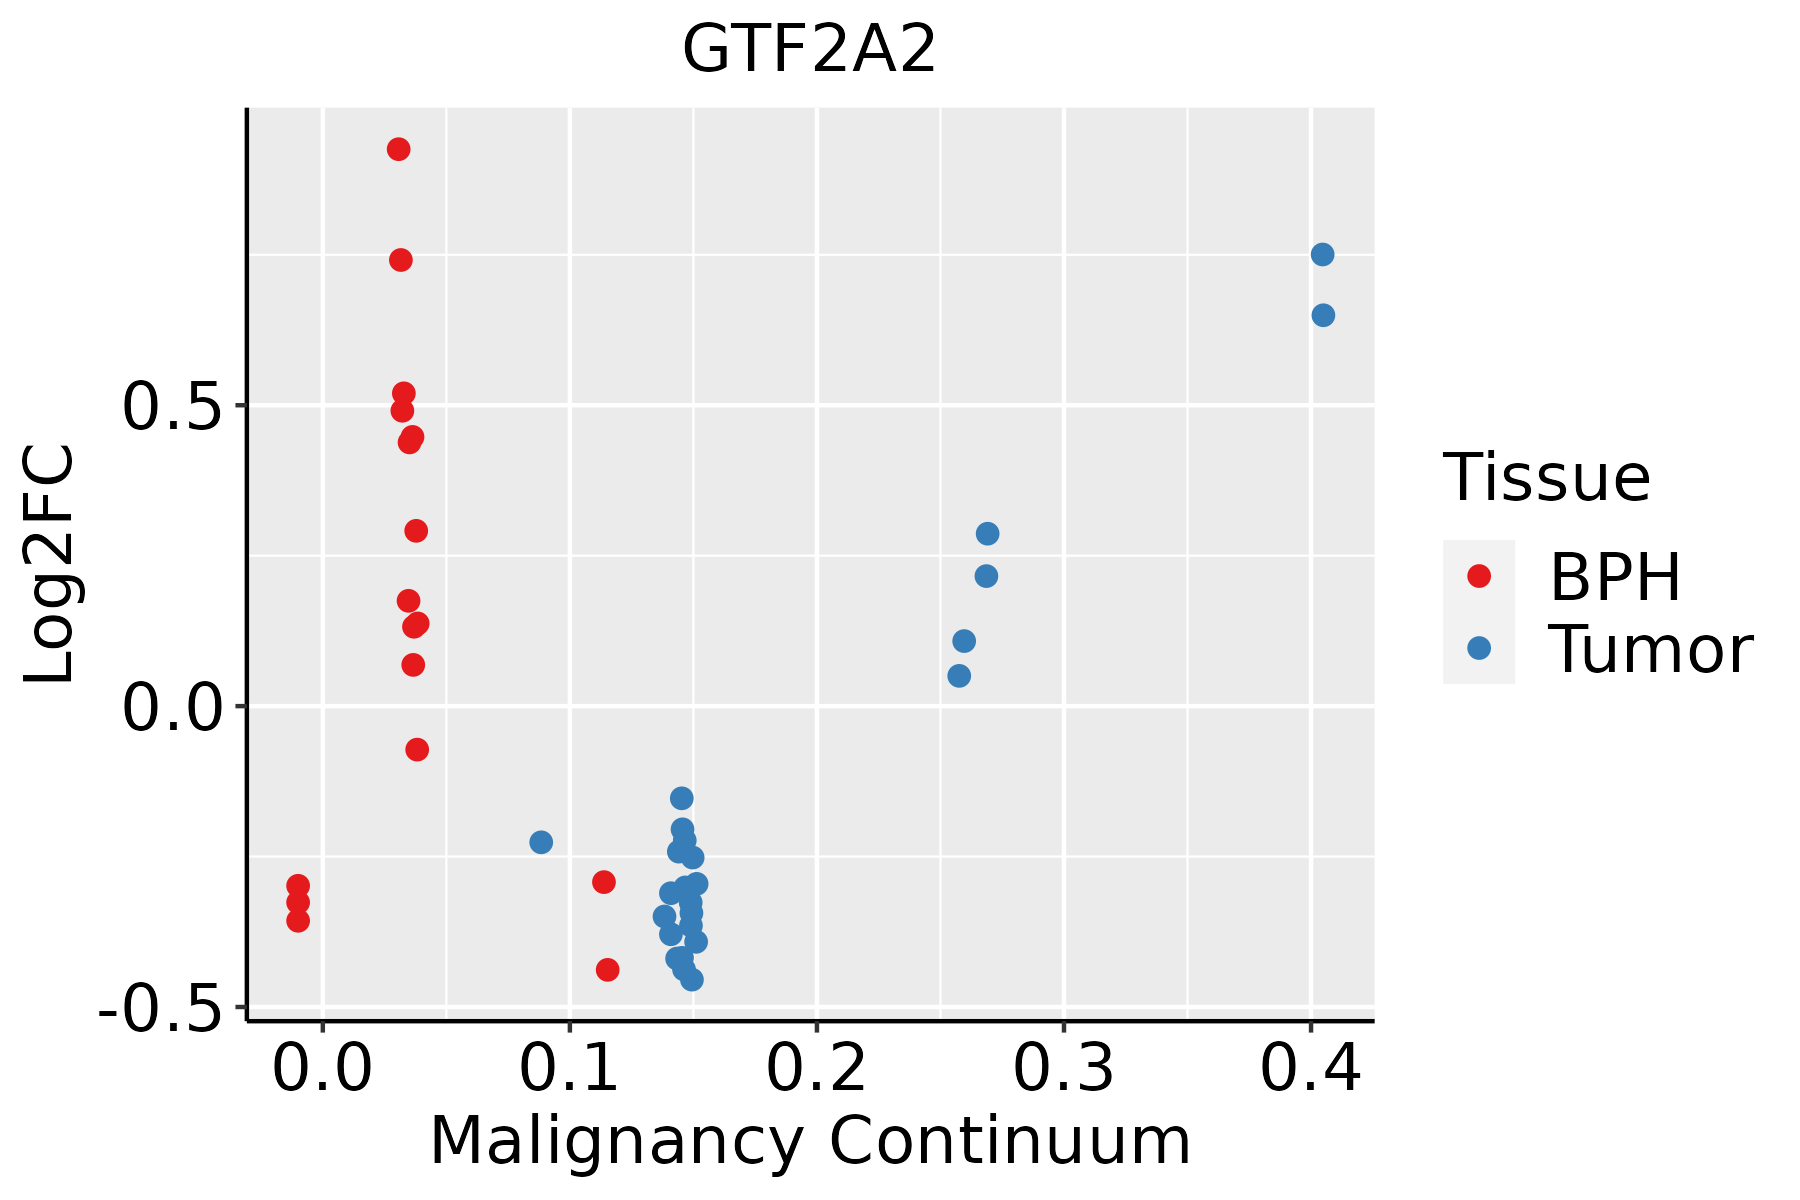 | BPH: Benign Prostatic Hyperplasia |
| Skin |  | AK: Actinic keratosis |
| cSCC: Cutaneous squamous cell carcinoma | ||
| SCCIS:squamous cell carcinoma in situ | ||
| Thyroid | 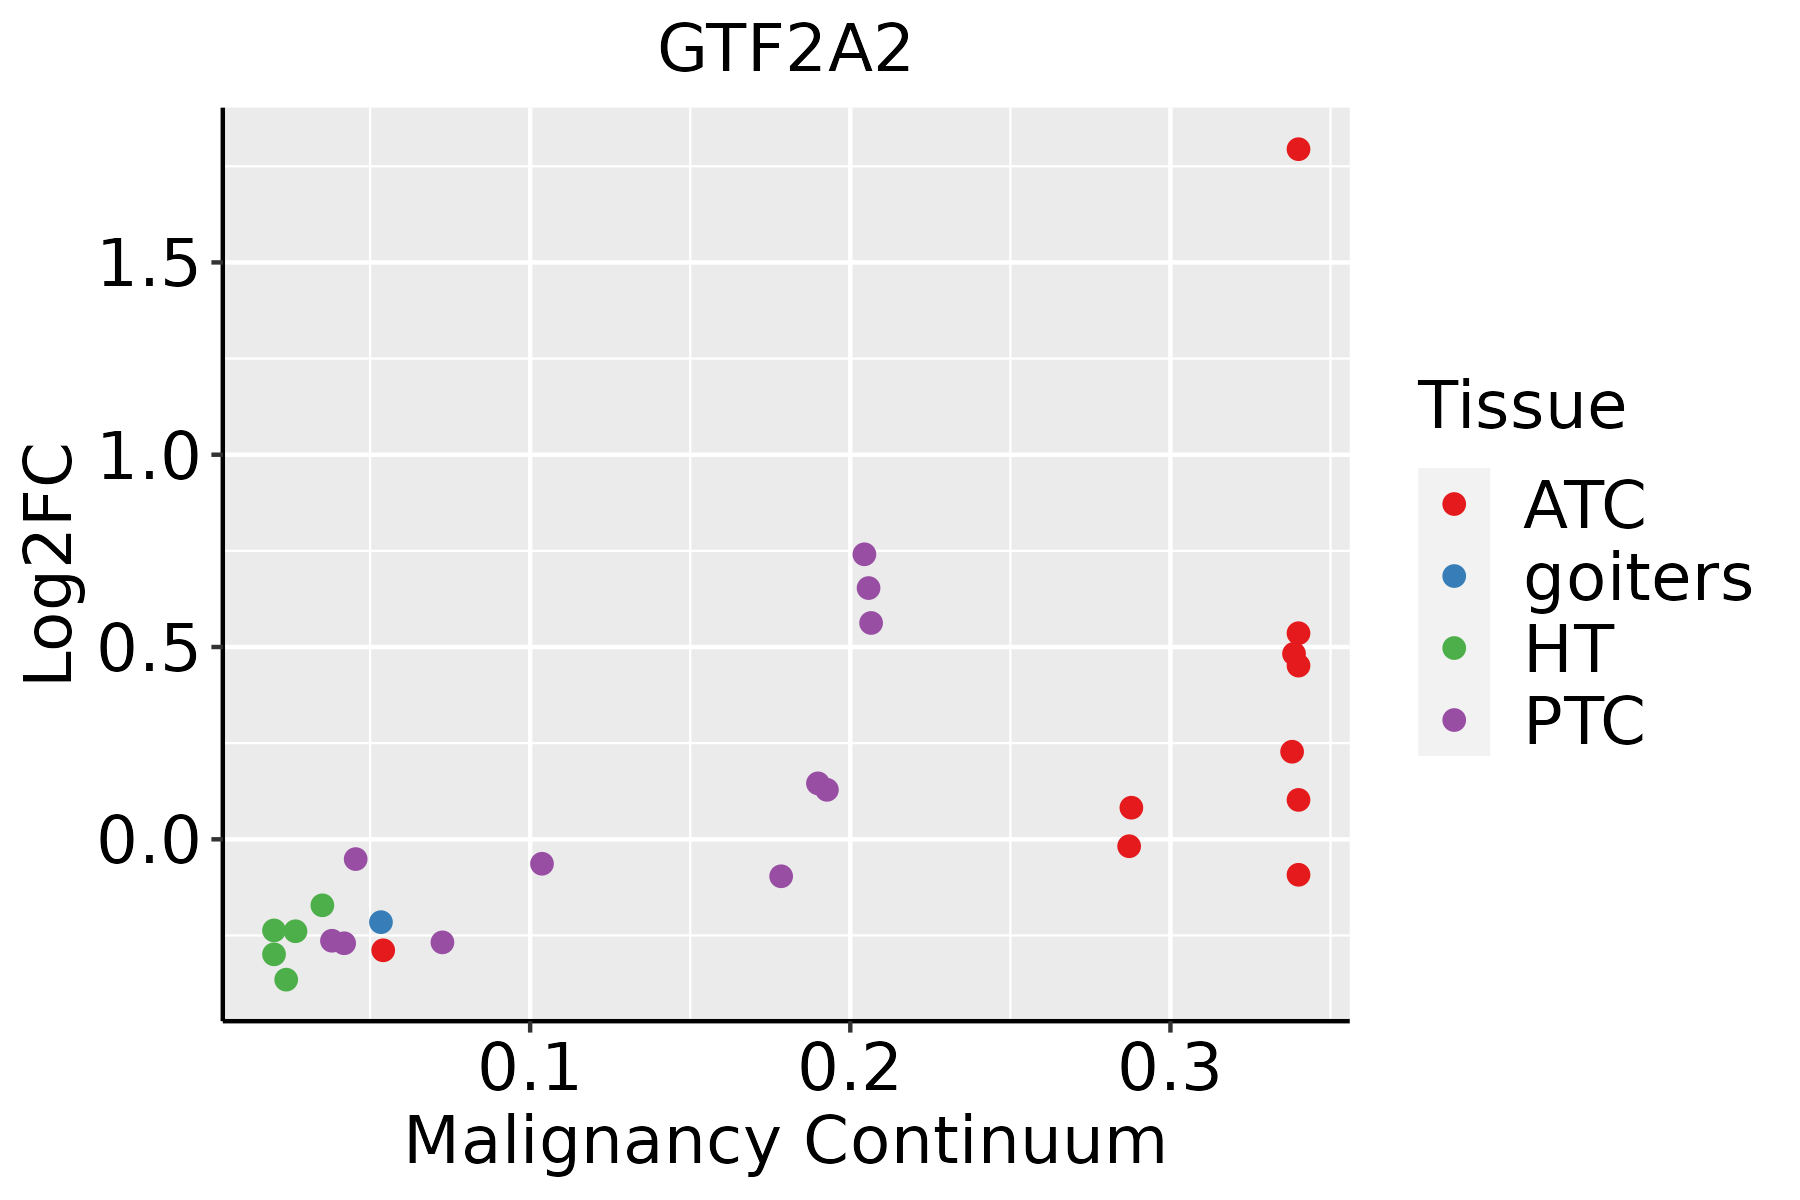 | ATC: Anaplastic thyroid cancer |
| HT: Hashimoto's thyroiditis | ||
| PTC: Papillary thyroid cancer |
| ∗log2FC in expression of this searched gene in stem-like cells from each diseased tissue sample relative to stem-like cells in normal samples in each tissue plotted against the malignancy continuum. Samples are colored based on if they are from different disease stage. |
Top |
Malignant transformation related pathway analysis |
| Find out the enriched GO biological processes and KEGG pathways involved in transition from healthy to precancer to cancer |
| Tissue | Disease Stage | Enriched GO biological Processes |
| Colorectum | AD |  |
| Colorectum | SER |  |
| Colorectum | MSS |  |
| Colorectum | MSI-H |  |
| Colorectum | FAP |  |
| ∗Top 15 enriched GO BP terms are showed in the bar plot of each disease state in each tissue. Each row represents a significant GO biological process which is colored according to the -log10(p.adjust). |
| Page: 1 2 3 4 5 6 7 8 9 |
| GO ID | Tissue | Disease Stage | Description | Gene Ratio | Bg Ratio | pvalue | p.adjust | Count |
| GO:00063523 | Esophagus | HGIN | DNA-templated transcription, initiation | 30/2587 | 130/18723 | 2.86e-03 | 2.79e-02 | 30 |
| GO:00063673 | Esophagus | ESCC | transcription initiation from RNA polymerase II promoter | 56/8552 | 77/18723 | 1.30e-06 | 1.59e-05 | 56 |
| GO:000635211 | Esophagus | ESCC | DNA-templated transcription, initiation | 86/8552 | 130/18723 | 1.88e-06 | 2.19e-05 | 86 |
| GO:00708973 | Esophagus | ESCC | transcription preinitiation complex assembly | 30/8552 | 36/18723 | 3.60e-06 | 3.95e-05 | 30 |
| GO:00511232 | Esophagus | ESCC | RNA polymerase II preinitiation complex assembly | 18/8552 | 24/18723 | 3.43e-03 | 1.41e-02 | 18 |
| GO:0006367 | Liver | Cirrhotic | transcription initiation from RNA polymerase II promoter | 31/4634 | 77/18723 | 1.91e-03 | 1.20e-02 | 31 |
| GO:0070897 | Liver | Cirrhotic | transcription preinitiation complex assembly | 17/4634 | 36/18723 | 2.82e-03 | 1.63e-02 | 17 |
| GO:0051123 | Liver | Cirrhotic | RNA polymerase II preinitiation complex assembly | 12/4634 | 24/18723 | 6.58e-03 | 3.25e-02 | 12 |
| GO:00063671 | Liver | HCC | transcription initiation from RNA polymerase II promoter | 52/7958 | 77/18723 | 7.87e-06 | 9.27e-05 | 52 |
| GO:0006352 | Liver | HCC | DNA-templated transcription, initiation | 78/7958 | 130/18723 | 4.19e-05 | 4.11e-04 | 78 |
| GO:00708971 | Liver | HCC | transcription preinitiation complex assembly | 25/7958 | 36/18723 | 9.87e-04 | 5.71e-03 | 25 |
| GO:00511231 | Liver | HCC | RNA polymerase II preinitiation complex assembly | 17/7958 | 24/18723 | 4.72e-03 | 2.02e-02 | 17 |
| GO:00063522 | Oral cavity | OSCC | DNA-templated transcription, initiation | 74/7305 | 130/18723 | 2.56e-05 | 2.39e-04 | 74 |
| GO:00063672 | Oral cavity | OSCC | transcription initiation from RNA polymerase II promoter | 46/7305 | 77/18723 | 1.82e-04 | 1.24e-03 | 46 |
| GO:00708972 | Oral cavity | OSCC | transcription preinitiation complex assembly | 24/7305 | 36/18723 | 7.18e-04 | 3.95e-03 | 24 |
| GO:000636711 | Oral cavity | LP | transcription initiation from RNA polymerase II promoter | 31/4623 | 77/18723 | 1.83e-03 | 1.38e-02 | 31 |
| GO:007089711 | Oral cavity | LP | transcription preinitiation complex assembly | 17/4623 | 36/18723 | 2.74e-03 | 1.92e-02 | 17 |
| GO:00063521 | Oral cavity | LP | DNA-templated transcription, initiation | 45/4623 | 130/18723 | 7.03e-03 | 3.96e-02 | 45 |
| GO:000635212 | Skin | cSCC | DNA-templated transcription, initiation | 57/4864 | 130/18723 | 7.28e-06 | 1.01e-04 | 57 |
| GO:00063674 | Skin | cSCC | transcription initiation from RNA polymerase II promoter | 37/4864 | 77/18723 | 2.53e-05 | 2.87e-04 | 37 |
| Page: 1 2 |
| Pathway ID | Tissue | Disease Stage | Description | Gene Ratio | Bg Ratio | pvalue | p.adjust | qvalue | Count |
| hsa052039 | Esophagus | HGIN | Viral carcinogenesis | 53/1383 | 204/8465 | 2.58e-04 | 2.71e-03 | 2.15e-03 | 53 |
| hsa0520315 | Esophagus | HGIN | Viral carcinogenesis | 53/1383 | 204/8465 | 2.58e-04 | 2.71e-03 | 2.15e-03 | 53 |
| hsa0520325 | Esophagus | ESCC | Viral carcinogenesis | 137/4205 | 204/8465 | 2.47e-07 | 1.88e-06 | 9.62e-07 | 137 |
| hsa030222 | Esophagus | ESCC | Basal transcription factors | 35/4205 | 45/8465 | 1.01e-04 | 4.06e-04 | 2.08e-04 | 35 |
| hsa0520335 | Esophagus | ESCC | Viral carcinogenesis | 137/4205 | 204/8465 | 2.47e-07 | 1.88e-06 | 9.62e-07 | 137 |
| hsa0302211 | Esophagus | ESCC | Basal transcription factors | 35/4205 | 45/8465 | 1.01e-04 | 4.06e-04 | 2.08e-04 | 35 |
| hsa05203 | Liver | Cirrhotic | Viral carcinogenesis | 76/2530 | 204/8465 | 1.34e-02 | 4.20e-02 | 2.59e-02 | 76 |
| hsa052031 | Liver | Cirrhotic | Viral carcinogenesis | 76/2530 | 204/8465 | 1.34e-02 | 4.20e-02 | 2.59e-02 | 76 |
| hsa052032 | Liver | HCC | Viral carcinogenesis | 117/4020 | 204/8465 | 2.68e-03 | 8.98e-03 | 5.00e-03 | 117 |
| hsa052033 | Liver | HCC | Viral carcinogenesis | 117/4020 | 204/8465 | 2.68e-03 | 8.98e-03 | 5.00e-03 | 117 |
| hsa052038 | Oral cavity | OSCC | Viral carcinogenesis | 124/3704 | 204/8465 | 5.57e-07 | 3.28e-06 | 1.67e-06 | 124 |
| hsa03022 | Oral cavity | OSCC | Basal transcription factors | 28/3704 | 45/8465 | 9.53e-03 | 2.11e-02 | 1.08e-02 | 28 |
| hsa0520314 | Oral cavity | OSCC | Viral carcinogenesis | 124/3704 | 204/8465 | 5.57e-07 | 3.28e-06 | 1.67e-06 | 124 |
| hsa030221 | Oral cavity | OSCC | Basal transcription factors | 28/3704 | 45/8465 | 9.53e-03 | 2.11e-02 | 1.08e-02 | 28 |
| hsa0520324 | Oral cavity | LP | Viral carcinogenesis | 90/2418 | 204/8465 | 1.20e-06 | 1.38e-05 | 8.89e-06 | 90 |
| hsa0520334 | Oral cavity | LP | Viral carcinogenesis | 90/2418 | 204/8465 | 1.20e-06 | 1.38e-05 | 8.89e-06 | 90 |
| hsa052037 | Prostate | BPH | Viral carcinogenesis | 69/1718 | 204/8465 | 3.40e-06 | 2.87e-05 | 1.78e-05 | 69 |
| hsa0520313 | Prostate | BPH | Viral carcinogenesis | 69/1718 | 204/8465 | 3.40e-06 | 2.87e-05 | 1.78e-05 | 69 |
| hsa0520323 | Prostate | Tumor | Viral carcinogenesis | 70/1791 | 204/8465 | 7.53e-06 | 6.56e-05 | 4.07e-05 | 70 |
| hsa0520333 | Prostate | Tumor | Viral carcinogenesis | 70/1791 | 204/8465 | 7.53e-06 | 6.56e-05 | 4.07e-05 | 70 |
| Page: 1 |
Top |
Cell-cell communication analysis |
| Identification of potential cell-cell interactions between two cell types and their ligand-receptor pairs for different disease states |
| Ligand | Receptor | LRpair | Pathway | Tissue | Disease Stage |
| Page: 1 |
Top |
Single-cell gene regulatory network inference analysis |
| Find out the significant the regulons (TFs) and the target genes of each regulon across cell types for different disease states |
| TF | Cell Type | Tissue | Disease Stage | Target Gene | RSS | Regulon Activity |
| GTF2A2 | PLA | Breast | ADJ | SSBP1,DAD1,SLC25A33, etc. | 1.20e-01 |  |
| GTF2A2 | TREG | Breast | ADJ | SSBP1,DAD1,SLC25A33, etc. | 4.22e-02 | |
| GTF2A2 | TFH | Breast | ADJ | SSBP1,DAD1,SLC25A33, etc. | 5.82e-02 | |
| GTF2A2 | GC | Breast | ADJ | SSBP1,DAD1,SLC25A33, etc. | 2.76e-02 | |
| GTF2A2 | MAST | Breast | DCIS | SSBP1,DAD1,SLC25A33, etc. | 2.84e-02 |  |
| GTF2A2 | TFH | Breast | Healthy | SSBP1,DAD1,SLC25A33, etc. | 1.13e-02 |  |
| GTF2A2 | MALTB | Endometrium | ADJ | UBB,KRT10,CD101, etc. | 6.51e-02 |  |
| GTF2A2 | NEUT | Endometrium | ADJ | UBB,KRT10,CD101, etc. | 3.93e-02 | |
| GTF2A2 | PLA | Endometrium | ADJ | UBB,KRT10,CD101, etc. | 9.43e-02 | |
| GTF2A2 | NEUT | Endometrium | AEH | UBB,KRT10,CD101, etc. | 3.21e-01 |  |
| ∗The dot plots of a searched regulon are shown for all cell subpopulations in each disease state of each tissue based on the regulon specific score inferred using pySCENIC and by calculating the average expression. |
| Page: 1 2 3 4 |
Top |
Somatic mutation of malignant transformation related genes |
| Annotation of somatic variants for genes involved in malignant transformation |
| Hugo Symbol | Variant Class | Variant Classification | dbSNP RS | HGVSc | HGVSp | HGVSp Short | SWISSPROT | BIOTYPE | SIFT | PolyPhen | Tumor Sample Barcode | Tissue | Histology | Sex | Age | Stage | Therapy Types | Drugs | Outcome |
| GTF2A2 | SNV | Missense_Mutation | novel | c.103N>G | p.Gln35Glu | p.Q35E | P52657 | protein_coding | deleterious(0) | benign(0.012) | TCGA-LL-A73Y-01 | Breast | breast invasive carcinoma | Female | >=65 | I/II | Chemotherapy | taxotere | SD |
| GTF2A2 | SNV | Missense_Mutation | c.232N>A | p.Asp78Asn | p.D78N | P52657 | protein_coding | tolerated(0.65) | benign(0.042) | TCGA-IR-A3LL-01 | Cervix | cervical & endocervical cancer | Female | <65 | I/II | Chemotherapy | cisplatin | CR | |
| GTF2A2 | SNV | Missense_Mutation | novel | c.201C>A | p.Phe67Leu | p.F67L | P52657 | protein_coding | tolerated(0.16) | possibly_damaging(0.596) | TCGA-EI-6917-01 | Colorectum | rectum adenocarcinoma | Male | <65 | III/IV | Chemotherapy | 5fluorouracil+oxaciplatina+l-folinian | SD |
| GTF2A2 | SNV | Missense_Mutation | novel | c.43N>T | p.Leu15Phe | p.L15F | P52657 | protein_coding | deleterious(0) | probably_damaging(0.965) | TCGA-DI-A1BU-01 | Endometrium | uterine corpus endometrioid carcinoma | Female | <65 | I/II | Chemotherapy | paclitaxel | SD |
| GTF2A2 | SNV | Missense_Mutation | novel | c.137N>T | p.Ala46Val | p.A46V | P52657 | protein_coding | deleterious(0.04) | benign(0.01) | TCGA-EO-A3KX-01 | Endometrium | uterine corpus endometrioid carcinoma | Female | >=65 | I/II | Unknown | Unknown | SD |
| GTF2A2 | SNV | Missense_Mutation | novel | c.203N>T | p.Cys68Phe | p.C68F | P52657 | protein_coding | deleterious(0) | probably_damaging(0.943) | TCGA-CR-7374-01 | Oral cavity | head & neck squamous cell carcinoma | Female | >=65 | I/II | Unknown | Unknown | SD |
| Page: 1 |
Top |
Related drugs of malignant transformation related genes |
| Identification of chemicals and drugs interact with genes involved in malignant transfromation |
| (DGIdb 4.0) |
| Entrez ID | Symbol | Category | Interaction Types | Drug Claim Name | Drug Name | PMIDs |
| Page: 1 |

Copyright 2023-Present -The University of Texas Health Science Center at Houston |