
|
|||||
|
 | |
| |
| |
| |
| |
| |
|
Gene: GTF2A1 |
Gene summary for GTF2A1 |
| Gene information | Species | Human | Gene symbol | GTF2A1 | Gene ID | 2957 |
| Gene name | general transcription factor IIA subunit 1 | |
| Gene Alias | TF2A1 | |
| Cytomap | 14q31.1 | |
| Gene Type | protein-coding | GO ID | GO:0006139 | UniProtAcc | P52655 |
Top |
Malignant transformation analysis |
| Identification of the aberrant gene expression in precancerous and cancerous lesions by comparing the gene expression of stem-like cells in diseased tissues with normal stem cells |
| Entrez ID | Symbol | Replicates | Species | Organ | Tissue | Adj P-value | Log2FC | Malignancy |
| 2957 | GTF2A1 | LZE4T | Human | Esophagus | ESCC | 1.19e-10 | 3.32e-01 | 0.0811 |
| 2957 | GTF2A1 | LZE7T | Human | Esophagus | ESCC | 3.49e-03 | 2.27e-01 | 0.0667 |
| 2957 | GTF2A1 | LZE20T | Human | Esophagus | ESCC | 6.04e-04 | 1.19e-01 | 0.0662 |
| 2957 | GTF2A1 | LZE22T | Human | Esophagus | ESCC | 4.46e-08 | 3.58e-01 | 0.068 |
| 2957 | GTF2A1 | LZE24T | Human | Esophagus | ESCC | 2.77e-09 | 2.09e-01 | 0.0596 |
| 2957 | GTF2A1 | P1T-E | Human | Esophagus | ESCC | 6.03e-08 | 2.91e-01 | 0.0875 |
| 2957 | GTF2A1 | P2T-E | Human | Esophagus | ESCC | 1.97e-14 | 2.95e-01 | 0.1177 |
| 2957 | GTF2A1 | P4T-E | Human | Esophagus | ESCC | 6.17e-19 | 3.97e-01 | 0.1323 |
| 2957 | GTF2A1 | P5T-E | Human | Esophagus | ESCC | 1.08e-13 | 2.80e-01 | 0.1327 |
| 2957 | GTF2A1 | P8T-E | Human | Esophagus | ESCC | 2.43e-15 | 3.03e-01 | 0.0889 |
| 2957 | GTF2A1 | P9T-E | Human | Esophagus | ESCC | 9.67e-09 | 1.19e-01 | 0.1131 |
| 2957 | GTF2A1 | P10T-E | Human | Esophagus | ESCC | 3.19e-12 | 2.89e-01 | 0.116 |
| 2957 | GTF2A1 | P11T-E | Human | Esophagus | ESCC | 1.14e-10 | 3.45e-01 | 0.1426 |
| 2957 | GTF2A1 | P12T-E | Human | Esophagus | ESCC | 8.38e-20 | 4.68e-01 | 0.1122 |
| 2957 | GTF2A1 | P15T-E | Human | Esophagus | ESCC | 9.16e-18 | 4.01e-01 | 0.1149 |
| 2957 | GTF2A1 | P16T-E | Human | Esophagus | ESCC | 1.35e-12 | 2.53e-01 | 0.1153 |
| 2957 | GTF2A1 | P17T-E | Human | Esophagus | ESCC | 3.39e-03 | 2.87e-01 | 0.1278 |
| 2957 | GTF2A1 | P19T-E | Human | Esophagus | ESCC | 2.20e-02 | 4.06e-01 | 0.1662 |
| 2957 | GTF2A1 | P20T-E | Human | Esophagus | ESCC | 2.89e-10 | 1.27e-01 | 0.1124 |
| 2957 | GTF2A1 | P21T-E | Human | Esophagus | ESCC | 1.21e-08 | 1.19e-01 | 0.1617 |
| Page: 1 2 3 4 |
| Tissue | Expression Dynamics | Abbreviation |
| Esophagus |  | ESCC: Esophageal squamous cell carcinoma |
| HGIN: High-grade intraepithelial neoplasias | ||
| LGIN: Low-grade intraepithelial neoplasias | ||
| Thyroid | 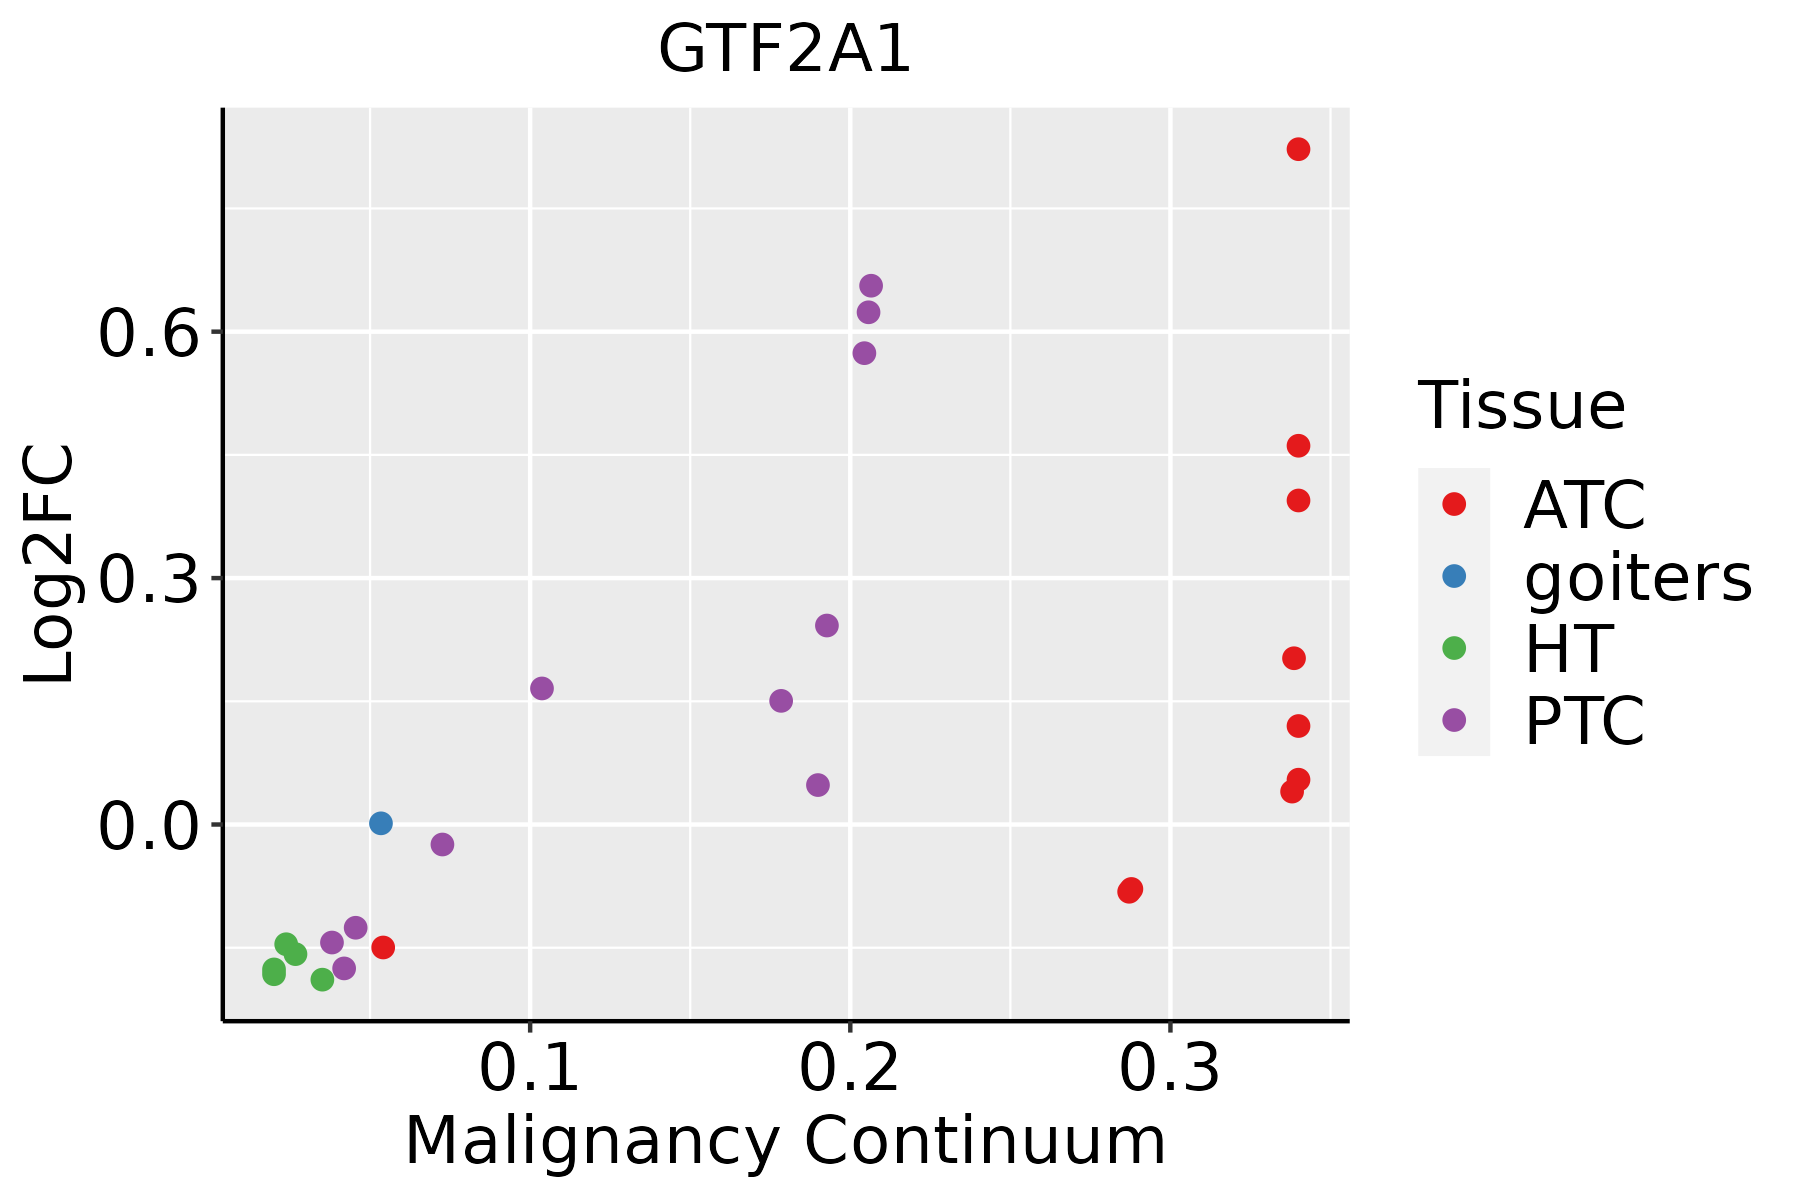 | ATC: Anaplastic thyroid cancer |
| HT: Hashimoto's thyroiditis | ||
| PTC: Papillary thyroid cancer |
| ∗log2FC in expression of this searched gene in stem-like cells from each diseased tissue sample relative to stem-like cells in normal samples in each tissue plotted against the malignancy continuum. Samples are colored based on if they are from different disease stage. |
Top |
Malignant transformation related pathway analysis |
| Find out the enriched GO biological processes and KEGG pathways involved in transition from healthy to precancer to cancer |
| Tissue | Disease Stage | Enriched GO biological Processes |
| Colorectum | AD |  |
| Colorectum | SER |  |
| Colorectum | MSS |  |
| Colorectum | MSI-H |  |
| Colorectum | FAP |  |
| ∗Top 15 enriched GO BP terms are showed in the bar plot of each disease state in each tissue. Each row represents a significant GO biological process which is colored according to the -log10(p.adjust). |
| Page: 1 2 3 4 5 6 7 8 9 |
| GO ID | Tissue | Disease Stage | Description | Gene Ratio | Bg Ratio | pvalue | p.adjust | Count |
| GO:00063673 | Esophagus | ESCC | transcription initiation from RNA polymerase II promoter | 56/8552 | 77/18723 | 1.30e-06 | 1.59e-05 | 56 |
| GO:000635211 | Esophagus | ESCC | DNA-templated transcription, initiation | 86/8552 | 130/18723 | 1.88e-06 | 2.19e-05 | 86 |
| GO:00063675 | Thyroid | PTC | transcription initiation from RNA polymerase II promoter | 44/5968 | 77/18723 | 4.04e-06 | 5.05e-05 | 44 |
| GO:00063525 | Thyroid | PTC | DNA-templated transcription, initiation | 63/5968 | 130/18723 | 5.72e-05 | 5.05e-04 | 63 |
| GO:000636712 | Thyroid | ATC | transcription initiation from RNA polymerase II promoter | 44/6293 | 77/18723 | 1.86e-05 | 1.70e-04 | 44 |
| GO:000635213 | Thyroid | ATC | DNA-templated transcription, initiation | 64/6293 | 130/18723 | 1.60e-04 | 1.10e-03 | 64 |
| Page: 1 |
| Pathway ID | Tissue | Disease Stage | Description | Gene Ratio | Bg Ratio | pvalue | p.adjust | qvalue | Count |
| hsa0520325 | Esophagus | ESCC | Viral carcinogenesis | 137/4205 | 204/8465 | 2.47e-07 | 1.88e-06 | 9.62e-07 | 137 |
| hsa030222 | Esophagus | ESCC | Basal transcription factors | 35/4205 | 45/8465 | 1.01e-04 | 4.06e-04 | 2.08e-04 | 35 |
| hsa0520335 | Esophagus | ESCC | Viral carcinogenesis | 137/4205 | 204/8465 | 2.47e-07 | 1.88e-06 | 9.62e-07 | 137 |
| hsa0302211 | Esophagus | ESCC | Basal transcription factors | 35/4205 | 45/8465 | 1.01e-04 | 4.06e-04 | 2.08e-04 | 35 |
| Page: 1 |
Top |
Cell-cell communication analysis |
| Identification of potential cell-cell interactions between two cell types and their ligand-receptor pairs for different disease states |
| Ligand | Receptor | LRpair | Pathway | Tissue | Disease Stage |
| Page: 1 |
Top |
Single-cell gene regulatory network inference analysis |
| Find out the significant the regulons (TFs) and the target genes of each regulon across cell types for different disease states |
| TF | Cell Type | Tissue | Disease Stage | Target Gene | RSS | Regulon Activity |
| GTF2A1 | CD8TEX | Breast | ADJ | B4GALT5,TADA2A,NDUFA5, etc. | 2.22e-16 |  |
| GTF2A1 | MON | Breast | Precancer | B4GALT5,TADA2A,NDUFA5, etc. | 4.60e-02 |  |
| ∗The dot plots of a searched regulon are shown for all cell subpopulations in each disease state of each tissue based on the regulon specific score inferred using pySCENIC and by calculating the average expression. |
| Page: 1 |
Top |
Somatic mutation of malignant transformation related genes |
| Annotation of somatic variants for genes involved in malignant transformation |
| Hugo Symbol | Variant Class | Variant Classification | dbSNP RS | HGVSc | HGVSp | HGVSp Short | SWISSPROT | BIOTYPE | SIFT | PolyPhen | Tumor Sample Barcode | Tissue | Histology | Sex | Age | Stage | Therapy Types | Drugs | Outcome |
| GTF2A1 | SNV | Missense_Mutation | c.814C>A | p.Gln272Lys | p.Q272K | P52655 | protein_coding | deleterious(0) | possibly_damaging(0.893) | TCGA-AR-A255-01 | Breast | breast invasive carcinoma | Female | <65 | I/II | Targeted Molecular therapy | trastuzumab | SD | |
| GTF2A1 | SNV | Missense_Mutation | novel | c.976N>G | p.Gln326Glu | p.Q326E | P52655 | protein_coding | deleterious(0.04) | benign(0.225) | TCGA-E2-A573-01 | Breast | breast invasive carcinoma | Female | <65 | I/II | Chemotherapy | taxotere | CR |
| GTF2A1 | SNV | Missense_Mutation | novel | c.40T>C | p.Tyr14His | p.Y14H | P52655 | protein_coding | deleterious(0) | probably_damaging(0.992) | TCGA-E2-A576-01 | Breast | breast invasive carcinoma | Female | >=65 | I/II | Chemotherapy | taxotere | SD |
| GTF2A1 | SNV | Missense_Mutation | c.721G>A | p.Ala241Thr | p.A241T | P52655 | protein_coding | tolerated(0.53) | benign(0.067) | TCGA-A6-6653-01 | Colorectum | colon adenocarcinoma | Male | >=65 | I/II | Unknown | Unknown | SD | |
| GTF2A1 | SNV | Missense_Mutation | novel | c.397N>C | p.Asn133His | p.N133H | P52655 | protein_coding | tolerated(0.06) | benign(0.269) | TCGA-AA-3984-01 | Colorectum | colon adenocarcinoma | Female | <65 | I/II | Unknown | Unknown | SD |
| GTF2A1 | SNV | Missense_Mutation | c.1049N>C | p.Lys350Thr | p.K350T | P52655 | protein_coding | deleterious(0) | possibly_damaging(0.882) | TCGA-AZ-4315-01 | Colorectum | colon adenocarcinoma | Male | <65 | I/II | Unknown | Unknown | SD | |
| GTF2A1 | SNV | Missense_Mutation | novel | c.1098N>G | p.Ile366Met | p.I366M | P52655 | protein_coding | deleterious(0) | benign(0.315) | TCGA-AZ-6598-01 | Colorectum | colon adenocarcinoma | Female | >=65 | I/II | Unknown | Unknown | SD |
| GTF2A1 | SNV | Missense_Mutation | novel | c.142A>C | p.Asn48His | p.N48H | P52655 | protein_coding | deleterious(0) | possibly_damaging(0.683) | TCGA-CA-6717-01 | Colorectum | colon adenocarcinoma | Male | <65 | I/II | Chemotherapy | oxaliplatin | CR |
| GTF2A1 | SNV | Missense_Mutation | c.421N>T | p.Ala141Ser | p.A141S | P52655 | protein_coding | tolerated(0.45) | possibly_damaging(0.454) | TCGA-G4-6320-01 | Colorectum | colon adenocarcinoma | Male | >=65 | III/IV | Chemotherapy | oxaliplatin | SD | |
| GTF2A1 | deletion | Frame_Shift_Del | c.130delN | p.Thr44LeufsTer7 | p.T44Lfs*7 | P52655 | protein_coding | TCGA-G4-6588-01 | Colorectum | colon adenocarcinoma | Female | <65 | I/II | Unknown | Unknown | SD |
| Page: 1 2 3 4 |
Top |
Related drugs of malignant transformation related genes |
| Identification of chemicals and drugs interact with genes involved in malignant transfromation |
| (DGIdb 4.0) |
| Entrez ID | Symbol | Category | Interaction Types | Drug Claim Name | Drug Name | PMIDs |
| Page: 1 |

Copyright 2023-Present -The University of Texas Health Science Center at Houston |