
|
|||||
|
 | |
| |
| |
| |
| |
| |
|
Gene: GSTT2B |
Gene summary for GSTT2B |
| Gene information | Species | Human | Gene symbol | GSTT2B | Gene ID | 653689 |
| Gene name | glutathione S-transferase theta 2B | |
| Gene Alias | GSTT2P | |
| Cytomap | 22q11.23 | |
| Gene Type | protein-coding | GO ID | GO:0006518 | UniProtAcc | G9J6Q5 |
Top |
Malignant transformation analysis |
| Identification of the aberrant gene expression in precancerous and cancerous lesions by comparing the gene expression of stem-like cells in diseased tissues with normal stem cells |
| Entrez ID | Symbol | Replicates | Species | Organ | Tissue | Adj P-value | Log2FC | Malignancy |
| 653689 | GSTT2B | P2T-E | Human | Esophagus | ESCC | 9.44e-07 | 1.36e-01 | 0.1177 |
| 653689 | GSTT2B | P4T-E | Human | Esophagus | ESCC | 4.72e-08 | 1.68e-01 | 0.1323 |
| 653689 | GSTT2B | P9T-E | Human | Esophagus | ESCC | 7.52e-08 | 2.20e-01 | 0.1131 |
| 653689 | GSTT2B | P10T-E | Human | Esophagus | ESCC | 3.19e-23 | 3.74e-01 | 0.116 |
| 653689 | GSTT2B | P12T-E | Human | Esophagus | ESCC | 3.52e-19 | 3.56e-01 | 0.1122 |
| 653689 | GSTT2B | P16T-E | Human | Esophagus | ESCC | 1.25e-26 | 4.27e-01 | 0.1153 |
| 653689 | GSTT2B | P17T-E | Human | Esophagus | ESCC | 5.87e-04 | 2.21e-01 | 0.1278 |
| 653689 | GSTT2B | P19T-E | Human | Esophagus | ESCC | 4.21e-05 | 4.89e-01 | 0.1662 |
| 653689 | GSTT2B | P23T-E | Human | Esophagus | ESCC | 1.17e-03 | 1.69e-01 | 0.108 |
| 653689 | GSTT2B | P24T-E | Human | Esophagus | ESCC | 2.06e-08 | 1.90e-01 | 0.1287 |
| 653689 | GSTT2B | P26T-E | Human | Esophagus | ESCC | 3.95e-30 | 5.26e-01 | 0.1276 |
| 653689 | GSTT2B | P27T-E | Human | Esophagus | ESCC | 1.62e-13 | 2.38e-01 | 0.1055 |
| 653689 | GSTT2B | P38T-E | Human | Esophagus | ESCC | 3.73e-10 | 4.96e-01 | 0.127 |
| 653689 | GSTT2B | P42T-E | Human | Esophagus | ESCC | 3.25e-09 | 3.18e-01 | 0.1175 |
| 653689 | GSTT2B | P44T-E | Human | Esophagus | ESCC | 4.72e-04 | 1.97e-01 | 0.1096 |
| 653689 | GSTT2B | P48T-E | Human | Esophagus | ESCC | 1.76e-12 | 2.03e-01 | 0.0959 |
| 653689 | GSTT2B | P49T-E | Human | Esophagus | ESCC | 4.22e-05 | 6.47e-01 | 0.1768 |
| 653689 | GSTT2B | P52T-E | Human | Esophagus | ESCC | 1.88e-11 | 2.68e-01 | 0.1555 |
| 653689 | GSTT2B | P57T-E | Human | Esophagus | ESCC | 1.96e-05 | 1.32e-01 | 0.0926 |
| 653689 | GSTT2B | P61T-E | Human | Esophagus | ESCC | 3.91e-15 | 3.65e-01 | 0.099 |
| Page: 1 2 |
| Tissue | Expression Dynamics | Abbreviation |
| Esophagus | 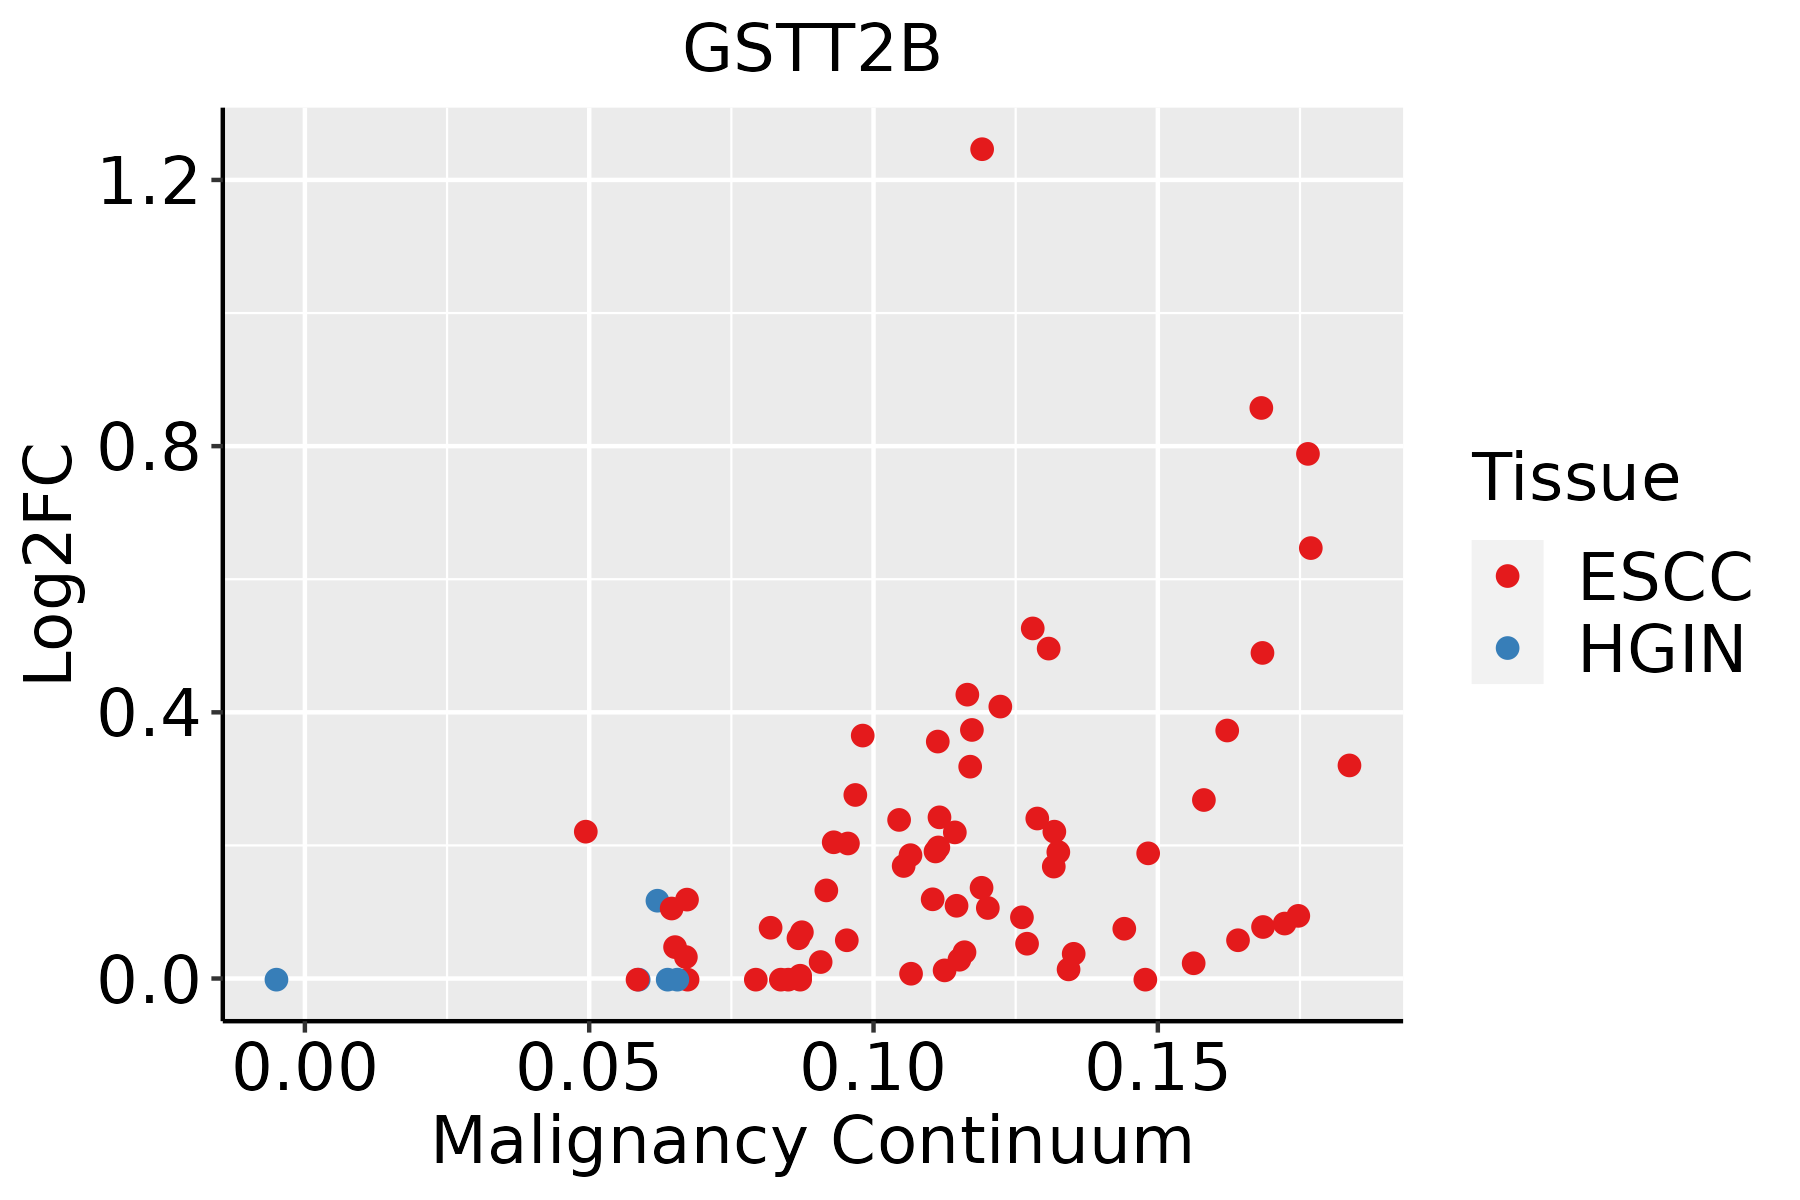 | ESCC: Esophageal squamous cell carcinoma |
| HGIN: High-grade intraepithelial neoplasias | ||
| LGIN: Low-grade intraepithelial neoplasias |
| ∗log2FC in expression of this searched gene in stem-like cells from each diseased tissue sample relative to stem-like cells in normal samples in each tissue plotted against the malignancy continuum. Samples are colored based on if they are from different disease stage. |
Top |
Malignant transformation related pathway analysis |
| Find out the enriched GO biological processes and KEGG pathways involved in transition from healthy to precancer to cancer |
| Tissue | Disease Stage | Enriched GO biological Processes |
| Colorectum | AD |  |
| Colorectum | SER |  |
| Colorectum | MSS |  |
| Colorectum | MSI-H |  |
| Colorectum | FAP |  |
| ∗Top 15 enriched GO BP terms are showed in the bar plot of each disease state in each tissue. Each row represents a significant GO biological process which is colored according to the -log10(p.adjust). |
| Page: 1 2 3 4 5 6 7 8 9 |
| GO ID | Tissue | Disease Stage | Description | Gene Ratio | Bg Ratio | pvalue | p.adjust | Count |
| GO:00067906 | Esophagus | ESCC | sulfur compound metabolic process | 201/8552 | 339/18723 | 2.64e-07 | 3.94e-06 | 201 |
| GO:00065757 | Esophagus | ESCC | cellular modified amino acid metabolic process | 112/8552 | 188/18723 | 8.31e-05 | 6.06e-04 | 112 |
| GO:000674912 | Esophagus | ESCC | glutathione metabolic process | 42/8552 | 64/18723 | 1.01e-03 | 5.12e-03 | 42 |
| Page: 1 |
| Pathway ID | Tissue | Disease Stage | Description | Gene Ratio | Bg Ratio | pvalue | p.adjust | qvalue | Count |
| hsa05418211 | Esophagus | ESCC | Fluid shear stress and atherosclerosis | 109/4205 | 139/8465 | 2.00e-12 | 3.72e-11 | 1.90e-11 | 109 |
| hsa0522518 | Esophagus | ESCC | Hepatocellular carcinoma | 109/4205 | 168/8465 | 4.27e-05 | 1.88e-04 | 9.64e-05 | 109 |
| hsa05418310 | Esophagus | ESCC | Fluid shear stress and atherosclerosis | 109/4205 | 139/8465 | 2.00e-12 | 3.72e-11 | 1.90e-11 | 109 |
| hsa0522519 | Esophagus | ESCC | Hepatocellular carcinoma | 109/4205 | 168/8465 | 4.27e-05 | 1.88e-04 | 9.64e-05 | 109 |
| Page: 1 |
Top |
Cell-cell communication analysis |
| Identification of potential cell-cell interactions between two cell types and their ligand-receptor pairs for different disease states |
| Ligand | Receptor | LRpair | Pathway | Tissue | Disease Stage |
| Page: 1 |
Top |
Single-cell gene regulatory network inference analysis |
| Find out the significant the regulons (TFs) and the target genes of each regulon across cell types for different disease states |
| TF | Cell Type | Tissue | Disease Stage | Target Gene | RSS | Regulon Activity |
| ∗The dot plots of a searched regulon are shown for all cell subpopulations in each disease state of each tissue based on the regulon specific score inferred using pySCENIC and by calculating the average expression. |
| Page: 1 |
Top |
Somatic mutation of malignant transformation related genes |
| Annotation of somatic variants for genes involved in malignant transformation |
| Hugo Symbol | Variant Class | Variant Classification | dbSNP RS | HGVSc | HGVSp | HGVSp Short | SWISSPROT | BIOTYPE | SIFT | PolyPhen | Tumor Sample Barcode | Tissue | Histology | Sex | Age | Stage | Therapy Types | Drugs | Outcome |
| GSTT2B | SNV | Missense_Mutation | novel | c.560G>A | p.Arg187Gln | p.R187Q | P0CG30 | protein_coding | deleterious(0.01) | probably_damaging(0.962) | TCGA-AA-A01R-01 | Colorectum | colon adenocarcinoma | Male | <65 | III/IV | Chemotherapy | 5-fluorouracil | PD |
| GSTT2B | SNV | Missense_Mutation | novel | c.716G>A | p.Arg239Gln | p.R239Q | P0CG30 | protein_coding | deleterious(0.04) | benign(0.184) | TCGA-AD-6899-01 | Colorectum | colon adenocarcinoma | Male | >=65 | III/IV | Unknown | Unknown | SD |
| GSTT2B | SNV | Missense_Mutation | novel | c.637N>G | p.Ile213Val | p.I213V | P0CG30 | protein_coding | tolerated(0.11) | benign(0.02) | TCGA-CM-5861-01 | Colorectum | colon adenocarcinoma | Female | <65 | I/II | Unknown | Unknown | PD |
| GSTT2B | SNV | Missense_Mutation | novel | c.46G>A | p.Ala16Thr | p.A16T | P0CG30 | protein_coding | deleterious(0.01) | possibly_damaging(0.88) | TCGA-G4-6586-01 | Colorectum | colon adenocarcinoma | Female | >=65 | I/II | Unknown | Unknown | SD |
| GSTT2B | SNV | Missense_Mutation | novel | c.544N>A | p.Glu182Lys | p.E182K | P0CG30 | protein_coding | tolerated(0.06) | benign(0.011) | TCGA-A5-A0G1-01 | Endometrium | uterine corpus endometrioid carcinoma | Female | >=65 | I/II | Unknown | Unknown | SD |
| GSTT2B | SNV | Missense_Mutation | novel | c.80C>T | p.Pro27Leu | p.P27L | P0CG30 | protein_coding | deleterious(0) | probably_damaging(0.958) | TCGA-A5-A0G2-01 | Endometrium | uterine corpus endometrioid carcinoma | Female | <65 | III/IV | Unknown | Unknown | SD |
| GSTT2B | SNV | Missense_Mutation | novel | c.451N>A | p.Leu151Met | p.L151M | P0CG30 | protein_coding | deleterious(0) | probably_damaging(0.999) | TCGA-A5-A1OF-01 | Endometrium | uterine corpus endometrioid carcinoma | Female | <65 | I/II | Unknown | Unknown | SD |
| GSTT2B | SNV | Missense_Mutation | novel | c.250T>C | p.Trp84Arg | p.W84R | P0CG30 | protein_coding | deleterious(0) | probably_damaging(0.997) | TCGA-AP-A054-01 | Endometrium | uterine corpus endometrioid carcinoma | Female | <65 | III/IV | Chemotherapy | carboplatin | PD |
| GSTT2B | SNV | Missense_Mutation | novel | c.575N>T | p.Ala192Val | p.A192V | P0CG30 | protein_coding | deleterious(0.02) | benign(0.137) | TCGA-AX-A1C5-01 | Endometrium | uterine corpus endometrioid carcinoma | Female | <65 | III/IV | Unspecific | Carboplatin | SD |
| GSTT2B | SNV | Missense_Mutation | novel | c.601N>A | p.Leu201Met | p.L201M | P0CG30 | protein_coding | deleterious(0.02) | possibly_damaging(0.737) | TCGA-AX-A2HC-01 | Endometrium | uterine corpus endometrioid carcinoma | Female | <65 | III/IV | Chemotherapy | paclitaxel | PD |
| Page: 1 2 3 |
Top |
Related drugs of malignant transformation related genes |
| Identification of chemicals and drugs interact with genes involved in malignant transfromation |
| (DGIdb 4.0) |
| Entrez ID | Symbol | Category | Interaction Types | Drug Claim Name | Drug Name | PMIDs |
| Page: 1 |

Copyright 2023-Present -The University of Texas Health Science Center at Houston |