
|
|||||
|
 | |
| |
| |
| |
| |
| |
|
Gene: GSTT1 |
Gene summary for GSTT1 |
| Gene information | Species | Human | Gene symbol | GSTT1 | Gene ID | 2952 |
| Gene name | glutathione S-transferase theta 1 | |
| Gene Alias | GSTT1 | |
| Cytomap | 22q11.23 | |
| Gene Type | protein-coding | GO ID | GO:0006518 | UniProtAcc | P30711 |
Top |
Malignant transformation analysis |
| Identification of the aberrant gene expression in precancerous and cancerous lesions by comparing the gene expression of stem-like cells in diseased tissues with normal stem cells |
| Entrez ID | Symbol | Replicates | Species | Organ | Tissue | Adj P-value | Log2FC | Malignancy |
| 2952 | GSTT1 | HCC1 | Human | Liver | HCC | 5.10e-04 | 2.21e+00 | 0.5336 |
| 2952 | GSTT1 | HCC2 | Human | Liver | HCC | 1.12e-12 | 2.80e+00 | 0.5341 |
| 2952 | GSTT1 | GSM5353224_PA_PR5186_Pool_1_2_3_S27_L001 | Human | Prostate | Tumor | 1.14e-04 | 2.52e-01 | 0.1621 |
| 2952 | GSTT1 | GSM5353227_PA_PR5199-193K_Pool_1_2_3_S55_L002 | Human | Prostate | Tumor | 2.33e-03 | 2.32e-01 | 0.1602 |
| 2952 | GSTT1 | GSM5353236_PA_PR5251_T1_S7_L001 | Human | Prostate | Tumor | 4.89e-09 | 5.35e-01 | 0.1608 |
| 2952 | GSTT1 | GSM5353240_PA_PR5254_T1_S15_L001 | Human | Prostate | Tumor | 1.30e-12 | 4.63e-01 | 0.1575 |
| 2952 | GSTT1 | P1_S1_AK | Human | Skin | AK | 8.97e-04 | -1.78e-01 | -0.3399 |
| 2952 | GSTT1 | P2_S3_AK | Human | Skin | AK | 2.00e-04 | -1.78e-01 | -0.3287 |
| 2952 | GSTT1 | P2_S4_SCCIS | Human | Skin | SCCIS | 1.90e-03 | -1.78e-01 | -0.3043 |
| 2952 | GSTT1 | P3_S6_AK | Human | Skin | AK | 9.41e-05 | -1.78e-01 | -0.3256 |
| 2952 | GSTT1 | P5_S10_cSCC | Human | Skin | cSCC | 9.41e-05 | -1.78e-01 | -0.299 |
| 2952 | GSTT1 | P1_cSCC | Human | Skin | cSCC | 4.99e-53 | 1.40e+00 | 0.0292 |
| 2952 | GSTT1 | P2_cSCC | Human | Skin | cSCC | 3.07e-09 | 3.19e-01 | -0.024 |
| 2952 | GSTT1 | P4_cSCC | Human | Skin | cSCC | 2.23e-06 | 2.44e-01 | -0.00290000000000005 |
| 2952 | GSTT1 | P10_cSCC | Human | Skin | cSCC | 3.12e-23 | 5.59e-01 | 0.1017 |
| 2952 | GSTT1 | cSCC_p1 | Human | Skin | cSCC | 2.00e-04 | -1.78e-01 | -0.1916 |
| 2952 | GSTT1 | cSCC_p10 | Human | Skin | cSCC | 9.41e-05 | -1.78e-01 | -0.2095 |
| 2952 | GSTT1 | cSCC_p11 | Human | Skin | cSCC | 9.41e-05 | -1.78e-01 | -0.2102 |
| 2952 | GSTT1 | cSCC_p3 | Human | Skin | cSCC | 9.41e-05 | -1.78e-01 | -0.2085 |
| 2952 | GSTT1 | cSCC_p4 | Human | Skin | cSCC | 1.79e-02 | -1.78e-01 | -0.2022 |
| Page: 1 2 |
| Tissue | Expression Dynamics | Abbreviation |
| Liver | 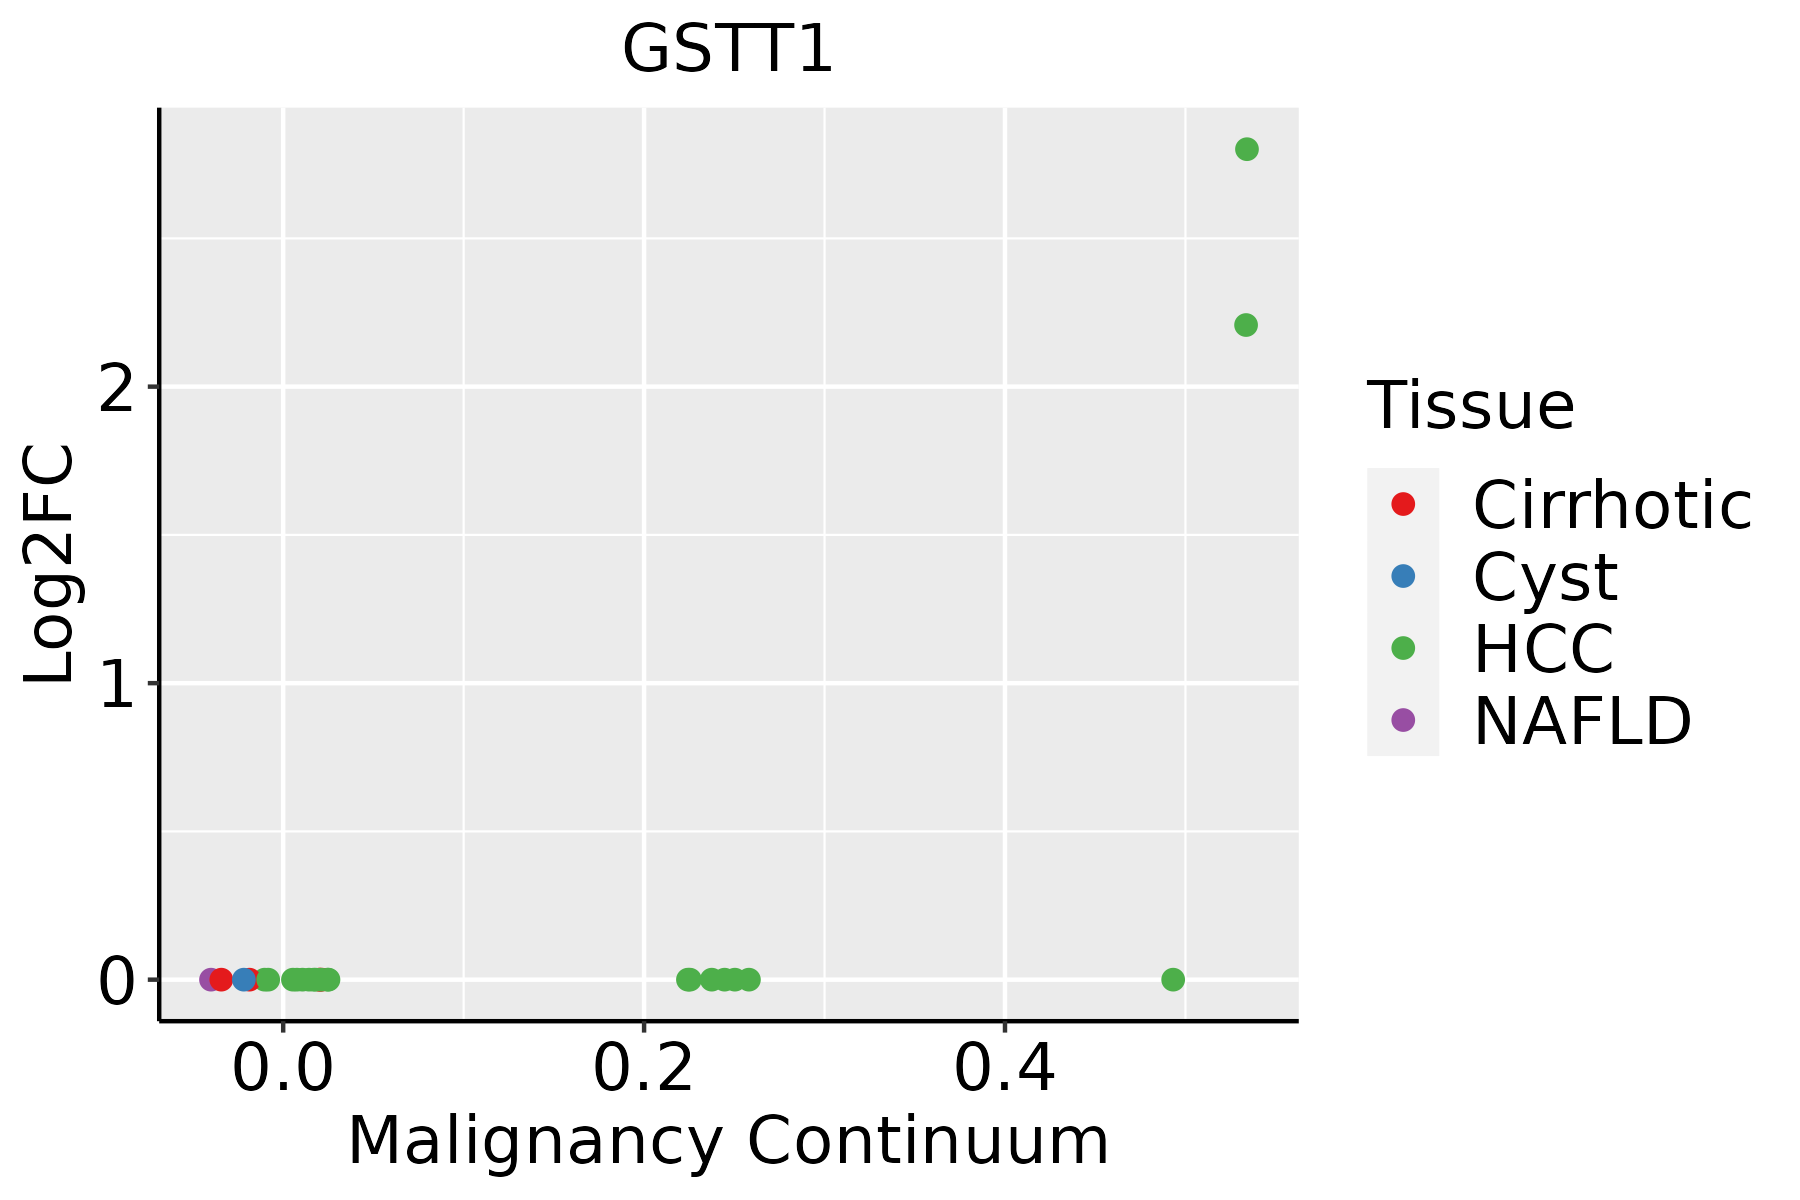 | HCC: Hepatocellular carcinoma |
| NAFLD: Non-alcoholic fatty liver disease | ||
| Prostate |  | BPH: Benign Prostatic Hyperplasia |
| Skin |  | AK: Actinic keratosis |
| cSCC: Cutaneous squamous cell carcinoma | ||
| SCCIS:squamous cell carcinoma in situ |
| ∗log2FC in expression of this searched gene in stem-like cells from each diseased tissue sample relative to stem-like cells in normal samples in each tissue plotted against the malignancy continuum. Samples are colored based on if they are from different disease stage. |
Top |
Malignant transformation related pathway analysis |
| Find out the enriched GO biological processes and KEGG pathways involved in transition from healthy to precancer to cancer |
| Tissue | Disease Stage | Enriched GO biological Processes |
| Colorectum | AD |  |
| Colorectum | SER |  |
| Colorectum | MSS |  |
| Colorectum | MSI-H |  |
| Colorectum | FAP |  |
| ∗Top 15 enriched GO BP terms are showed in the bar plot of each disease state in each tissue. Each row represents a significant GO biological process which is colored according to the -log10(p.adjust). |
| Page: 1 2 3 4 5 6 7 8 9 |
| GO ID | Tissue | Disease Stage | Description | Gene Ratio | Bg Ratio | pvalue | p.adjust | Count |
| GO:000679021 | Liver | HCC | sulfur compound metabolic process | 212/7958 | 339/18723 | 5.60e-14 | 3.39e-12 | 212 |
| GO:000657521 | Liver | HCC | cellular modified amino acid metabolic process | 119/7958 | 188/18723 | 6.47e-09 | 1.67e-07 | 119 |
| GO:000963622 | Liver | HCC | response to toxic substance | 153/7958 | 262/18723 | 1.37e-07 | 2.58e-06 | 153 |
| GO:000674911 | Liver | HCC | glutathione metabolic process | 44/7958 | 64/18723 | 1.95e-05 | 2.09e-04 | 44 |
| GO:199074812 | Liver | HCC | cellular detoxification | 70/7958 | 116/18723 | 7.87e-05 | 7.02e-04 | 70 |
| GO:009723712 | Liver | HCC | cellular response to toxic substance | 74/7958 | 124/18723 | 8.36e-05 | 7.36e-04 | 74 |
| GO:009875412 | Liver | HCC | detoxification | 87/7958 | 152/18723 | 1.70e-04 | 1.35e-03 | 87 |
| GO:009886912 | Liver | HCC | cellular oxidant detoxification | 59/7958 | 101/18723 | 9.00e-04 | 5.31e-03 | 59 |
| GO:000963617 | Prostate | Tumor | response to toxic substance | 70/3246 | 262/18723 | 8.76e-05 | 8.66e-04 | 70 |
| GO:009886917 | Prostate | Tumor | cellular oxidant detoxification | 32/3246 | 101/18723 | 3.06e-04 | 2.47e-03 | 32 |
| GO:009723717 | Prostate | Tumor | cellular response to toxic substance | 37/3246 | 124/18723 | 4.13e-04 | 3.16e-03 | 37 |
| GO:199074817 | Prostate | Tumor | cellular detoxification | 35/3246 | 116/18723 | 4.65e-04 | 3.48e-03 | 35 |
| GO:009875417 | Prostate | Tumor | detoxification | 43/3246 | 152/18723 | 5.27e-04 | 3.85e-03 | 43 |
| GO:00067496 | Prostate | Tumor | glutathione metabolic process | 19/3246 | 64/18723 | 1.03e-02 | 4.31e-02 | 19 |
| GO:000963626 | Skin | AK | response to toxic substance | 42/1910 | 262/18723 | 2.11e-03 | 1.40e-02 | 42 |
| GO:199074826 | Skin | AK | cellular detoxification | 21/1910 | 116/18723 | 6.54e-03 | 3.48e-02 | 21 |
| GO:009723726 | Skin | AK | cellular response to toxic substance | 22/1910 | 124/18723 | 6.97e-03 | 3.63e-02 | 22 |
| GO:00065758 | Skin | cSCC | cellular modified amino acid metabolic process | 73/4864 | 188/18723 | 7.11e-05 | 6.85e-04 | 73 |
| GO:0097237111 | Skin | cSCC | cellular response to toxic substance | 45/4864 | 124/18723 | 7.08e-03 | 3.40e-02 | 45 |
| GO:00067498 | Skin | cSCC | glutathione metabolic process | 26/4864 | 64/18723 | 7.34e-03 | 3.47e-02 | 26 |
| Page: 1 2 |
| Pathway ID | Tissue | Disease Stage | Description | Gene Ratio | Bg Ratio | pvalue | p.adjust | qvalue | Count |
| hsa0520842 | Liver | HCC | Chemical carcinogenesis - reactive oxygen species | 167/4020 | 223/8465 | 2.85e-17 | 1.91e-15 | 1.06e-15 | 167 |
| hsa052258 | Liver | HCC | Hepatocellular carcinoma | 106/4020 | 168/8465 | 2.87e-05 | 1.85e-04 | 1.03e-04 | 106 |
| hsa015242 | Liver | HCC | Platinum drug resistance | 52/4020 | 73/8465 | 3.14e-05 | 1.88e-04 | 1.04e-04 | 52 |
| hsa0048022 | Liver | HCC | Glutathione metabolism | 42/4020 | 57/8465 | 5.00e-05 | 2.62e-04 | 1.46e-04 | 42 |
| hsa0541842 | Liver | HCC | Fluid shear stress and atherosclerosis | 89/4020 | 139/8465 | 5.58e-05 | 2.88e-04 | 1.60e-04 | 89 |
| hsa009832 | Liver | HCC | Drug metabolism - other enzymes | 54/4020 | 80/8465 | 2.25e-04 | 1.09e-03 | 6.08e-04 | 54 |
| hsa0520852 | Liver | HCC | Chemical carcinogenesis - reactive oxygen species | 167/4020 | 223/8465 | 2.85e-17 | 1.91e-15 | 1.06e-15 | 167 |
| hsa0522511 | Liver | HCC | Hepatocellular carcinoma | 106/4020 | 168/8465 | 2.87e-05 | 1.85e-04 | 1.03e-04 | 106 |
| hsa015243 | Liver | HCC | Platinum drug resistance | 52/4020 | 73/8465 | 3.14e-05 | 1.88e-04 | 1.04e-04 | 52 |
| hsa0048032 | Liver | HCC | Glutathione metabolism | 42/4020 | 57/8465 | 5.00e-05 | 2.62e-04 | 1.46e-04 | 42 |
| hsa0541852 | Liver | HCC | Fluid shear stress and atherosclerosis | 89/4020 | 139/8465 | 5.58e-05 | 2.88e-04 | 1.60e-04 | 89 |
| hsa009833 | Liver | HCC | Drug metabolism - other enzymes | 54/4020 | 80/8465 | 2.25e-04 | 1.09e-03 | 6.08e-04 | 54 |
| hsa0520829 | Prostate | Tumor | Chemical carcinogenesis - reactive oxygen species | 113/1791 | 223/8465 | 5.17e-23 | 1.90e-21 | 1.18e-21 | 113 |
| hsa0541829 | Prostate | Tumor | Fluid shear stress and atherosclerosis | 58/1791 | 139/8465 | 2.70e-08 | 3.44e-07 | 2.13e-07 | 58 |
| hsa0152421 | Prostate | Tumor | Platinum drug resistance | 25/1791 | 73/8465 | 6.47e-03 | 2.16e-02 | 1.34e-02 | 25 |
| hsa0520837 | Prostate | Tumor | Chemical carcinogenesis - reactive oxygen species | 113/1791 | 223/8465 | 5.17e-23 | 1.90e-21 | 1.18e-21 | 113 |
| hsa0541837 | Prostate | Tumor | Fluid shear stress and atherosclerosis | 58/1791 | 139/8465 | 2.70e-08 | 3.44e-07 | 2.13e-07 | 58 |
| hsa0152431 | Prostate | Tumor | Platinum drug resistance | 25/1791 | 73/8465 | 6.47e-03 | 2.16e-02 | 1.34e-02 | 25 |
| Page: 1 |
Top |
Cell-cell communication analysis |
| Identification of potential cell-cell interactions between two cell types and their ligand-receptor pairs for different disease states |
| Ligand | Receptor | LRpair | Pathway | Tissue | Disease Stage |
| Page: 1 |
Top |
Single-cell gene regulatory network inference analysis |
| Find out the significant the regulons (TFs) and the target genes of each regulon across cell types for different disease states |
| TF | Cell Type | Tissue | Disease Stage | Target Gene | RSS | Regulon Activity |
| ∗The dot plots of a searched regulon are shown for all cell subpopulations in each disease state of each tissue based on the regulon specific score inferred using pySCENIC and by calculating the average expression. |
| Page: 1 |
Top |
Somatic mutation of malignant transformation related genes |
| Annotation of somatic variants for genes involved in malignant transformation |
| Hugo Symbol | Variant Class | Variant Classification | dbSNP RS | HGVSc | HGVSp | HGVSp Short | SWISSPROT | BIOTYPE | SIFT | PolyPhen | Tumor Sample Barcode | Tissue | Histology | Sex | Age | Stage | Therapy Types | Drugs | Outcome |
| Page: 1 |
Top |
Related drugs of malignant transformation related genes |
| Identification of chemicals and drugs interact with genes involved in malignant transfromation |
| (DGIdb 4.0) |
| Entrez ID | Symbol | Category | Interaction Types | Drug Claim Name | Drug Name | PMIDs |
| 2952 | GSTT1 | DRUGGABLE GENOME | PACLITAXEL | PACLITAXEL | 12851839 | |
| 2952 | GSTT1 | DRUGGABLE GENOME | imatinib | IMATINIB | 25188725 | |
| 2952 | GSTT1 | DRUGGABLE GENOME | BPDE | 11731429,10607731 | ||
| 2952 | GSTT1 | DRUGGABLE GENOME | ERYTHROPOIETIN | EPOETIN BETA | 15595630 | |
| 2952 | GSTT1 | DRUGGABLE GENOME | troglitazone | TROGLITAZONE | 12732844 | |
| 2952 | GSTT1 | DRUGGABLE GENOME | etoposide | ETOPOSIDE | ||
| 2952 | GSTT1 | DRUGGABLE GENOME | clozapine | CLOZAPINE | 27168101 | |
| 2952 | GSTT1 | DRUGGABLE GENOME | xenobiotics | 9285043,9851677,11317340 | ||
| 2952 | GSTT1 | DRUGGABLE GENOME | thalidomide | THALIDOMIDE | 21435719 | |
| 2952 | GSTT1 | DRUGGABLE GENOME | CISPLATINUM | CISPLATIN | 12851839 |
| Page: 1 2 |

Copyright 2023-Present -The University of Texas Health Science Center at Houston |