
|
|||||
|
 | |
| |
| |
| |
| |
| |
|
Gene: GSTO2 |
Gene summary for GSTO2 |
| Gene information | Species | Human | Gene symbol | GSTO2 | Gene ID | 119391 |
| Gene name | glutathione S-transferase omega 2 | |
| Gene Alias | GSTO 2-2 | |
| Cytomap | 10q25.1 | |
| Gene Type | protein-coding | GO ID | GO:0005975 | UniProtAcc | Q9H4Y5 |
Top |
Malignant transformation analysis |
| Identification of the aberrant gene expression in precancerous and cancerous lesions by comparing the gene expression of stem-like cells in diseased tissues with normal stem cells |
| Entrez ID | Symbol | Replicates | Species | Organ | Tissue | Adj P-value | Log2FC | Malignancy |
| 119391 | GSTO2 | LZE4T | Human | Esophagus | ESCC | 3.08e-09 | 1.63e-01 | 0.0811 |
| 119391 | GSTO2 | LZE5T | Human | Esophagus | ESCC | 5.08e-05 | 2.99e-01 | 0.0514 |
| 119391 | GSTO2 | LZE24T | Human | Esophagus | ESCC | 6.48e-16 | 5.56e-01 | 0.0596 |
| 119391 | GSTO2 | P1T-E | Human | Esophagus | ESCC | 3.86e-03 | 3.15e-02 | 0.0875 |
| 119391 | GSTO2 | P2T-E | Human | Esophagus | ESCC | 4.65e-22 | 4.93e-01 | 0.1177 |
| 119391 | GSTO2 | P4T-E | Human | Esophagus | ESCC | 1.04e-29 | 8.28e-01 | 0.1323 |
| 119391 | GSTO2 | P5T-E | Human | Esophagus | ESCC | 4.93e-38 | 8.51e-01 | 0.1327 |
| 119391 | GSTO2 | P10T-E | Human | Esophagus | ESCC | 2.47e-05 | -1.56e-02 | 0.116 |
| 119391 | GSTO2 | P12T-E | Human | Esophagus | ESCC | 1.49e-34 | 7.77e-01 | 0.1122 |
| 119391 | GSTO2 | P15T-E | Human | Esophagus | ESCC | 4.06e-21 | 5.19e-01 | 0.1149 |
| 119391 | GSTO2 | P16T-E | Human | Esophagus | ESCC | 4.72e-28 | 4.81e-01 | 0.1153 |
| 119391 | GSTO2 | P20T-E | Human | Esophagus | ESCC | 4.10e-18 | 4.22e-01 | 0.1124 |
| 119391 | GSTO2 | P21T-E | Human | Esophagus | ESCC | 5.29e-35 | 6.77e-01 | 0.1617 |
| 119391 | GSTO2 | P22T-E | Human | Esophagus | ESCC | 3.96e-03 | -1.32e-01 | 0.1236 |
| 119391 | GSTO2 | P23T-E | Human | Esophagus | ESCC | 7.73e-07 | 4.35e-01 | 0.108 |
| 119391 | GSTO2 | P24T-E | Human | Esophagus | ESCC | 2.65e-05 | -8.50e-02 | 0.1287 |
| 119391 | GSTO2 | P26T-E | Human | Esophagus | ESCC | 1.43e-45 | 8.98e-01 | 0.1276 |
| 119391 | GSTO2 | P27T-E | Human | Esophagus | ESCC | 8.66e-24 | 5.34e-01 | 0.1055 |
| 119391 | GSTO2 | P28T-E | Human | Esophagus | ESCC | 4.48e-12 | 2.39e-01 | 0.1149 |
| 119391 | GSTO2 | P31T-E | Human | Esophagus | ESCC | 2.97e-18 | 5.63e-02 | 0.1251 |
| Page: 1 2 3 4 |
| Tissue | Expression Dynamics | Abbreviation |
| Esophagus |  | ESCC: Esophageal squamous cell carcinoma |
| HGIN: High-grade intraepithelial neoplasias | ||
| LGIN: Low-grade intraepithelial neoplasias | ||
| Liver | 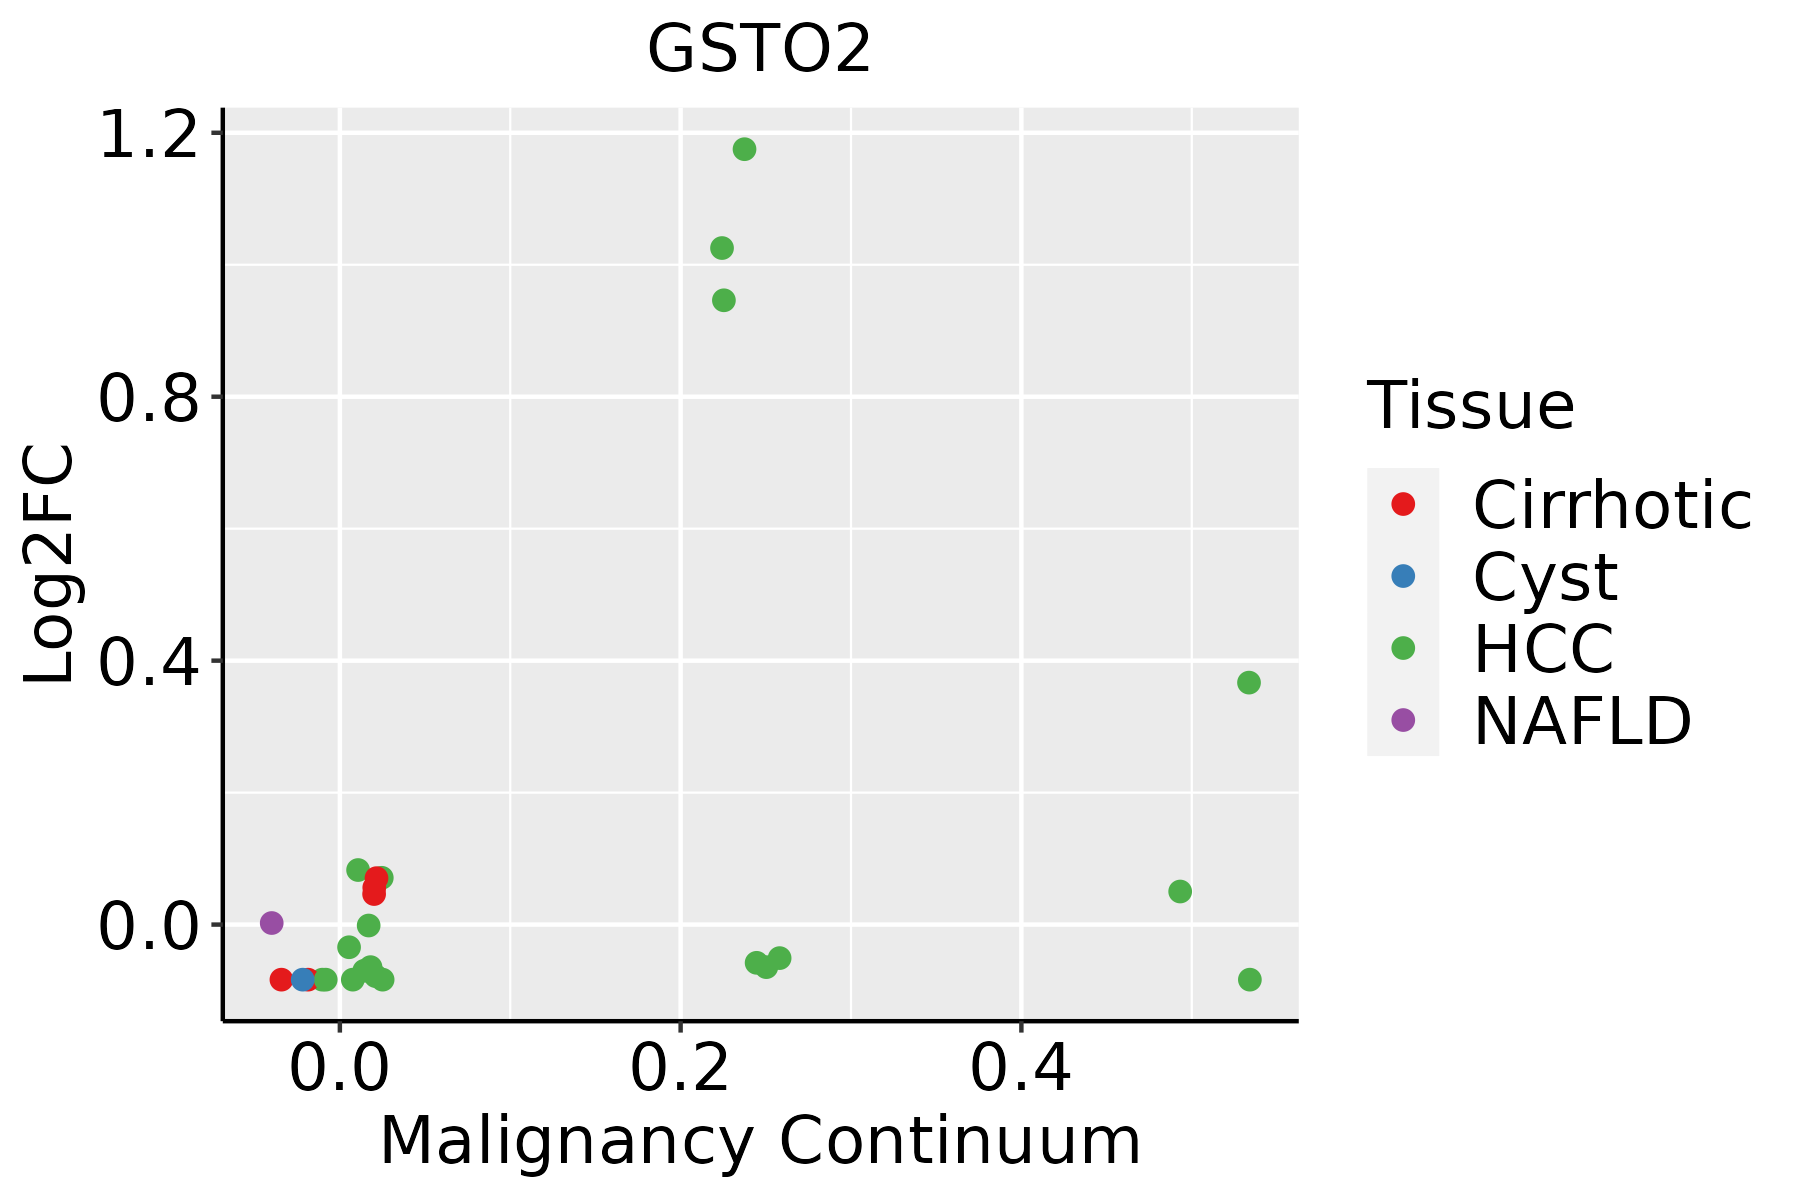 | HCC: Hepatocellular carcinoma |
| NAFLD: Non-alcoholic fatty liver disease | ||
| Oral Cavity | 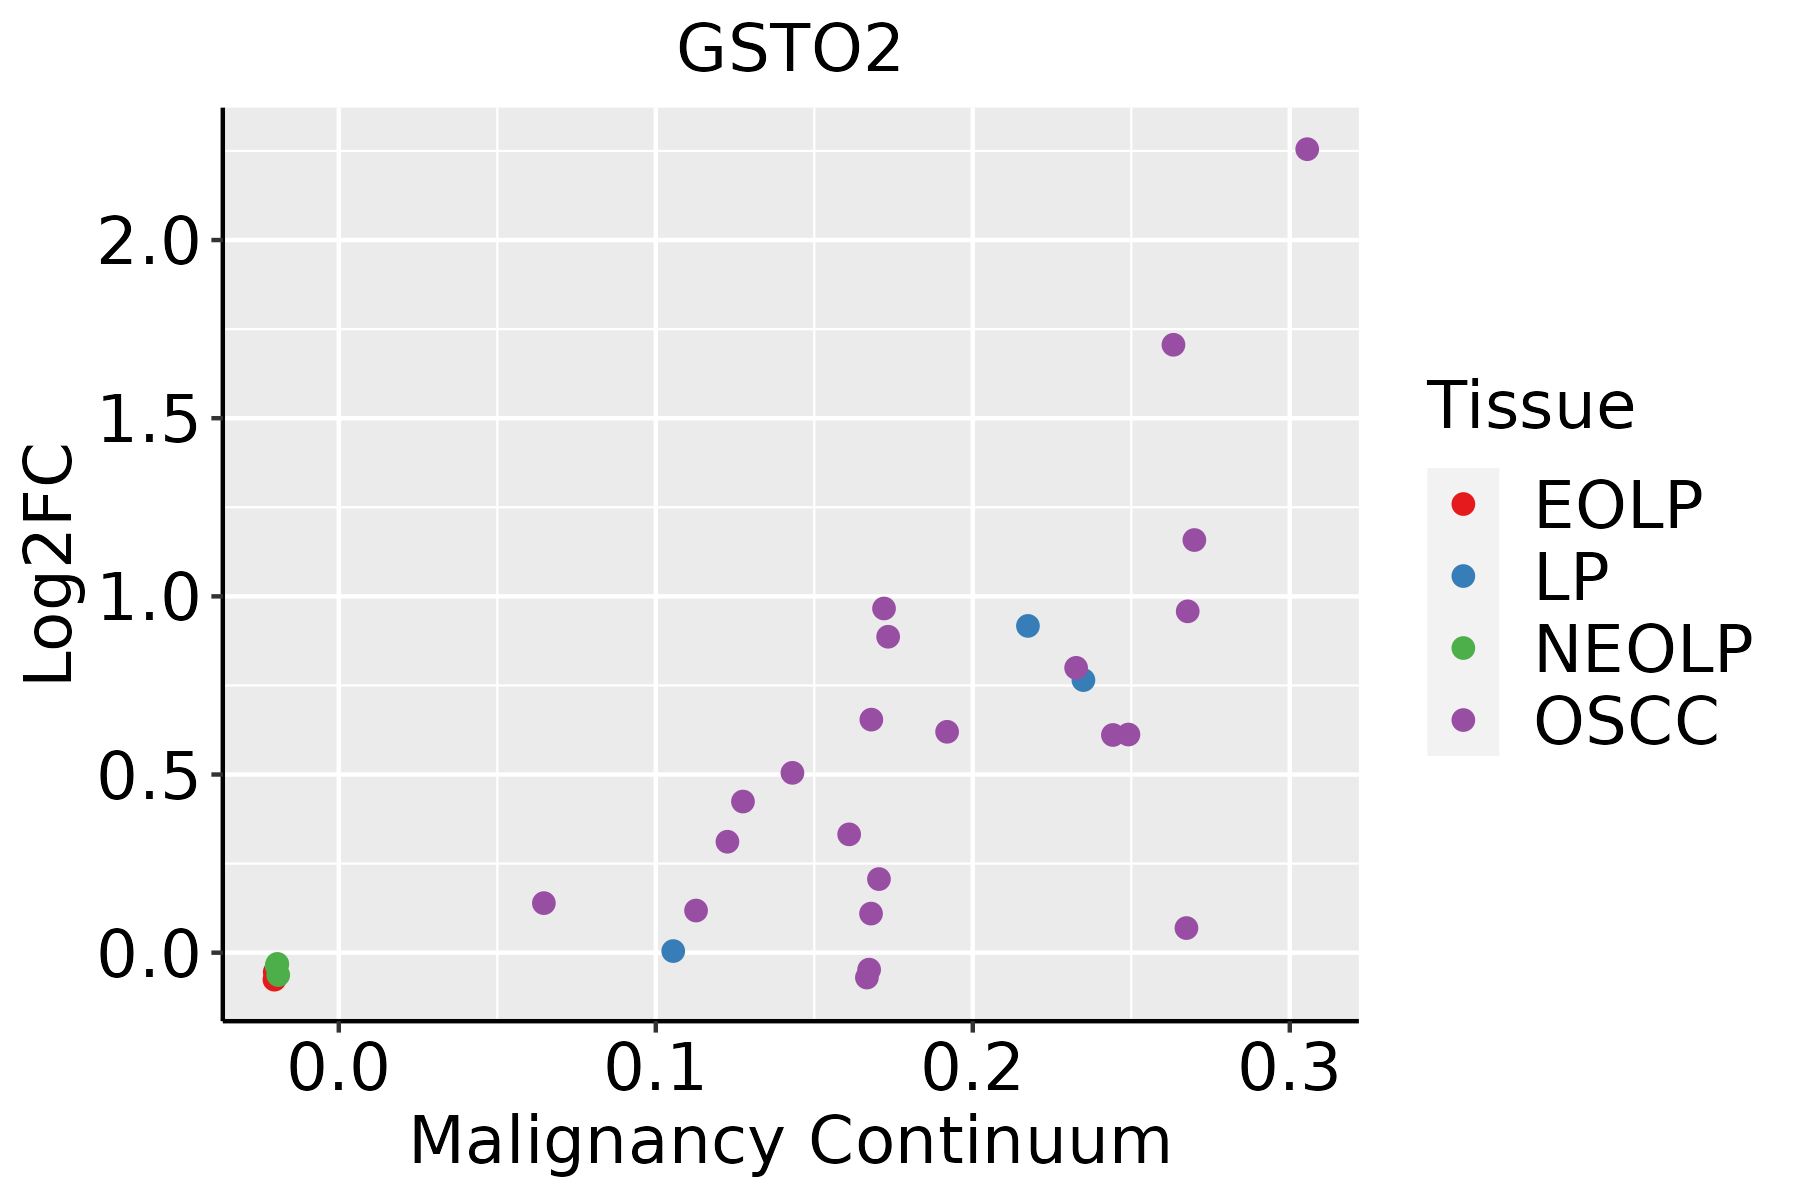 | EOLP: Erosive Oral lichen planus |
| LP: leukoplakia | ||
| NEOLP: Non-erosive oral lichen planus | ||
| OSCC: Oral squamous cell carcinoma | ||
| Prostate |  | BPH: Benign Prostatic Hyperplasia |
| Skin |  | AK: Actinic keratosis |
| cSCC: Cutaneous squamous cell carcinoma | ||
| SCCIS:squamous cell carcinoma in situ |
| ∗log2FC in expression of this searched gene in stem-like cells from each diseased tissue sample relative to stem-like cells in normal samples in each tissue plotted against the malignancy continuum. Samples are colored based on if they are from different disease stage. |
Top |
Malignant transformation related pathway analysis |
| Find out the enriched GO biological processes and KEGG pathways involved in transition from healthy to precancer to cancer |
| Tissue | Disease Stage | Enriched GO biological Processes |
| Colorectum | AD |  |
| Colorectum | SER |  |
| Colorectum | MSS |  |
| Colorectum | MSI-H |  |
| Colorectum | FAP |  |
| ∗Top 15 enriched GO BP terms are showed in the bar plot of each disease state in each tissue. Each row represents a significant GO biological process which is colored according to the -log10(p.adjust). |
| Page: 1 2 3 4 5 6 7 8 9 |
| GO ID | Tissue | Disease Stage | Description | Gene Ratio | Bg Ratio | pvalue | p.adjust | Count |
| GO:004668514 | Esophagus | ESCC | response to arsenic-containing substance | 30/8552 | 33/18723 | 5.73e-08 | 1.02e-06 | 30 |
| GO:00059969 | Esophagus | ESCC | monosaccharide metabolic process | 159/8552 | 257/18723 | 1.11e-07 | 1.81e-06 | 159 |
| GO:00067906 | Esophagus | ESCC | sulfur compound metabolic process | 201/8552 | 339/18723 | 2.64e-07 | 3.94e-06 | 201 |
| GO:007124316 | Esophagus | ESCC | cellular response to arsenic-containing substance | 19/8552 | 20/18723 | 3.83e-06 | 4.14e-05 | 19 |
| GO:000941020 | Esophagus | ESCC | response to xenobiotic stimulus | 253/8552 | 462/18723 | 4.55e-05 | 3.58e-04 | 253 |
| GO:00065757 | Esophagus | ESCC | cellular modified amino acid metabolic process | 112/8552 | 188/18723 | 8.31e-05 | 6.06e-04 | 112 |
| GO:000963620 | Esophagus | ESCC | response to toxic substance | 150/8552 | 262/18723 | 1.00e-04 | 7.12e-04 | 150 |
| GO:00067671 | Esophagus | ESCC | water-soluble vitamin metabolic process | 41/8552 | 59/18723 | 1.84e-04 | 1.17e-03 | 41 |
| GO:00067661 | Esophagus | ESCC | vitamin metabolic process | 67/8552 | 106/18723 | 2.03e-04 | 1.28e-03 | 67 |
| GO:000674912 | Esophagus | ESCC | glutathione metabolic process | 42/8552 | 64/18723 | 1.01e-03 | 5.12e-03 | 42 |
| GO:1990748110 | Esophagus | ESCC | cellular detoxification | 70/8552 | 116/18723 | 1.02e-03 | 5.17e-03 | 70 |
| GO:0097237110 | Esophagus | ESCC | cellular response to toxic substance | 72/8552 | 124/18723 | 3.65e-03 | 1.49e-02 | 72 |
| GO:0098869110 | Esophagus | ESCC | cellular oxidant detoxification | 60/8552 | 101/18723 | 3.76e-03 | 1.53e-02 | 60 |
| GO:000679021 | Liver | HCC | sulfur compound metabolic process | 212/7958 | 339/18723 | 5.60e-14 | 3.39e-12 | 212 |
| GO:000599621 | Liver | HCC | monosaccharide metabolic process | 167/7958 | 257/18723 | 2.31e-13 | 1.25e-11 | 167 |
| GO:000657521 | Liver | HCC | cellular modified amino acid metabolic process | 119/7958 | 188/18723 | 6.47e-09 | 1.67e-07 | 119 |
| GO:000963622 | Liver | HCC | response to toxic substance | 153/7958 | 262/18723 | 1.37e-07 | 2.58e-06 | 153 |
| GO:000941022 | Liver | HCC | response to xenobiotic stimulus | 248/7958 | 462/18723 | 6.47e-07 | 1.02e-05 | 248 |
| GO:004668511 | Liver | HCC | response to arsenic-containing substance | 28/7958 | 33/18723 | 6.57e-07 | 1.03e-05 | 28 |
| GO:007124311 | Liver | HCC | cellular response to arsenic-containing substance | 19/7958 | 20/18723 | 1.03e-06 | 1.54e-05 | 19 |
| Page: 1 2 3 4 |
| Pathway ID | Tissue | Disease Stage | Description | Gene Ratio | Bg Ratio | pvalue | p.adjust | qvalue | Count |
| hsa05208211 | Esophagus | ESCC | Chemical carcinogenesis - reactive oxygen species | 168/4205 | 223/8465 | 1.83e-15 | 6.81e-14 | 3.49e-14 | 168 |
| hsa05418211 | Esophagus | ESCC | Fluid shear stress and atherosclerosis | 109/4205 | 139/8465 | 2.00e-12 | 3.72e-11 | 1.90e-11 | 109 |
| hsa015247 | Esophagus | ESCC | Platinum drug resistance | 56/4205 | 73/8465 | 1.85e-06 | 1.13e-05 | 5.78e-06 | 56 |
| hsa0048018 | Esophagus | ESCC | Glutathione metabolism | 44/4205 | 57/8465 | 1.81e-05 | 9.03e-05 | 4.63e-05 | 44 |
| hsa0522518 | Esophagus | ESCC | Hepatocellular carcinoma | 109/4205 | 168/8465 | 4.27e-05 | 1.88e-04 | 9.64e-05 | 109 |
| hsa05208310 | Esophagus | ESCC | Chemical carcinogenesis - reactive oxygen species | 168/4205 | 223/8465 | 1.83e-15 | 6.81e-14 | 3.49e-14 | 168 |
| hsa05418310 | Esophagus | ESCC | Fluid shear stress and atherosclerosis | 109/4205 | 139/8465 | 2.00e-12 | 3.72e-11 | 1.90e-11 | 109 |
| hsa0152414 | Esophagus | ESCC | Platinum drug resistance | 56/4205 | 73/8465 | 1.85e-06 | 1.13e-05 | 5.78e-06 | 56 |
| hsa0048019 | Esophagus | ESCC | Glutathione metabolism | 44/4205 | 57/8465 | 1.81e-05 | 9.03e-05 | 4.63e-05 | 44 |
| hsa0522519 | Esophagus | ESCC | Hepatocellular carcinoma | 109/4205 | 168/8465 | 4.27e-05 | 1.88e-04 | 9.64e-05 | 109 |
| hsa0520842 | Liver | HCC | Chemical carcinogenesis - reactive oxygen species | 167/4020 | 223/8465 | 2.85e-17 | 1.91e-15 | 1.06e-15 | 167 |
| hsa052258 | Liver | HCC | Hepatocellular carcinoma | 106/4020 | 168/8465 | 2.87e-05 | 1.85e-04 | 1.03e-04 | 106 |
| hsa015242 | Liver | HCC | Platinum drug resistance | 52/4020 | 73/8465 | 3.14e-05 | 1.88e-04 | 1.04e-04 | 52 |
| hsa0048022 | Liver | HCC | Glutathione metabolism | 42/4020 | 57/8465 | 5.00e-05 | 2.62e-04 | 1.46e-04 | 42 |
| hsa0541842 | Liver | HCC | Fluid shear stress and atherosclerosis | 89/4020 | 139/8465 | 5.58e-05 | 2.88e-04 | 1.60e-04 | 89 |
| hsa009832 | Liver | HCC | Drug metabolism - other enzymes | 54/4020 | 80/8465 | 2.25e-04 | 1.09e-03 | 6.08e-04 | 54 |
| hsa0520852 | Liver | HCC | Chemical carcinogenesis - reactive oxygen species | 167/4020 | 223/8465 | 2.85e-17 | 1.91e-15 | 1.06e-15 | 167 |
| hsa0522511 | Liver | HCC | Hepatocellular carcinoma | 106/4020 | 168/8465 | 2.87e-05 | 1.85e-04 | 1.03e-04 | 106 |
| hsa015243 | Liver | HCC | Platinum drug resistance | 52/4020 | 73/8465 | 3.14e-05 | 1.88e-04 | 1.04e-04 | 52 |
| hsa0048032 | Liver | HCC | Glutathione metabolism | 42/4020 | 57/8465 | 5.00e-05 | 2.62e-04 | 1.46e-04 | 42 |
| Page: 1 2 3 |
Top |
Cell-cell communication analysis |
| Identification of potential cell-cell interactions between two cell types and their ligand-receptor pairs for different disease states |
| Ligand | Receptor | LRpair | Pathway | Tissue | Disease Stage |
| Page: 1 |
Top |
Single-cell gene regulatory network inference analysis |
| Find out the significant the regulons (TFs) and the target genes of each regulon across cell types for different disease states |
| TF | Cell Type | Tissue | Disease Stage | Target Gene | RSS | Regulon Activity |
| ∗The dot plots of a searched regulon are shown for all cell subpopulations in each disease state of each tissue based on the regulon specific score inferred using pySCENIC and by calculating the average expression. |
| Page: 1 |
Top |
Somatic mutation of malignant transformation related genes |
| Annotation of somatic variants for genes involved in malignant transformation |
| Hugo Symbol | Variant Class | Variant Classification | dbSNP RS | HGVSc | HGVSp | HGVSp Short | SWISSPROT | BIOTYPE | SIFT | PolyPhen | Tumor Sample Barcode | Tissue | Histology | Sex | Age | Stage | Therapy Types | Drugs | Outcome |
| GSTO2 | SNV | Missense_Mutation | c.524N>G | p.Asp175Gly | p.D175G | Q9H4Y5 | protein_coding | deleterious(0) | probably_damaging(1) | TCGA-B6-A0RM-01 | Breast | breast invasive carcinoma | Female | <65 | I/II | Unknown | Unknown | SD | |
| GSTO2 | SNV | Missense_Mutation | c.358N>A | p.Phe120Ile | p.F120I | Q9H4Y5 | protein_coding | deleterious(0) | possibly_damaging(0.891) | TCGA-EW-A1PD-01 | Breast | breast invasive carcinoma | Male | <65 | I/II | Chemotherapy | docetaxel | SD | |
| GSTO2 | SNV | Missense_Mutation | novel | c.331N>A | p.Ala111Thr | p.A111T | Q9H4Y5 | protein_coding | deleterious(0) | probably_damaging(0.999) | TCGA-VS-A957-01 | Cervix | cervical & endocervical cancer | Female | <65 | I/II | Chemotherapy | cisplatin | CR |
| GSTO2 | SNV | Missense_Mutation | novel | c.649N>A | p.Leu217Ile | p.L217I | Q9H4Y5 | protein_coding | tolerated(0.32) | benign(0.001) | TCGA-AG-A002-01 | Colorectum | rectum adenocarcinoma | Male | <65 | I/II | Unknown | Unknown | SD |
| GSTO2 | SNV | Missense_Mutation | novel | c.304N>A | p.Leu102Met | p.L102M | Q9H4Y5 | protein_coding | deleterious(0) | probably_damaging(1) | TCGA-AG-A014-01 | Colorectum | rectum adenocarcinoma | Male | >=65 | I/II | Unknown | Unknown | SD |
| GSTO2 | SNV | Missense_Mutation | novel | c.116N>A | p.Arg39His | p.R39H | Q9H4Y5 | protein_coding | deleterious(0.03) | benign(0.354) | TCGA-A5-A0G2-01 | Endometrium | uterine corpus endometrioid carcinoma | Female | <65 | III/IV | Unknown | Unknown | SD |
| GSTO2 | SNV | Missense_Mutation | novel | c.266N>G | p.Ala89Gly | p.A89G | Q9H4Y5 | protein_coding | deleterious(0) | benign(0.207) | TCGA-A5-A2K5-01 | Endometrium | uterine corpus endometrioid carcinoma | Female | >=65 | I/II | Unknown | Unknown | SD |
| GSTO2 | SNV | Missense_Mutation | novel | c.74G>A | p.Arg25His | p.R25H | Q9H4Y5 | protein_coding | deleterious(0) | probably_damaging(0.997) | TCGA-AP-A1DV-01 | Endometrium | uterine corpus endometrioid carcinoma | Female | <65 | I/II | Unknown | Unknown | SD |
| GSTO2 | SNV | Missense_Mutation | novel | c.154N>A | p.Val52Ile | p.V52I | Q9H4Y5 | protein_coding | tolerated(1) | benign(0.022) | TCGA-AX-A1CE-01 | Endometrium | uterine corpus endometrioid carcinoma | Female | <65 | I/II | Unspecific | Paclitaxel | SD |
| GSTO2 | SNV | Missense_Mutation | rs776871728 | c.101N>G | p.Tyr34Cys | p.Y34C | Q9H4Y5 | protein_coding | deleterious(0.02) | benign(0.072) | TCGA-B5-A3FC-01 | Endometrium | uterine corpus endometrioid carcinoma | Female | <65 | I/II | Unknown | Unknown | SD |
| Page: 1 2 3 |
Top |
Related drugs of malignant transformation related genes |
| Identification of chemicals and drugs interact with genes involved in malignant transfromation |
| (DGIdb 4.0) |
| Entrez ID | Symbol | Category | Interaction Types | Drug Claim Name | Drug Name | PMIDs |
| Page: 1 |

Copyright 2023-Present -The University of Texas Health Science Center at Houston |