| Tissue | Expression Dynamics | Abbreviation |
| Cervix | 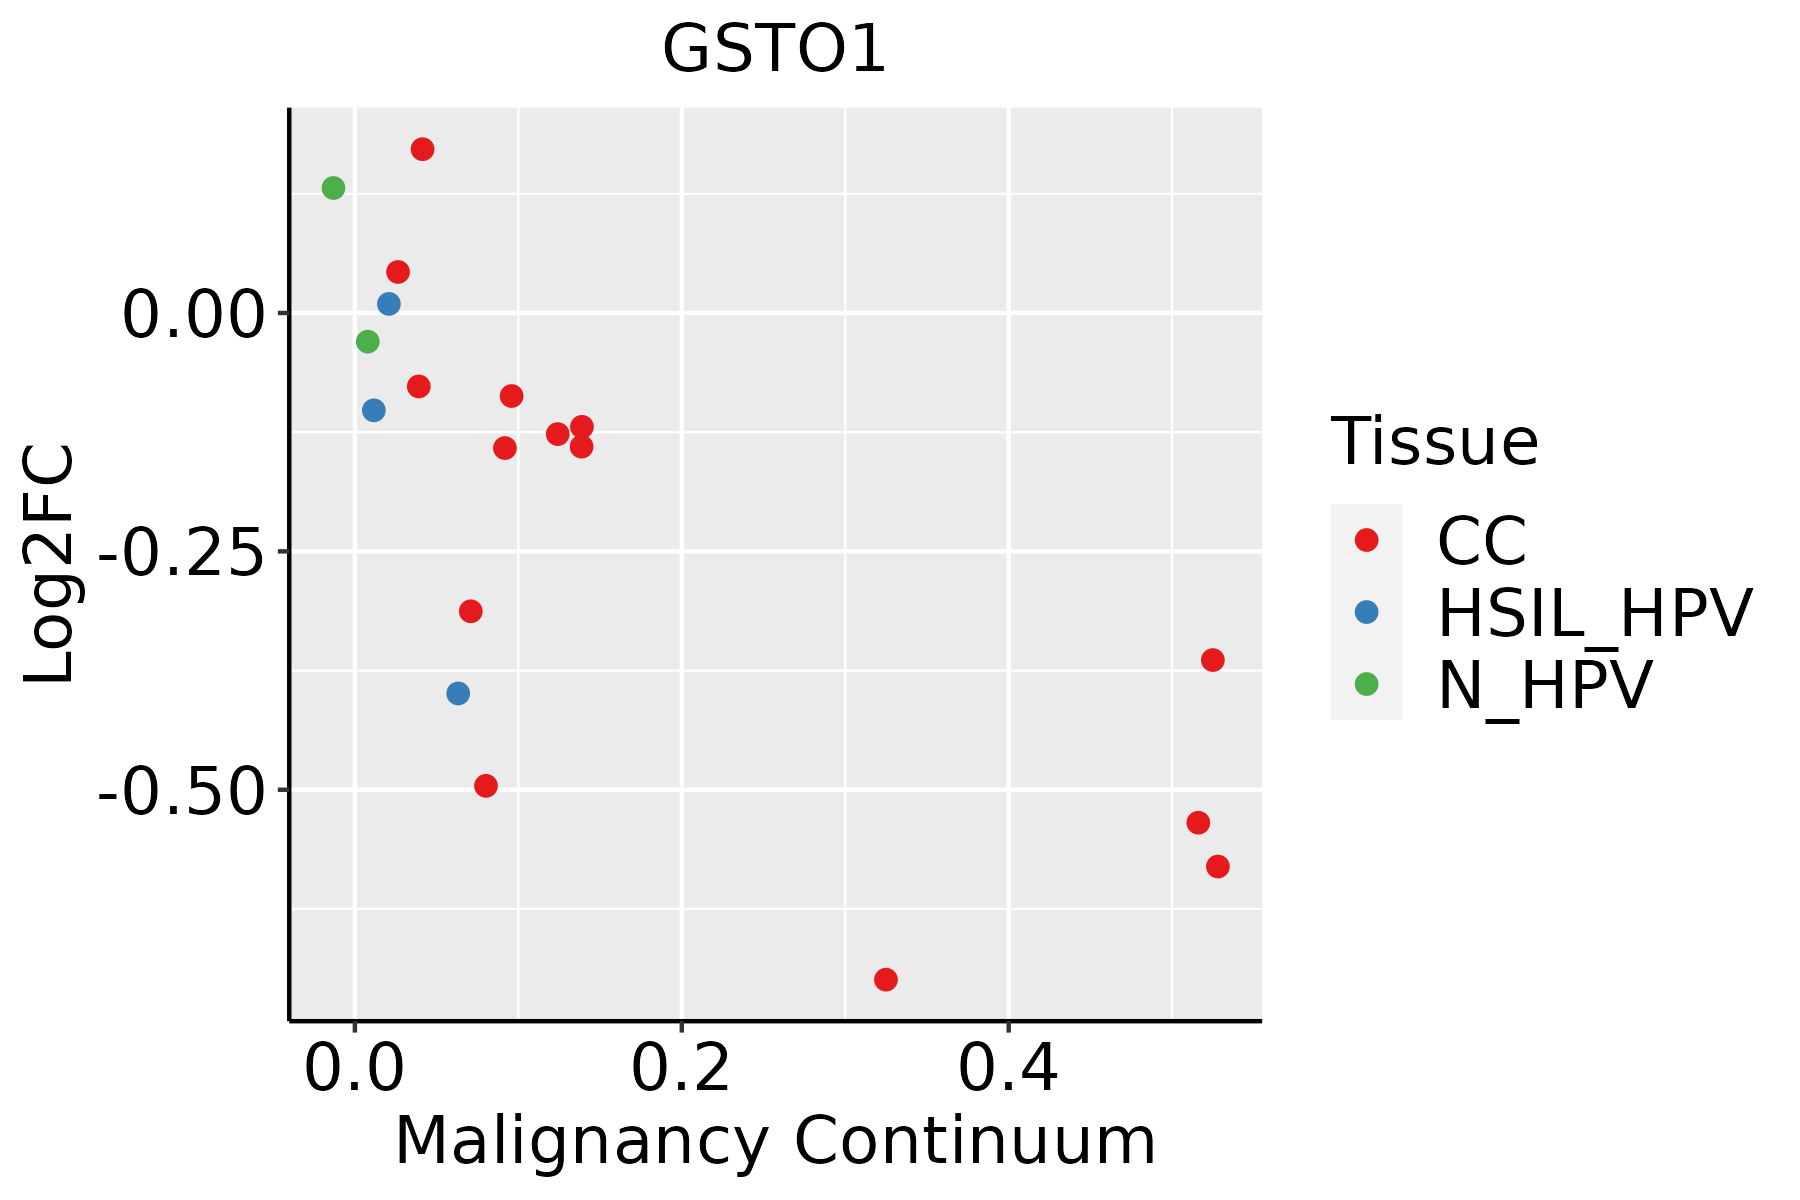 | CC: Cervix cancer |
| HSIL_HPV: HPV-infected high-grade squamous intraepithelial lesions |
| N_HPV: HPV-infected normal cervix |
| Colorectum (GSE201348) |  | FAP: Familial adenomatous polyposis |
| CRC: Colorectal cancer |
| Colorectum (HTA11) |  | AD: Adenomas |
| SER: Sessile serrated lesions |
| MSI-H: Microsatellite-high colorectal cancer |
| MSS: Microsatellite stable colorectal cancer |
| Endometrium | 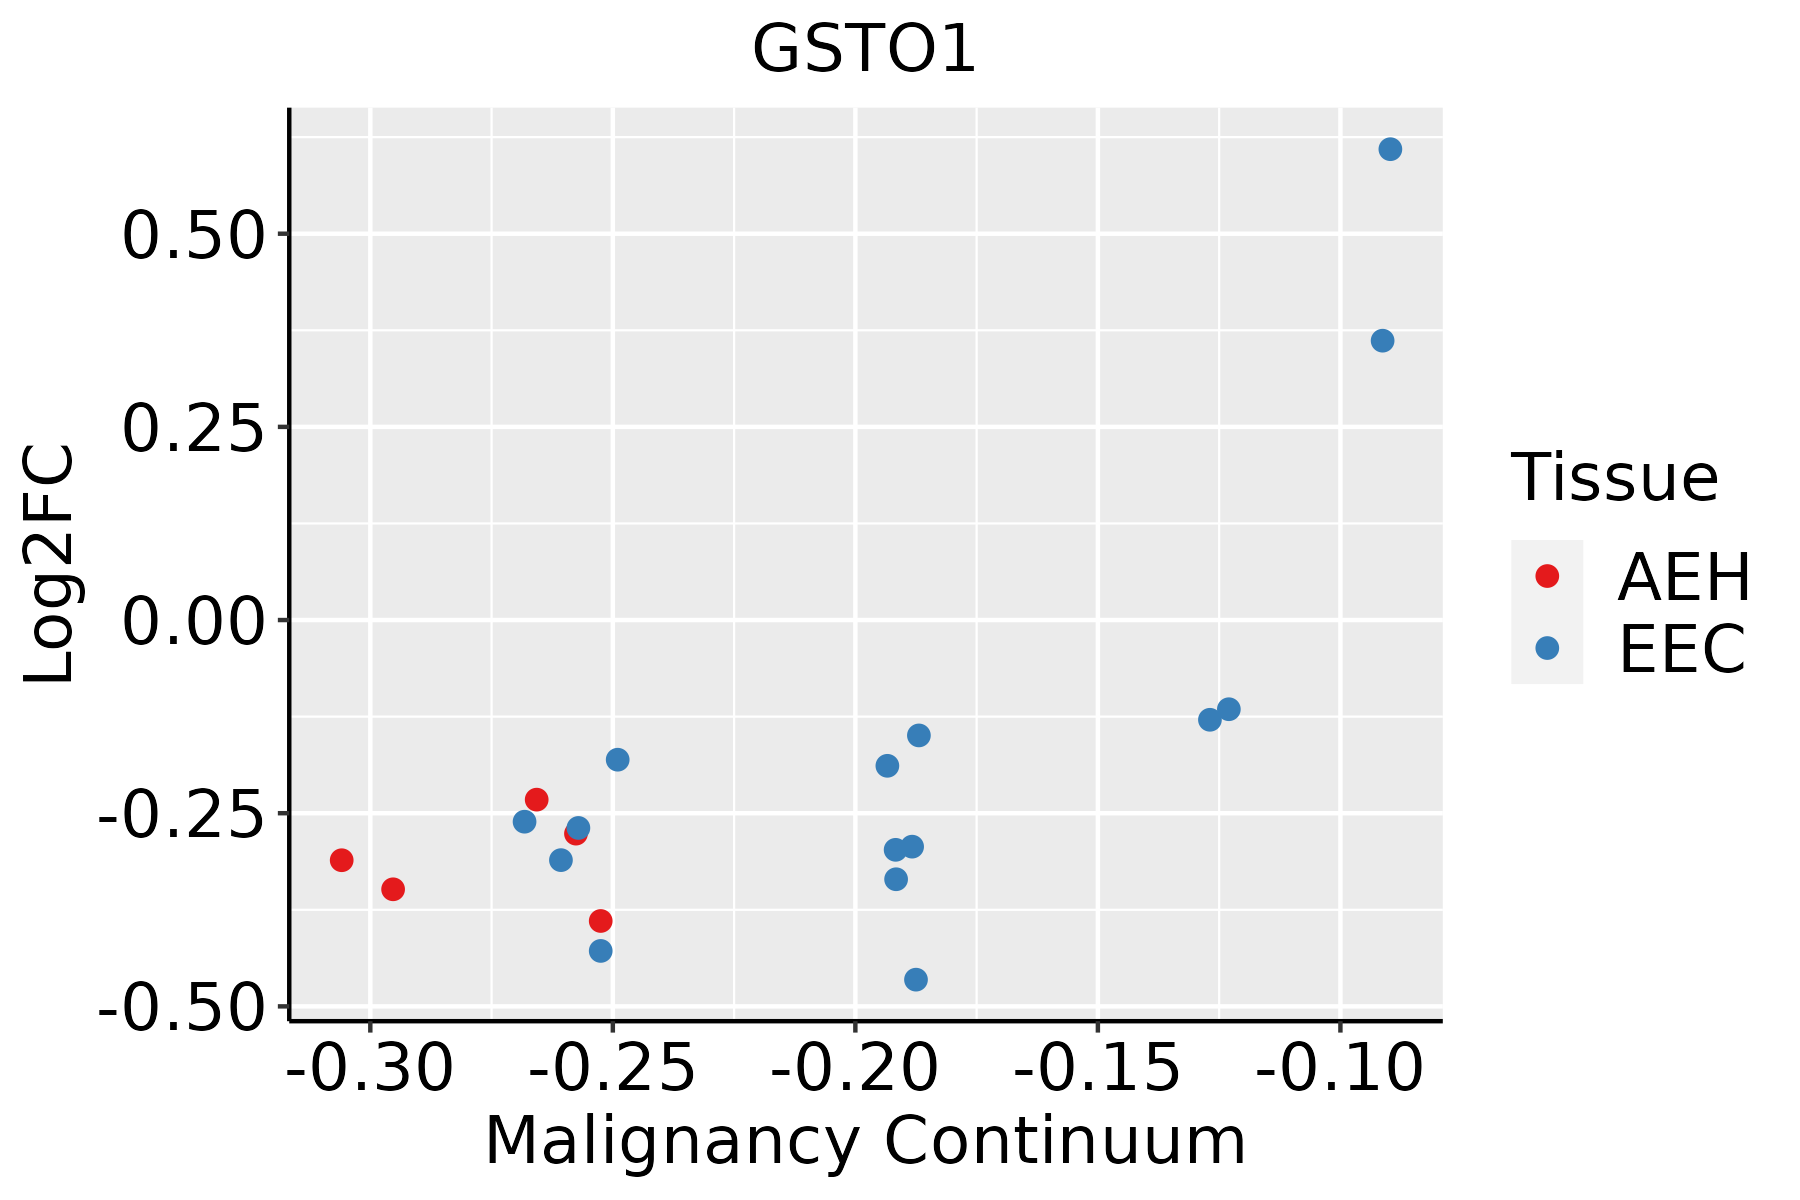 | AEH: Atypical endometrial hyperplasia |
| EEC: Endometrioid Cancer |
| Esophagus | 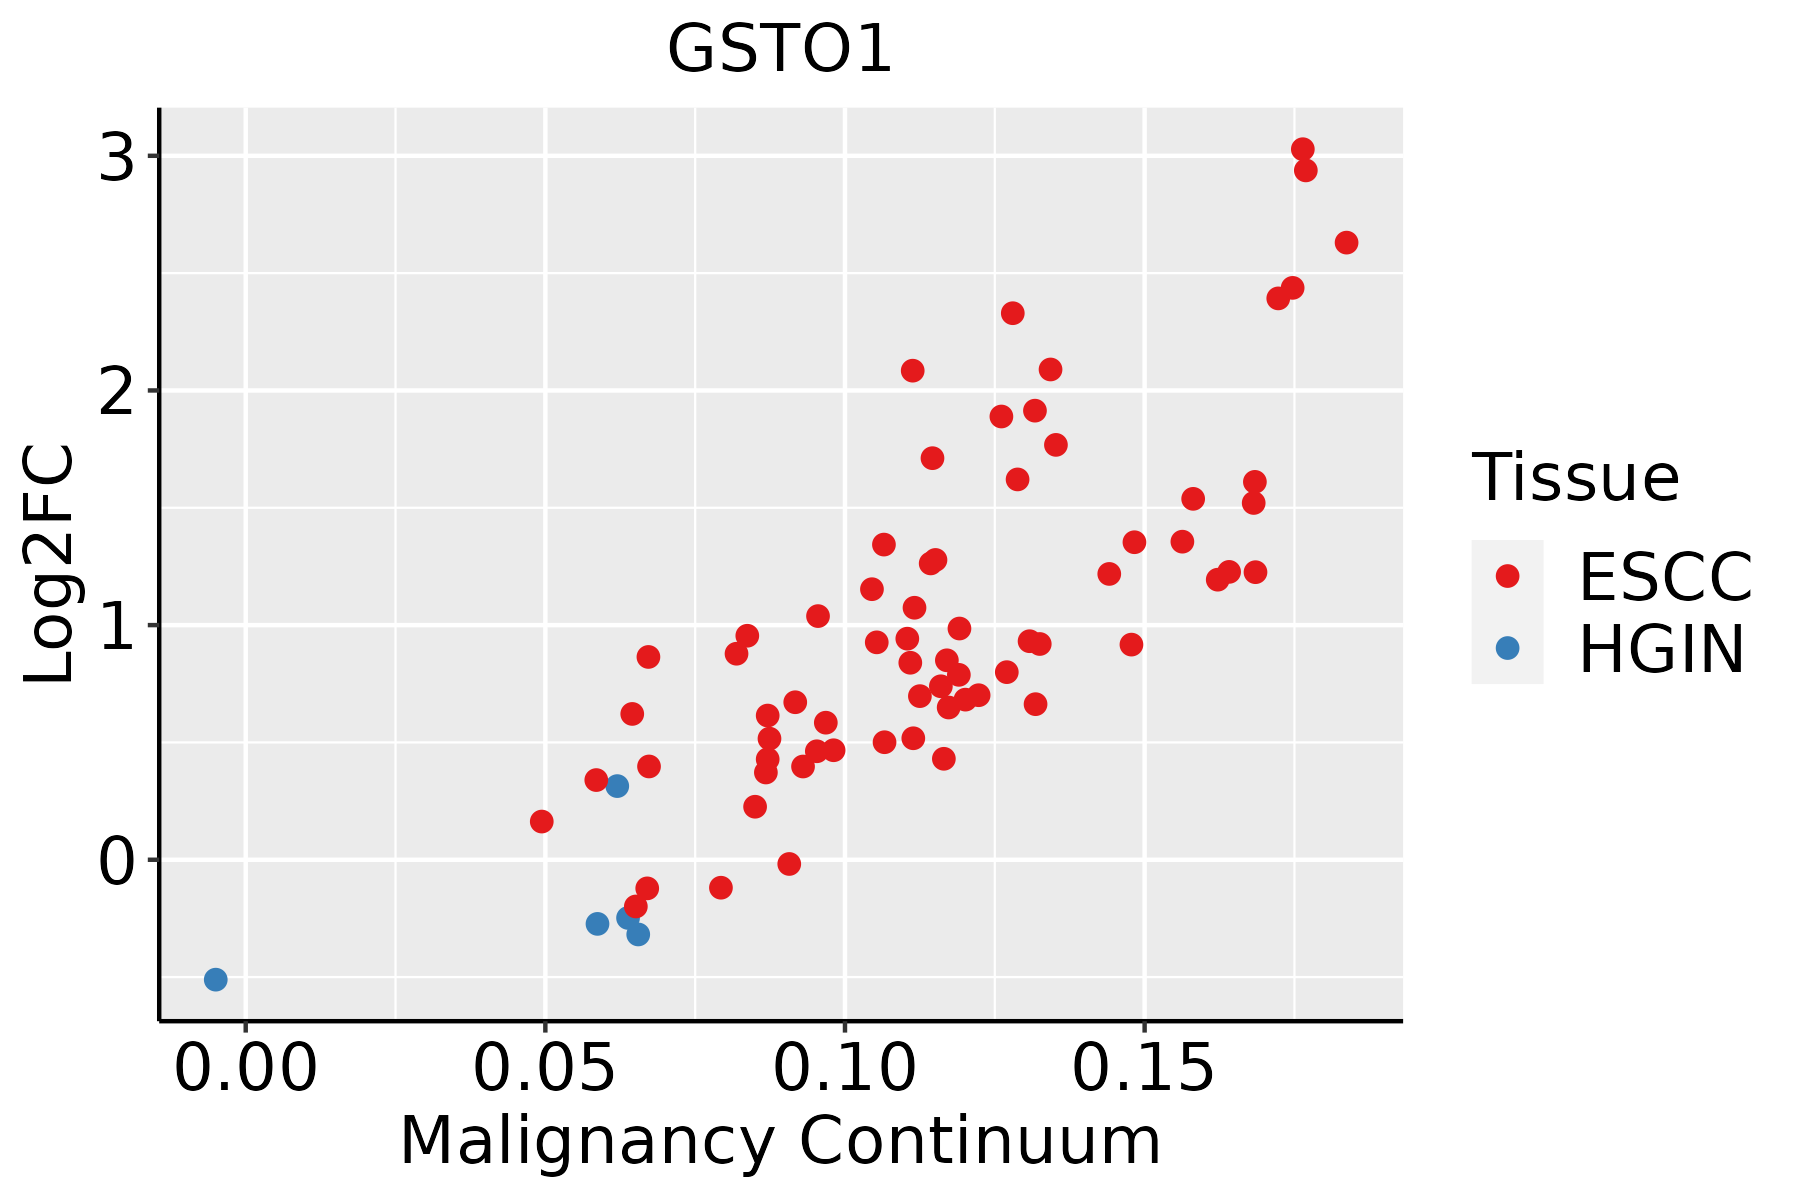 | ESCC: Esophageal squamous cell carcinoma |
| HGIN: High-grade intraepithelial neoplasias |
| LGIN: Low-grade intraepithelial neoplasias |
| GC | 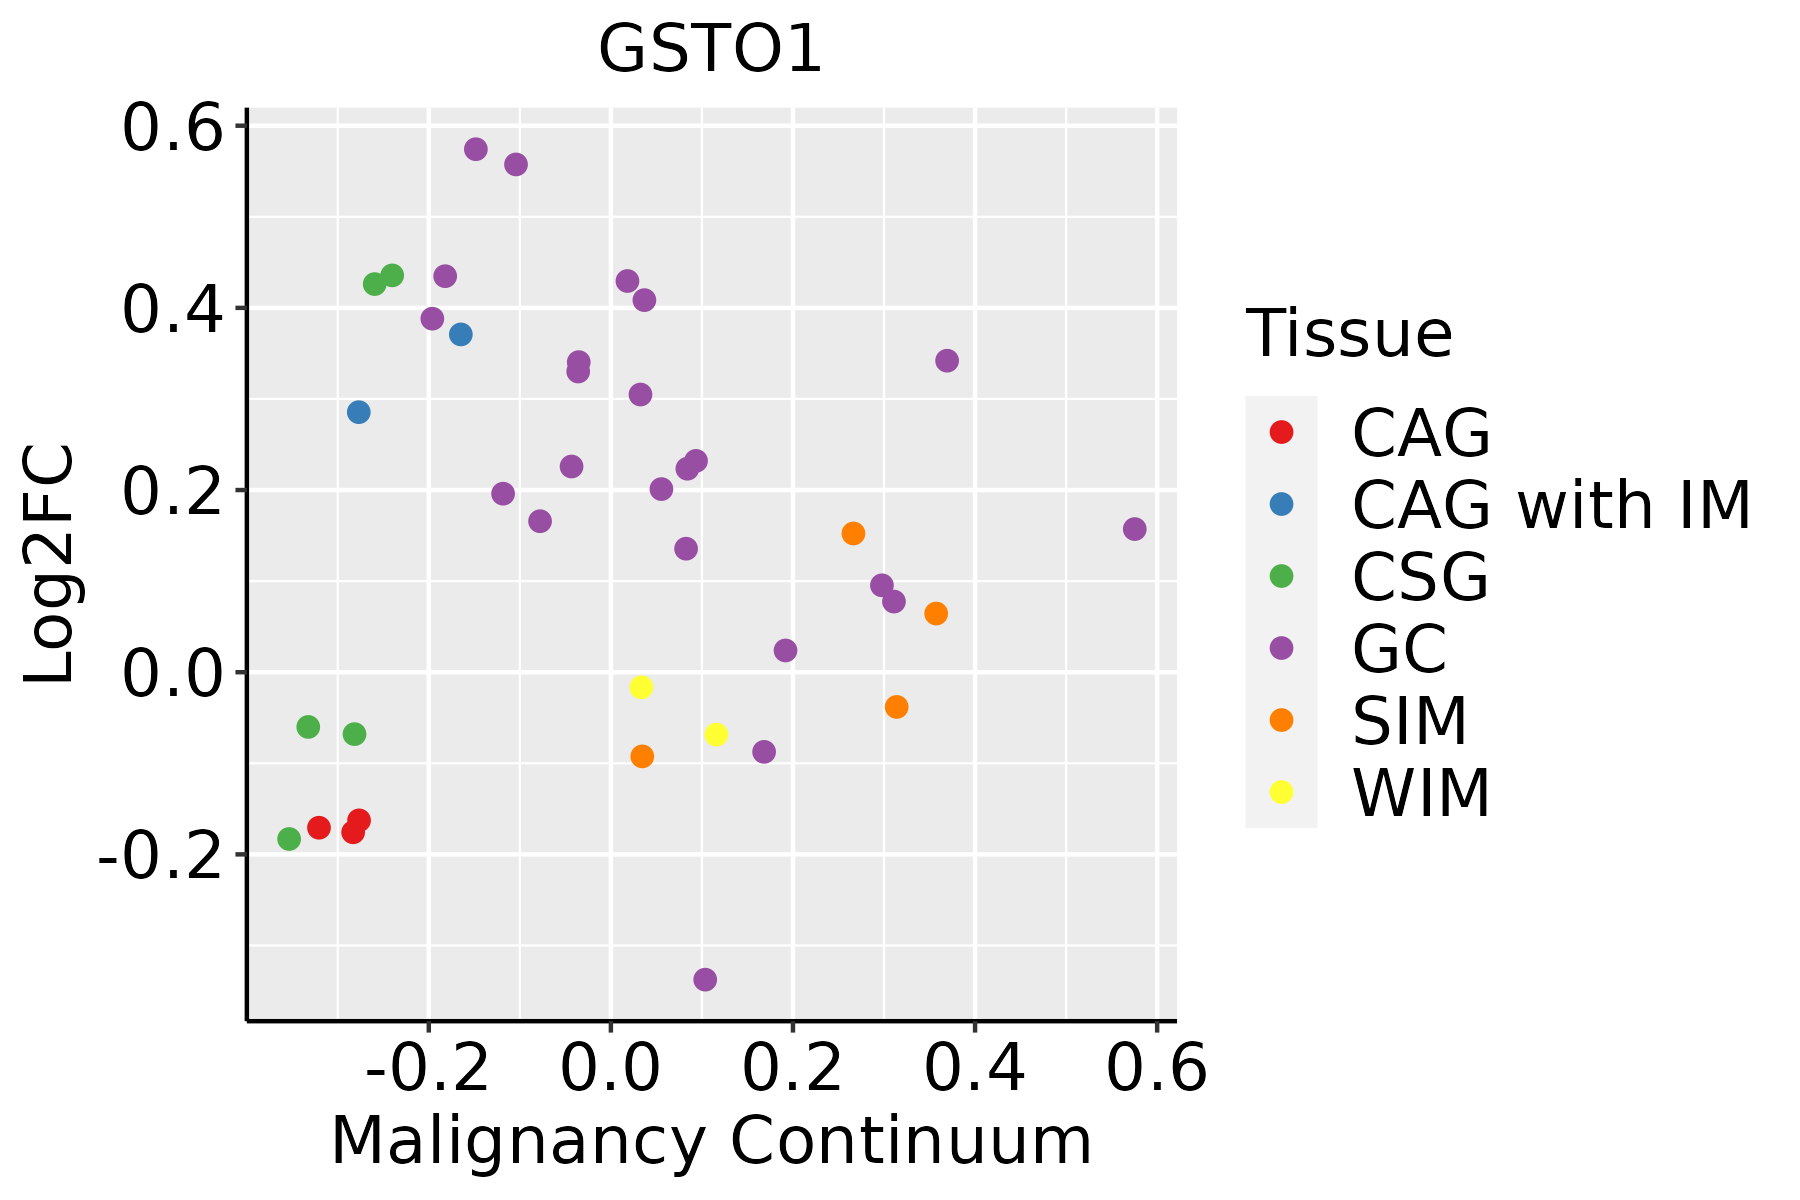 | CAG: Chronic atrophic gastritis |
| CAG with IM: Chronic atrophic gastritis with intestinal metaplasia |
| CSG: Chronic superficial gastritis |
| GC: Gastric cancer |
| SIM: Severe intestinal metaplasia |
| WIM: Wild intestinal metaplasia |
| Liver |  | HCC: Hepatocellular carcinoma |
| NAFLD: Non-alcoholic fatty liver disease |
| Oral Cavity | 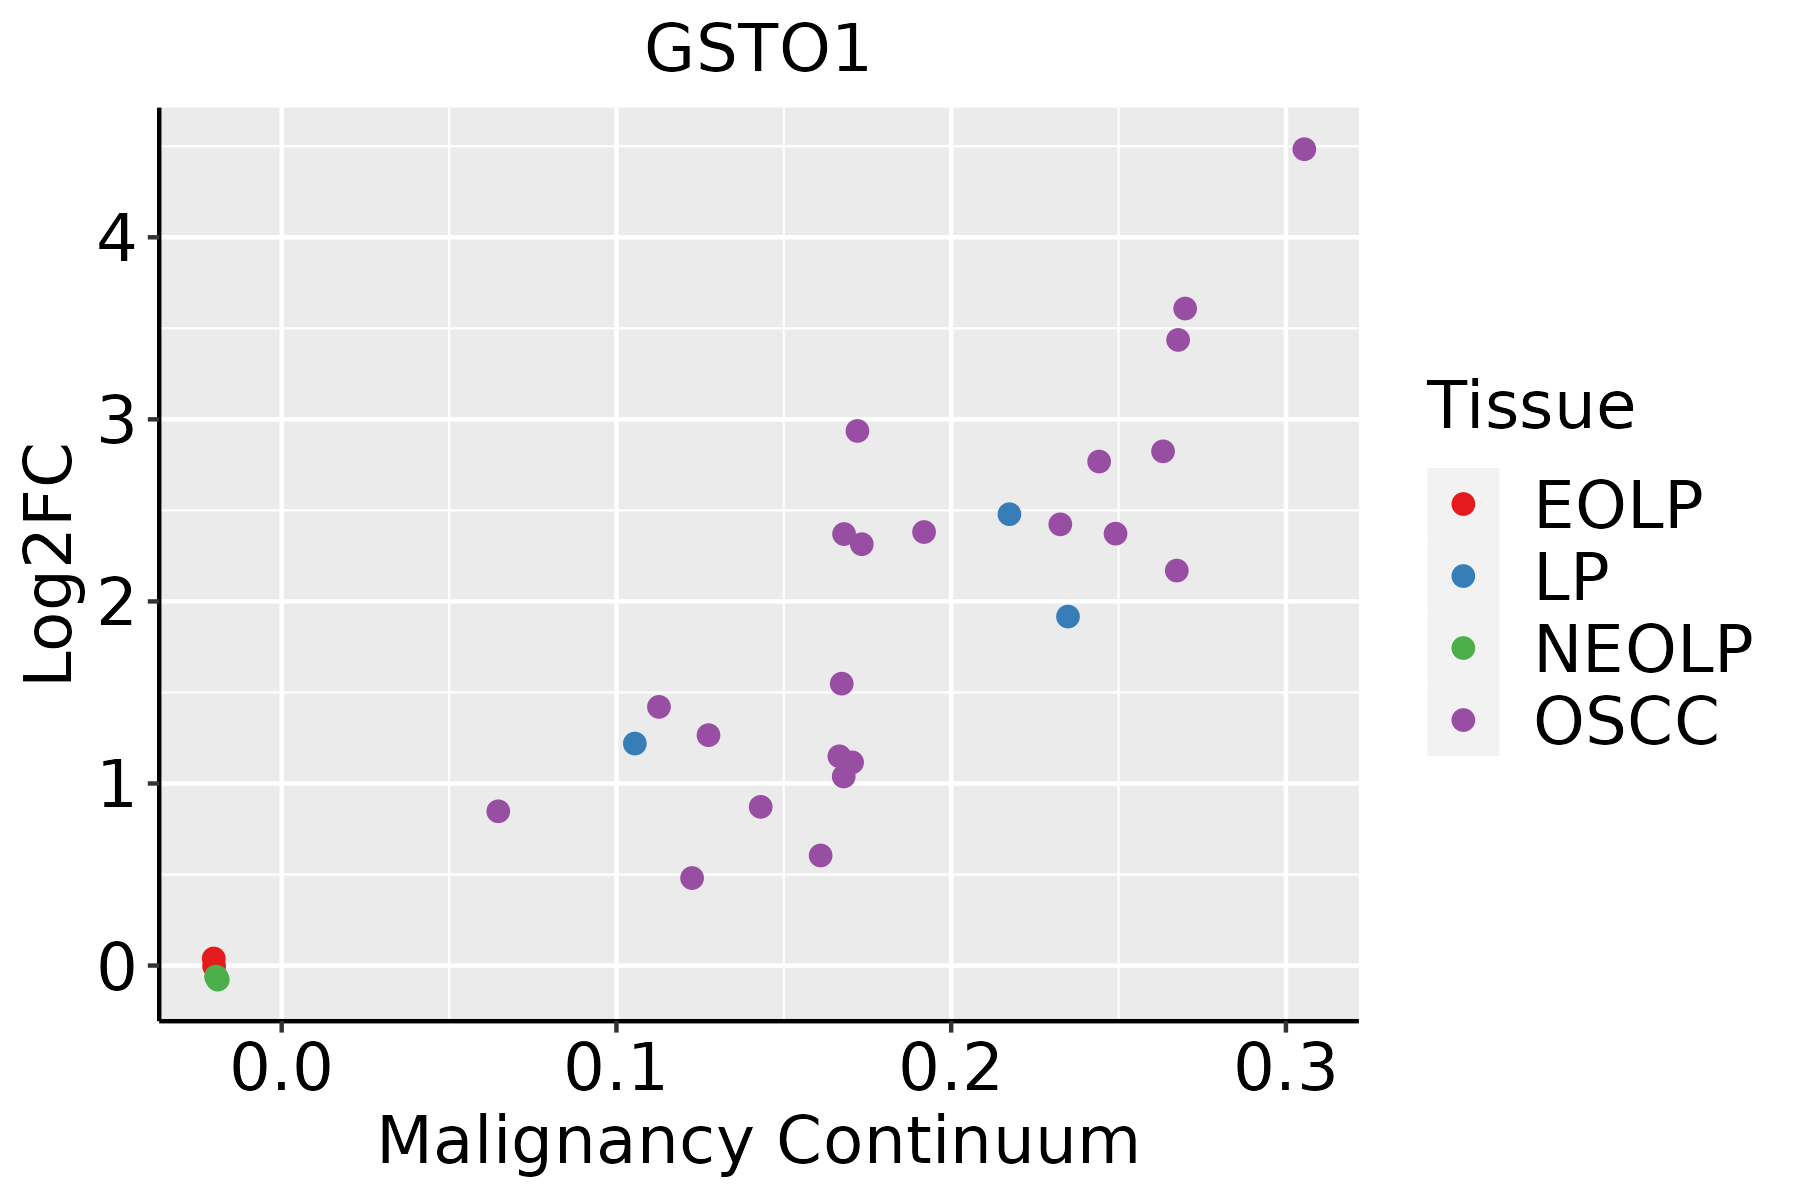 | EOLP: Erosive Oral lichen planus |
| LP: leukoplakia |
| NEOLP: Non-erosive oral lichen planus |
| OSCC: Oral squamous cell carcinoma |
| Prostate | 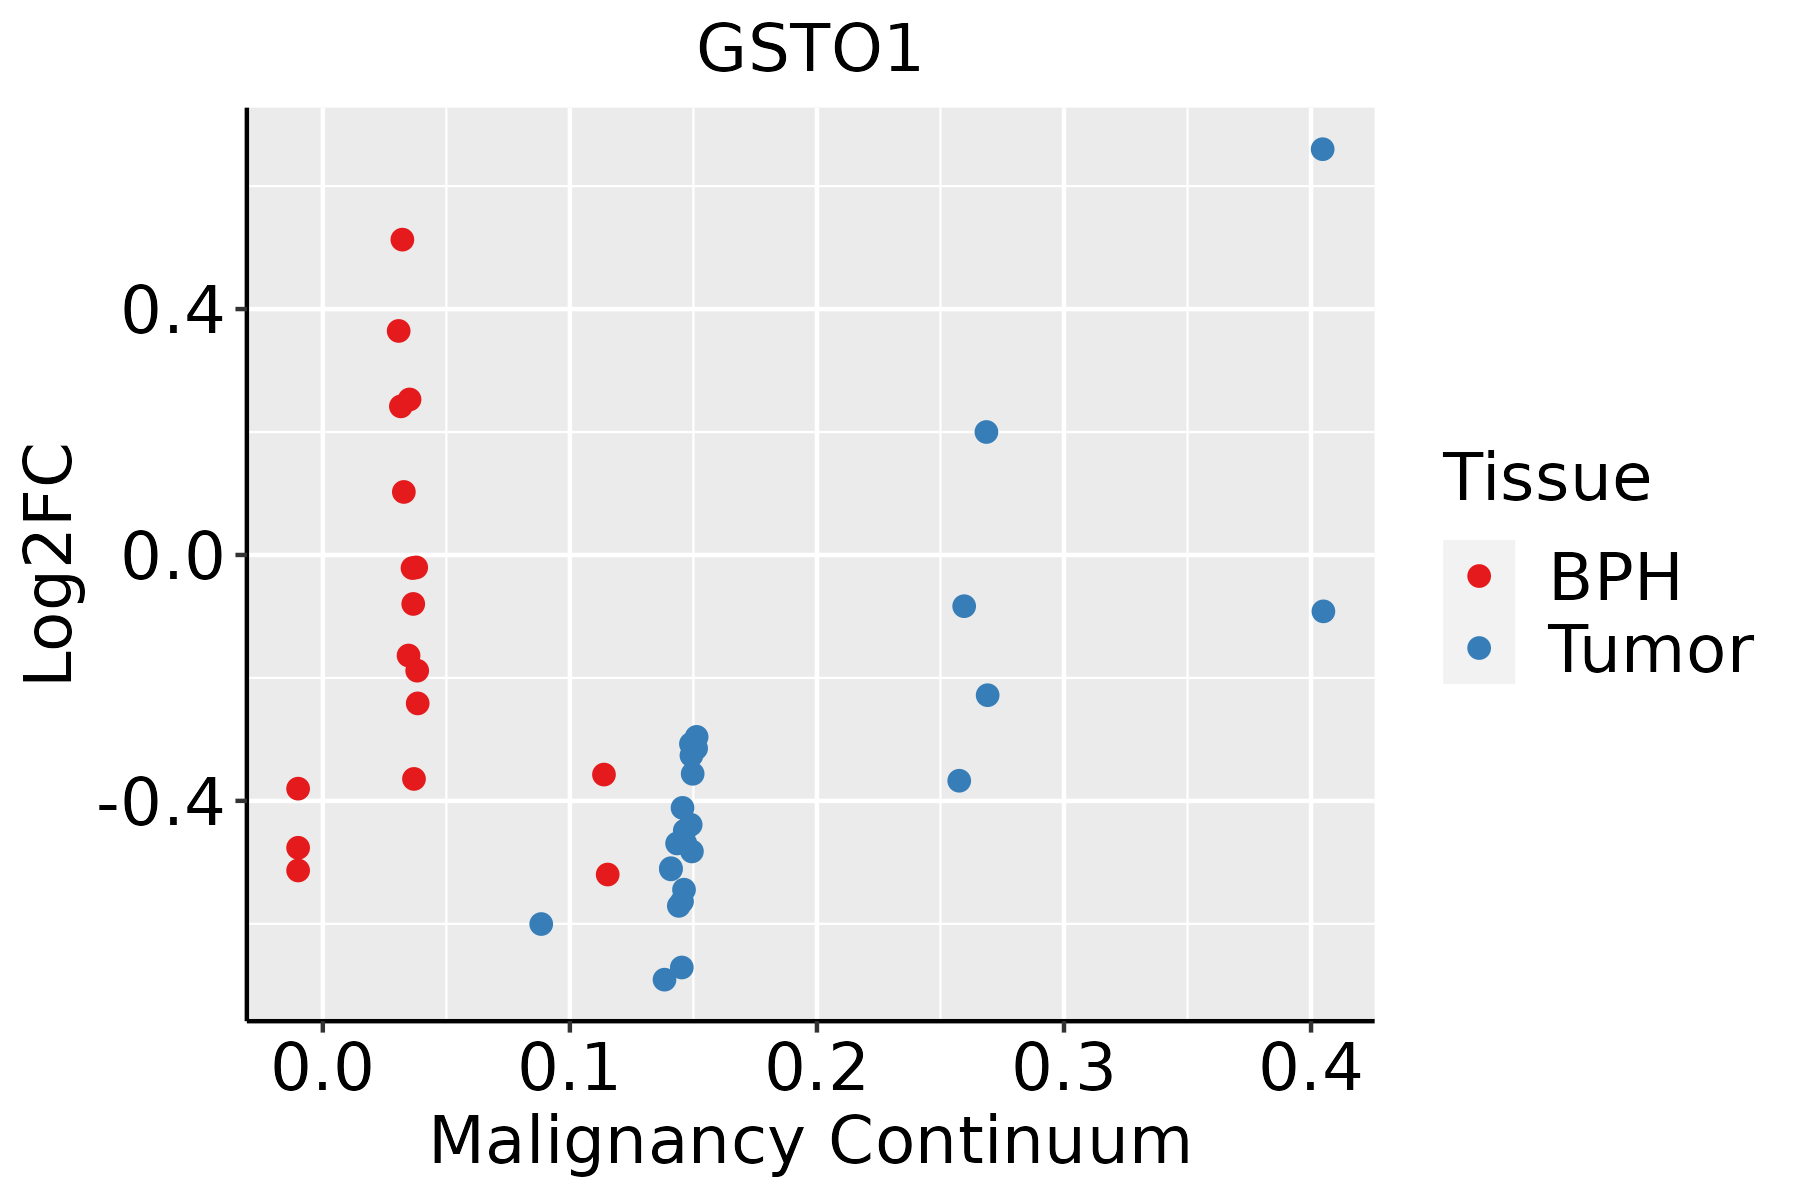 | BPH: Benign Prostatic Hyperplasia |
| Skin | 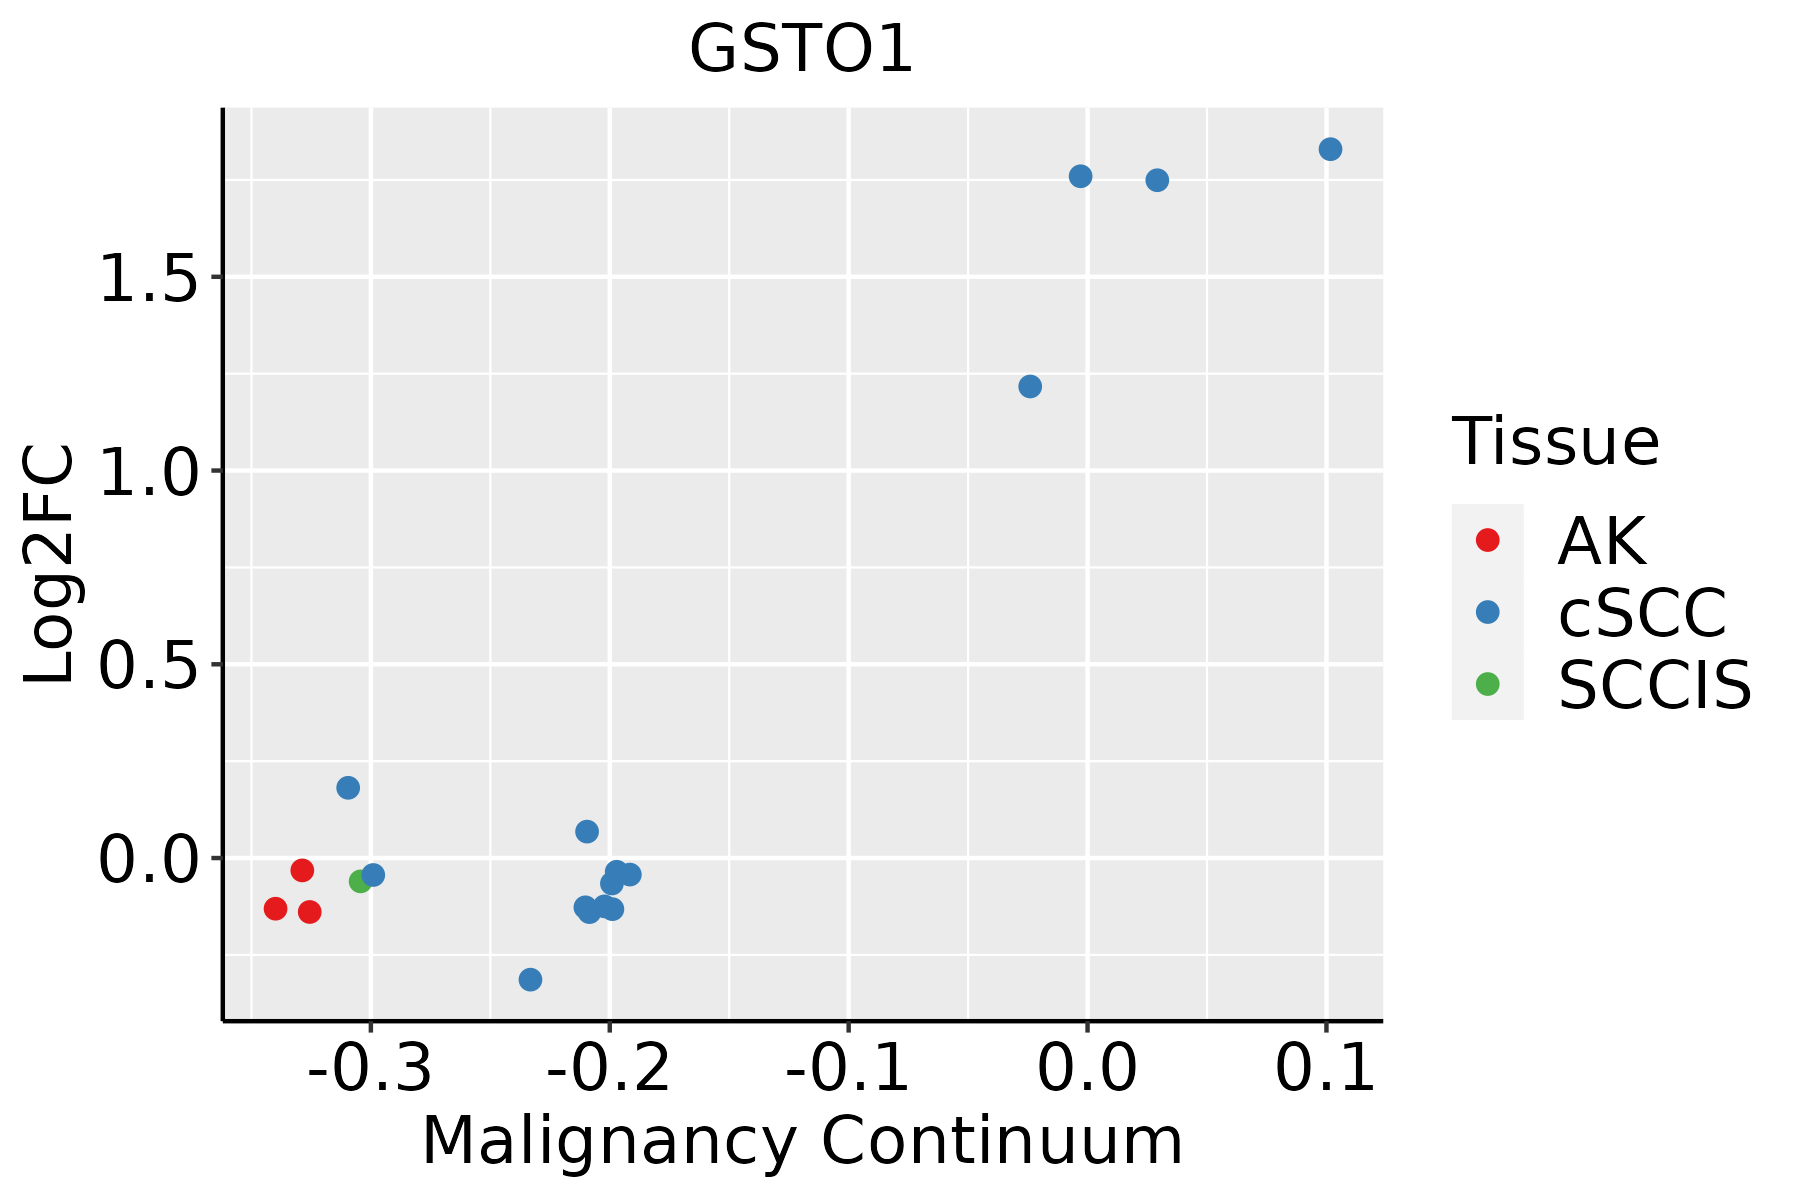 | AK: Actinic keratosis |
| cSCC: Cutaneous squamous cell carcinoma |
| SCCIS:squamous cell carcinoma in situ |
| Thyroid | 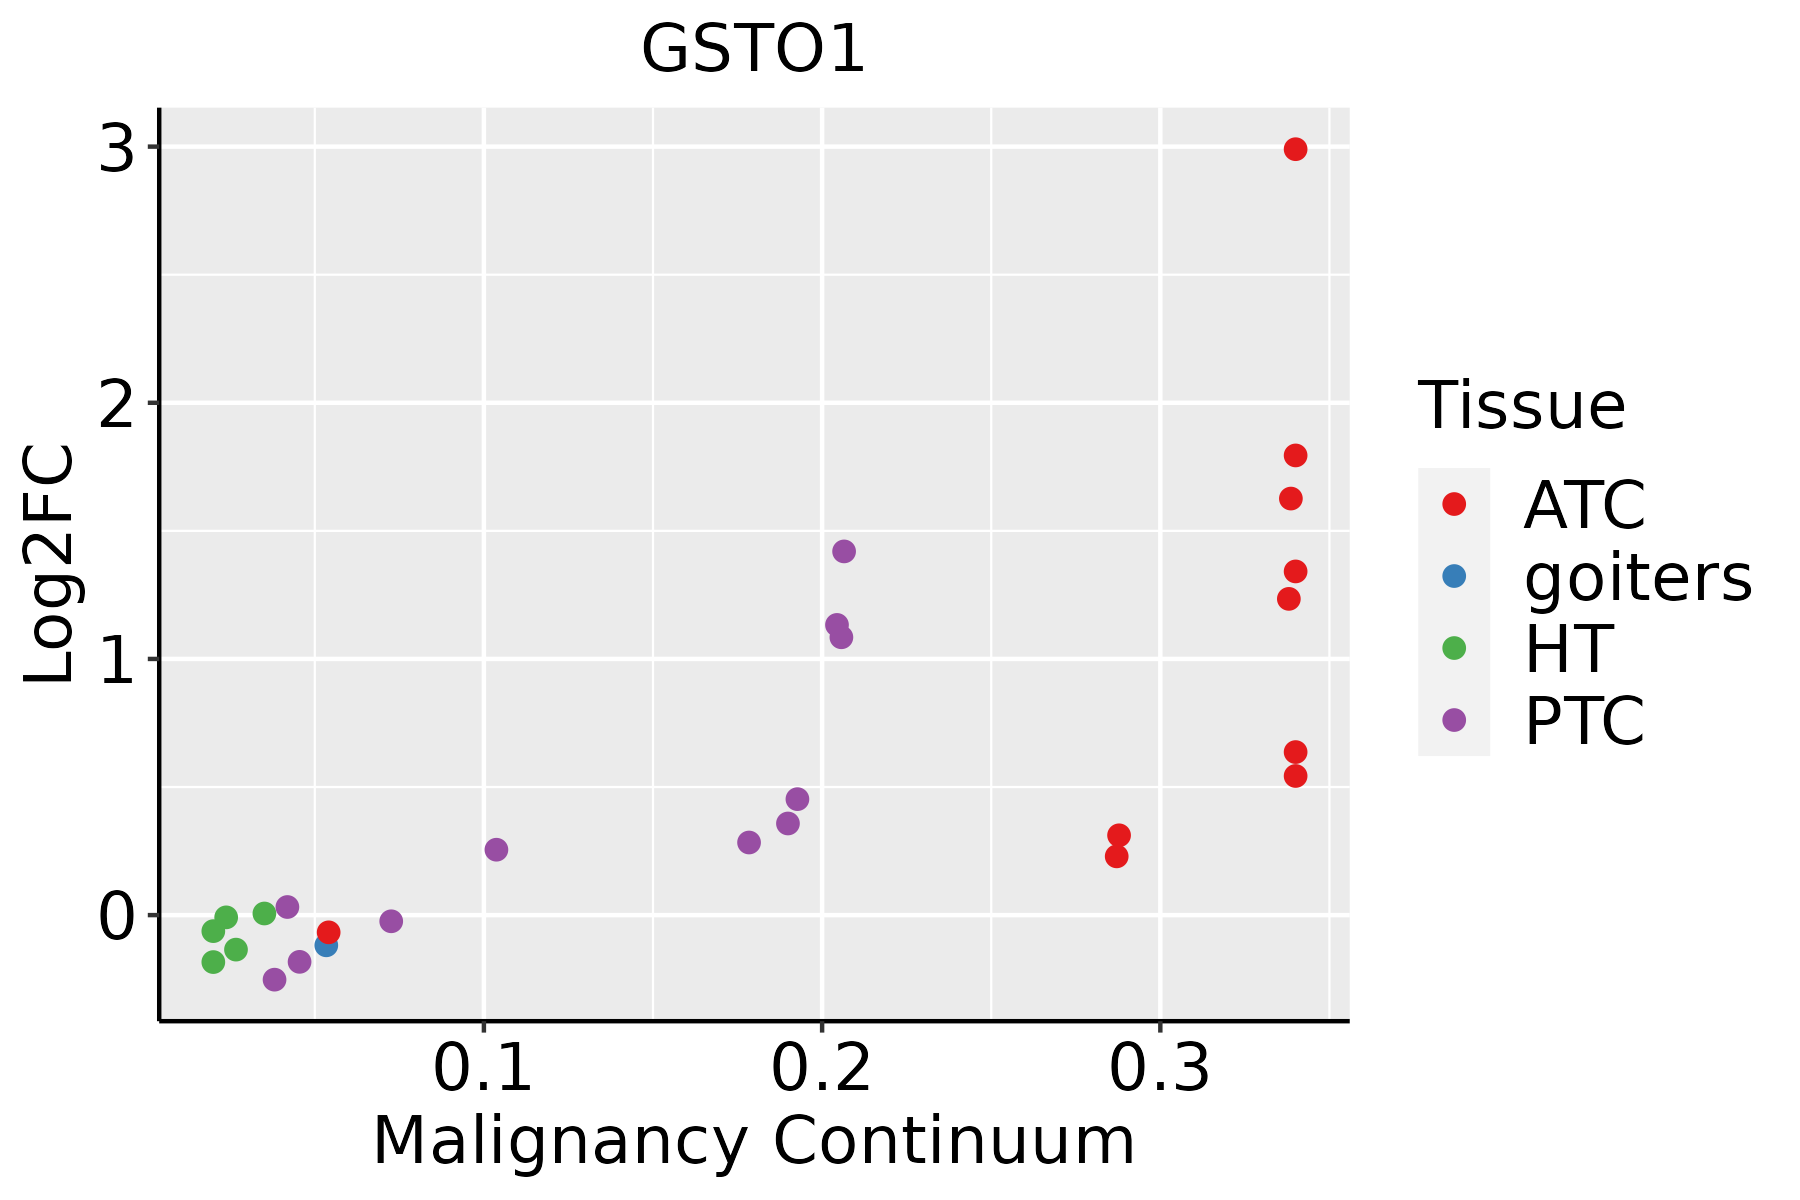 | ATC: Anaplastic thyroid cancer |
| HT: Hashimoto's thyroiditis |
| PTC: Papillary thyroid cancer |
| GO ID | Tissue | Disease Stage | Description | Gene Ratio | Bg Ratio | pvalue | p.adjust | Count |
| GO:00512359 | Cervix | CC | maintenance of location | 78/2311 | 327/18723 | 5.18e-09 | 4.92e-07 | 78 |
| GO:005165110 | Cervix | CC | maintenance of location in cell | 55/2311 | 214/18723 | 6.63e-08 | 3.85e-06 | 55 |
| GO:00988699 | Cervix | CC | cellular oxidant detoxification | 30/2311 | 101/18723 | 2.72e-06 | 7.93e-05 | 30 |
| GO:19907489 | Cervix | CC | cellular detoxification | 30/2311 | 116/18723 | 5.34e-05 | 7.94e-04 | 30 |
| GO:00972379 | Cervix | CC | cellular response to toxic substance | 31/2311 | 124/18723 | 8.09e-05 | 1.10e-03 | 31 |
| GO:00096369 | Cervix | CC | response to toxic substance | 52/2311 | 262/18723 | 3.34e-04 | 3.52e-03 | 52 |
| GO:00987549 | Cervix | CC | detoxification | 33/2311 | 152/18723 | 7.97e-04 | 7.00e-03 | 33 |
| GO:00094109 | Cervix | CC | response to xenobiotic stimulus | 78/2311 | 462/18723 | 2.39e-03 | 1.70e-02 | 78 |
| GO:00551174 | Cervix | CC | regulation of cardiac muscle contraction | 18/2311 | 77/18723 | 5.15e-03 | 3.03e-02 | 18 |
| GO:00902578 | Cervix | CC | regulation of muscle system process | 45/2311 | 252/18723 | 6.73e-03 | 3.70e-02 | 45 |
| GO:0051279 | Cervix | CC | regulation of release of sequestered calcium ion into cytosol | 18/2311 | 79/18723 | 6.82e-03 | 3.74e-02 | 18 |
| GO:00603154 | Cervix | CC | negative regulation of ryanodine-sensitive calcium-release channel activity | 5/2311 | 11/18723 | 6.92e-03 | 3.74e-02 | 5 |
| GO:00347645 | Cervix | CC | positive regulation of transmembrane transport | 40/2311 | 219/18723 | 6.97e-03 | 3.76e-02 | 40 |
| GO:000963614 | Cervix | HSIL_HPV | response to toxic substance | 24/737 | 262/18723 | 1.14e-04 | 2.36e-03 | 24 |
| GO:009886914 | Cervix | HSIL_HPV | cellular oxidant detoxification | 13/737 | 101/18723 | 1.64e-04 | 3.14e-03 | 13 |
| GO:009875414 | Cervix | HSIL_HPV | detoxification | 16/737 | 152/18723 | 3.32e-04 | 5.31e-03 | 16 |
| GO:009723714 | Cervix | HSIL_HPV | cellular response to toxic substance | 14/737 | 124/18723 | 3.76e-04 | 5.89e-03 | 14 |
| GO:005123514 | Cervix | HSIL_HPV | maintenance of location | 26/737 | 327/18723 | 5.67e-04 | 8.04e-03 | 26 |
| GO:199074814 | Cervix | HSIL_HPV | cellular detoxification | 13/737 | 116/18723 | 6.46e-04 | 8.85e-03 | 13 |
| GO:005165115 | Cervix | HSIL_HPV | maintenance of location in cell | 18/737 | 214/18723 | 2.07e-03 | 2.14e-02 | 18 |
| Pathway ID | Tissue | Disease Stage | Description | Gene Ratio | Bg Ratio | pvalue | p.adjust | qvalue | Count |
| hsa0520820 | Cervix | CC | Chemical carcinogenesis - reactive oxygen species | 92/1267 | 223/8465 | 4.71e-22 | 5.09e-20 | 3.01e-20 | 92 |
| hsa0541820 | Cervix | CC | Fluid shear stress and atherosclerosis | 50/1267 | 139/8465 | 5.71e-10 | 1.32e-08 | 7.81e-09 | 50 |
| hsa0522510 | Cervix | CC | Hepatocellular carcinoma | 40/1267 | 168/8465 | 1.52e-03 | 6.39e-03 | 3.78e-03 | 40 |
| hsa05208110 | Cervix | CC | Chemical carcinogenesis - reactive oxygen species | 92/1267 | 223/8465 | 4.71e-22 | 5.09e-20 | 3.01e-20 | 92 |
| hsa05418110 | Cervix | CC | Fluid shear stress and atherosclerosis | 50/1267 | 139/8465 | 5.71e-10 | 1.32e-08 | 7.81e-09 | 50 |
| hsa0522513 | Cervix | CC | Hepatocellular carcinoma | 40/1267 | 168/8465 | 1.52e-03 | 6.39e-03 | 3.78e-03 | 40 |
| hsa0520825 | Cervix | HSIL_HPV | Chemical carcinogenesis - reactive oxygen species | 30/459 | 223/8465 | 3.28e-06 | 5.65e-05 | 4.57e-05 | 30 |
| hsa0541825 | Cervix | HSIL_HPV | Fluid shear stress and atherosclerosis | 16/459 | 139/8465 | 3.41e-03 | 2.08e-02 | 1.68e-02 | 16 |
| hsa0520835 | Cervix | HSIL_HPV | Chemical carcinogenesis - reactive oxygen species | 30/459 | 223/8465 | 3.28e-06 | 5.65e-05 | 4.57e-05 | 30 |
| hsa0541835 | Cervix | HSIL_HPV | Fluid shear stress and atherosclerosis | 16/459 | 139/8465 | 3.41e-03 | 2.08e-02 | 1.68e-02 | 16 |
| hsa05208 | Colorectum | AD | Chemical carcinogenesis - reactive oxygen species | 126/2092 | 223/8465 | 1.01e-24 | 1.68e-22 | 1.07e-22 | 126 |
| hsa05418 | Colorectum | AD | Fluid shear stress and atherosclerosis | 54/2092 | 139/8465 | 1.41e-04 | 1.16e-03 | 7.37e-04 | 54 |
| hsa05225 | Colorectum | AD | Hepatocellular carcinoma | 59/2092 | 168/8465 | 1.50e-03 | 8.69e-03 | 5.54e-03 | 59 |
| hsa00480 | Colorectum | AD | Glutathione metabolism | 23/2092 | 57/8465 | 6.52e-03 | 2.76e-02 | 1.76e-02 | 23 |
| hsa052081 | Colorectum | AD | Chemical carcinogenesis - reactive oxygen species | 126/2092 | 223/8465 | 1.01e-24 | 1.68e-22 | 1.07e-22 | 126 |
| hsa054181 | Colorectum | AD | Fluid shear stress and atherosclerosis | 54/2092 | 139/8465 | 1.41e-04 | 1.16e-03 | 7.37e-04 | 54 |
| hsa052251 | Colorectum | AD | Hepatocellular carcinoma | 59/2092 | 168/8465 | 1.50e-03 | 8.69e-03 | 5.54e-03 | 59 |
| hsa004801 | Colorectum | AD | Glutathione metabolism | 23/2092 | 57/8465 | 6.52e-03 | 2.76e-02 | 1.76e-02 | 23 |
| hsa052082 | Colorectum | SER | Chemical carcinogenesis - reactive oxygen species | 103/1580 | 223/8465 | 1.60e-21 | 7.57e-20 | 5.50e-20 | 103 |
| hsa054182 | Colorectum | SER | Fluid shear stress and atherosclerosis | 40/1580 | 139/8465 | 2.28e-03 | 1.75e-02 | 1.27e-02 | 40 |
| Hugo Symbol | Variant Class | Variant Classification | dbSNP RS | HGVSc | HGVSp | HGVSp Short | SWISSPROT | BIOTYPE | SIFT | PolyPhen | Tumor Sample Barcode | Tissue | Histology | Sex | Age | Stage | Therapy Types | Drugs | Outcome |
| GSTO1 | SNV | Missense_Mutation | | c.641N>T | p.Ala214Val | p.A214V | P78417 | protein_coding | deleterious(0.02) | possibly_damaging(0.551) | TCGA-BH-A0HF-01 | Breast | breast invasive carcinoma | Female | >=65 | I/II | Hormone Therapy | arimidex | SD |
| GSTO1 | insertion | Frame_Shift_Ins | novel | c.385_386insTCCCAGCACTTTGGGAGGCTGAGGCAGATGGATCACCTGAG | p.Ser129IlefsTer28 | p.S129Ifs*28 | P78417 | protein_coding | | | TCGA-BH-A0EE-01 | Breast | breast invasive carcinoma | Female | >=65 | I/II | Chemotherapy | docetaxel | SD |
| GSTO1 | SNV | Missense_Mutation | novel | c.311C>A | p.Pro104Gln | p.P104Q | P78417 | protein_coding | deleterious(0) | probably_damaging(1) | TCGA-2W-A8YY-01 | Cervix | cervical & endocervical cancer | Female | <65 | I/II | Chemotherapy | cisplatin | CR |
| GSTO1 | SNV | Missense_Mutation | | c.43N>A | p.Pro15Thr | p.P15T | P78417 | protein_coding | tolerated(0.06) | benign(0.034) | TCGA-IR-A3LL-01 | Cervix | cervical & endocervical cancer | Female | <65 | I/II | Chemotherapy | cisplatin | CR |
| GSTO1 | SNV | Missense_Mutation | rs754091728 | c.253N>A | p.Glu85Lys | p.E85K | P78417 | protein_coding | deleterious(0) | probably_damaging(0.971) | TCGA-AX-A0J0-01 | Endometrium | uterine corpus endometrioid carcinoma | Female | <65 | I/II | Unknown | Unknown | SD |
| GSTO1 | SNV | Missense_Mutation | novel | c.182N>G | p.Glu61Gly | p.E61G | P78417 | protein_coding | deleterious(0) | possibly_damaging(0.795) | TCGA-AX-A0J1-01 | Endometrium | uterine corpus endometrioid carcinoma | Female | >=65 | I/II | Unknown | Unknown | SD |
| GSTO1 | SNV | Missense_Mutation | novel | c.602N>C | p.Leu201Pro | p.L201P | P78417 | protein_coding | tolerated(0.23) | possibly_damaging(0.896) | TCGA-AX-A2HJ-01 | Endometrium | uterine corpus endometrioid carcinoma | Female | <65 | I/II | Unknown | Unknown | SD |
| GSTO1 | SNV | Missense_Mutation | novel | c.161N>C | p.Ile54Thr | p.I54T | P78417 | protein_coding | deleterious(0.01) | possibly_damaging(0.573) | TCGA-B5-A3FA-01 | Endometrium | uterine corpus endometrioid carcinoma | Female | >=65 | I/II | Unknown | Unknown | SD |
| GSTO1 | SNV | Missense_Mutation | | c.470N>C | p.Leu157Pro | p.L157P | P78417 | protein_coding | deleterious(0) | probably_damaging(0.938) | TCGA-BS-A0UA-01 | Endometrium | uterine corpus endometrioid carcinoma | Female | >=65 | I/II | Unknown | Unknown | PD |
| GSTO1 | SNV | Missense_Mutation | | c.170N>C | p.Lys57Thr | p.K57T | P78417 | protein_coding | deleterious(0) | possibly_damaging(0.894) | TCGA-D1-A17Q-01 | Endometrium | uterine corpus endometrioid carcinoma | Female | <65 | I/II | Unknown | Unknown | SD |


