
|
|||||
|
 | |
| |
| |
| |
| |
| |
|
Gene: GSTM4 |
Gene summary for GSTM4 |
| Gene information | Species | Human | Gene symbol | GSTM4 | Gene ID | 2948 |
| Gene name | glutathione S-transferase mu 4 | |
| Gene Alias | GSTM4-4 | |
| Cytomap | 1p13.3 | |
| Gene Type | protein-coding | GO ID | GO:0001676 | UniProtAcc | A0A140VKE3 |
Top |
Malignant transformation analysis |
| Identification of the aberrant gene expression in precancerous and cancerous lesions by comparing the gene expression of stem-like cells in diseased tissues with normal stem cells |
| Entrez ID | Symbol | Replicates | Species | Organ | Tissue | Adj P-value | Log2FC | Malignancy |
| 2948 | GSTM4 | HTA11_3410_2000001011 | Human | Colorectum | AD | 1.48e-02 | 1.44e-01 | 0.0155 |
| 2948 | GSTM4 | HTA11_2487_2000001011 | Human | Colorectum | SER | 1.60e-05 | 2.70e-01 | -0.1808 |
| 2948 | GSTM4 | HTA11_1938_2000001011 | Human | Colorectum | AD | 1.02e-03 | 2.65e-01 | -0.0811 |
| 2948 | GSTM4 | HTA11_347_2000001011 | Human | Colorectum | AD | 4.96e-13 | 3.54e-01 | -0.1954 |
| 2948 | GSTM4 | HTA11_696_2000001011 | Human | Colorectum | AD | 3.56e-07 | 2.37e-01 | -0.1464 |
| 2948 | GSTM4 | HTA11_866_2000001011 | Human | Colorectum | AD | 9.67e-04 | 1.74e-01 | -0.1001 |
| 2948 | GSTM4 | HTA11_1391_2000001011 | Human | Colorectum | AD | 5.21e-09 | 4.09e-01 | -0.059 |
| 2948 | GSTM4 | HTA11_5216_2000001011 | Human | Colorectum | SER | 9.16e-03 | 4.36e-01 | -0.1462 |
| 2948 | GSTM4 | HTA11_546_2000001011 | Human | Colorectum | AD | 1.53e-02 | 2.50e-01 | -0.0842 |
| 2948 | GSTM4 | HTA11_10623_2000001011 | Human | Colorectum | AD | 9.57e-07 | 4.00e-01 | -0.0177 |
| 2948 | GSTM4 | HTA11_7696_3000711011 | Human | Colorectum | AD | 3.04e-09 | 2.62e-01 | 0.0674 |
| 2948 | GSTM4 | HTA11_7469_2000001011 | Human | Colorectum | AD | 1.50e-03 | 5.13e-01 | -0.0124 |
| 2948 | GSTM4 | HTA11_99999971662_82457 | Human | Colorectum | MSS | 5.23e-11 | 3.11e-01 | 0.3859 |
| 2948 | GSTM4 | LZE2T | Human | Esophagus | ESCC | 7.32e-16 | 2.45e+00 | 0.082 |
| 2948 | GSTM4 | LZE4T | Human | Esophagus | ESCC | 1.81e-23 | 8.66e-01 | 0.0811 |
| 2948 | GSTM4 | LZE7T | Human | Esophagus | ESCC | 9.67e-04 | 6.74e-01 | 0.0667 |
| 2948 | GSTM4 | LZE21T | Human | Esophagus | ESCC | 2.10e-04 | 3.33e-01 | 0.0655 |
| 2948 | GSTM4 | LZE6T | Human | Esophagus | ESCC | 3.53e-03 | 1.44e-01 | 0.0845 |
| 2948 | GSTM4 | P1T-E | Human | Esophagus | ESCC | 7.52e-05 | 4.04e-01 | 0.0875 |
| 2948 | GSTM4 | P2T-E | Human | Esophagus | ESCC | 6.18e-28 | 5.32e-01 | 0.1177 |
| Page: 1 2 3 4 5 |
| Tissue | Expression Dynamics | Abbreviation |
| Colorectum (GSE201348) |  | FAP: Familial adenomatous polyposis |
| CRC: Colorectal cancer | ||
| Colorectum (HTA11) |  | AD: Adenomas |
| SER: Sessile serrated lesions | ||
| MSI-H: Microsatellite-high colorectal cancer | ||
| MSS: Microsatellite stable colorectal cancer | ||
| Esophagus | 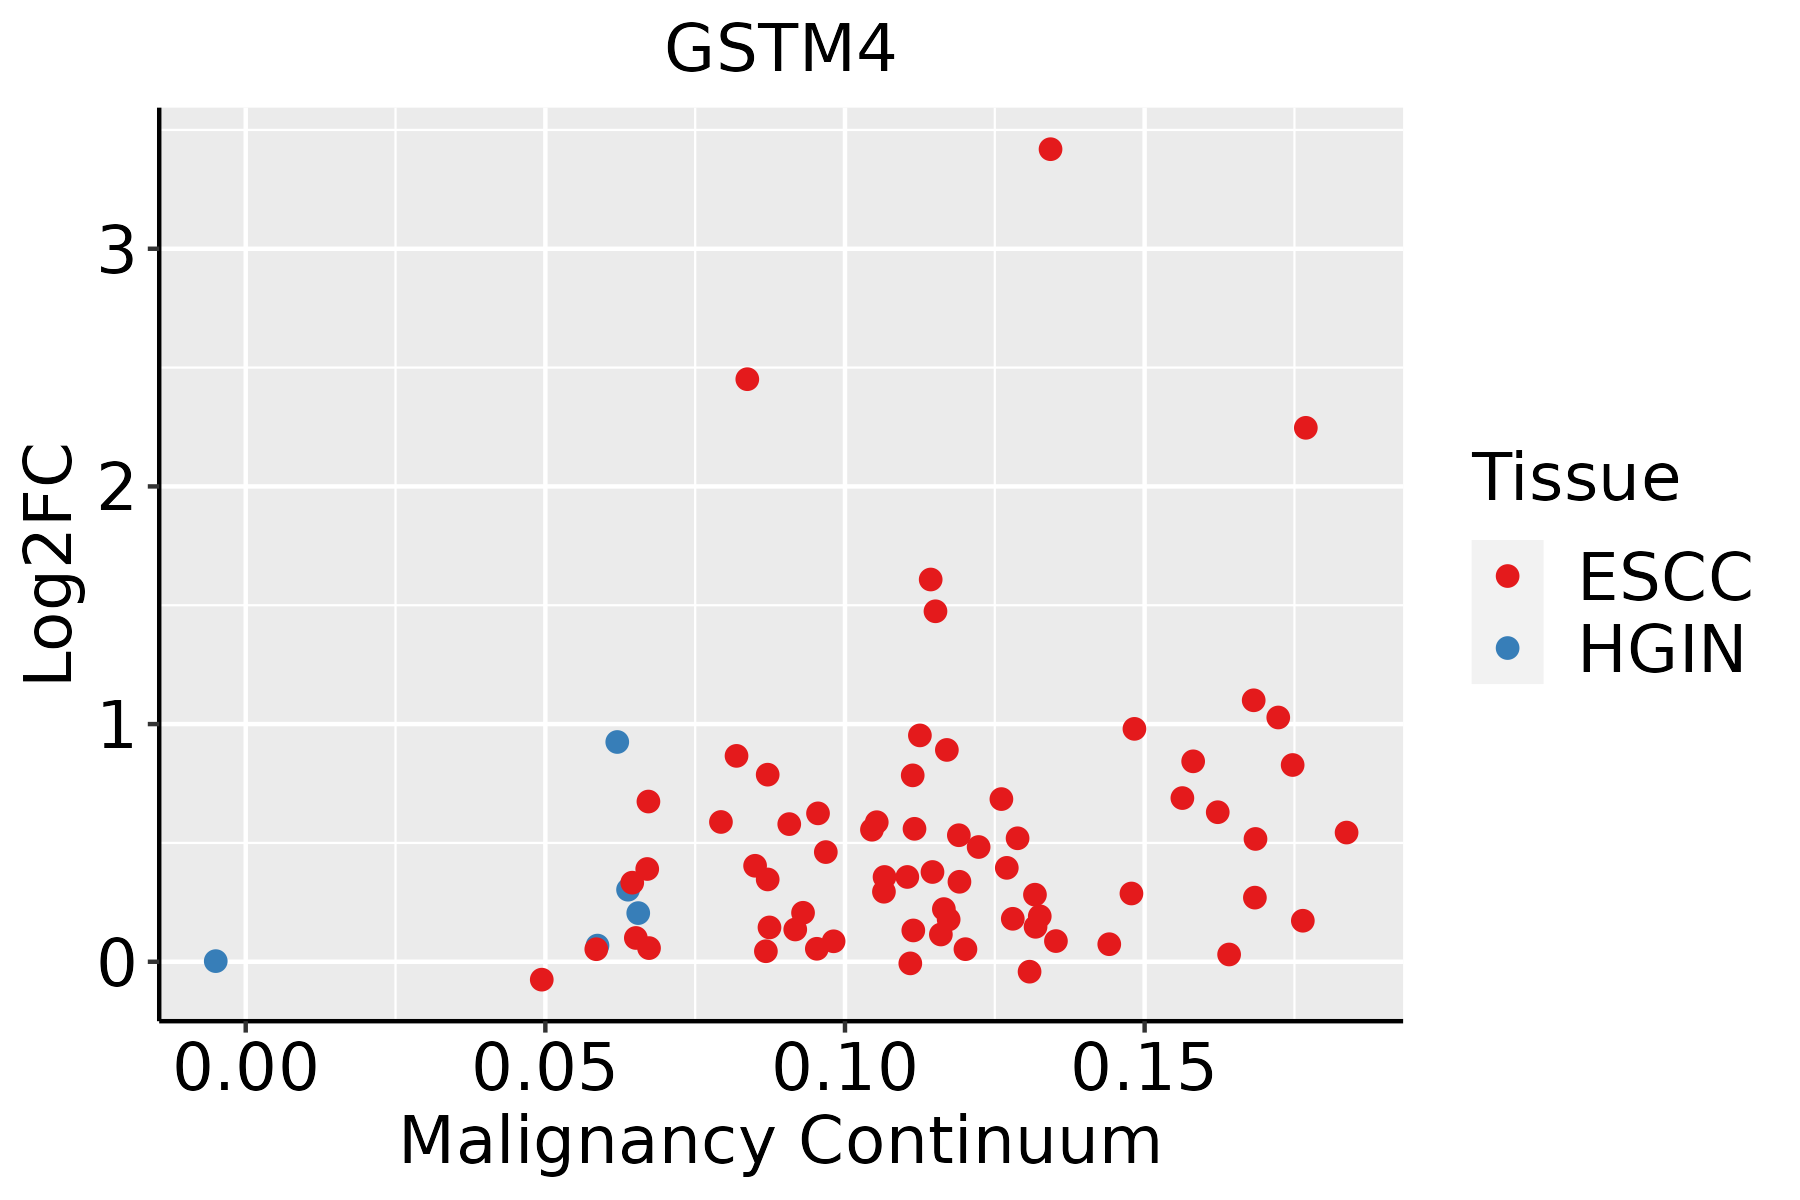 | ESCC: Esophageal squamous cell carcinoma |
| HGIN: High-grade intraepithelial neoplasias | ||
| LGIN: Low-grade intraepithelial neoplasias | ||
| Liver |  | HCC: Hepatocellular carcinoma |
| NAFLD: Non-alcoholic fatty liver disease | ||
| Oral Cavity | 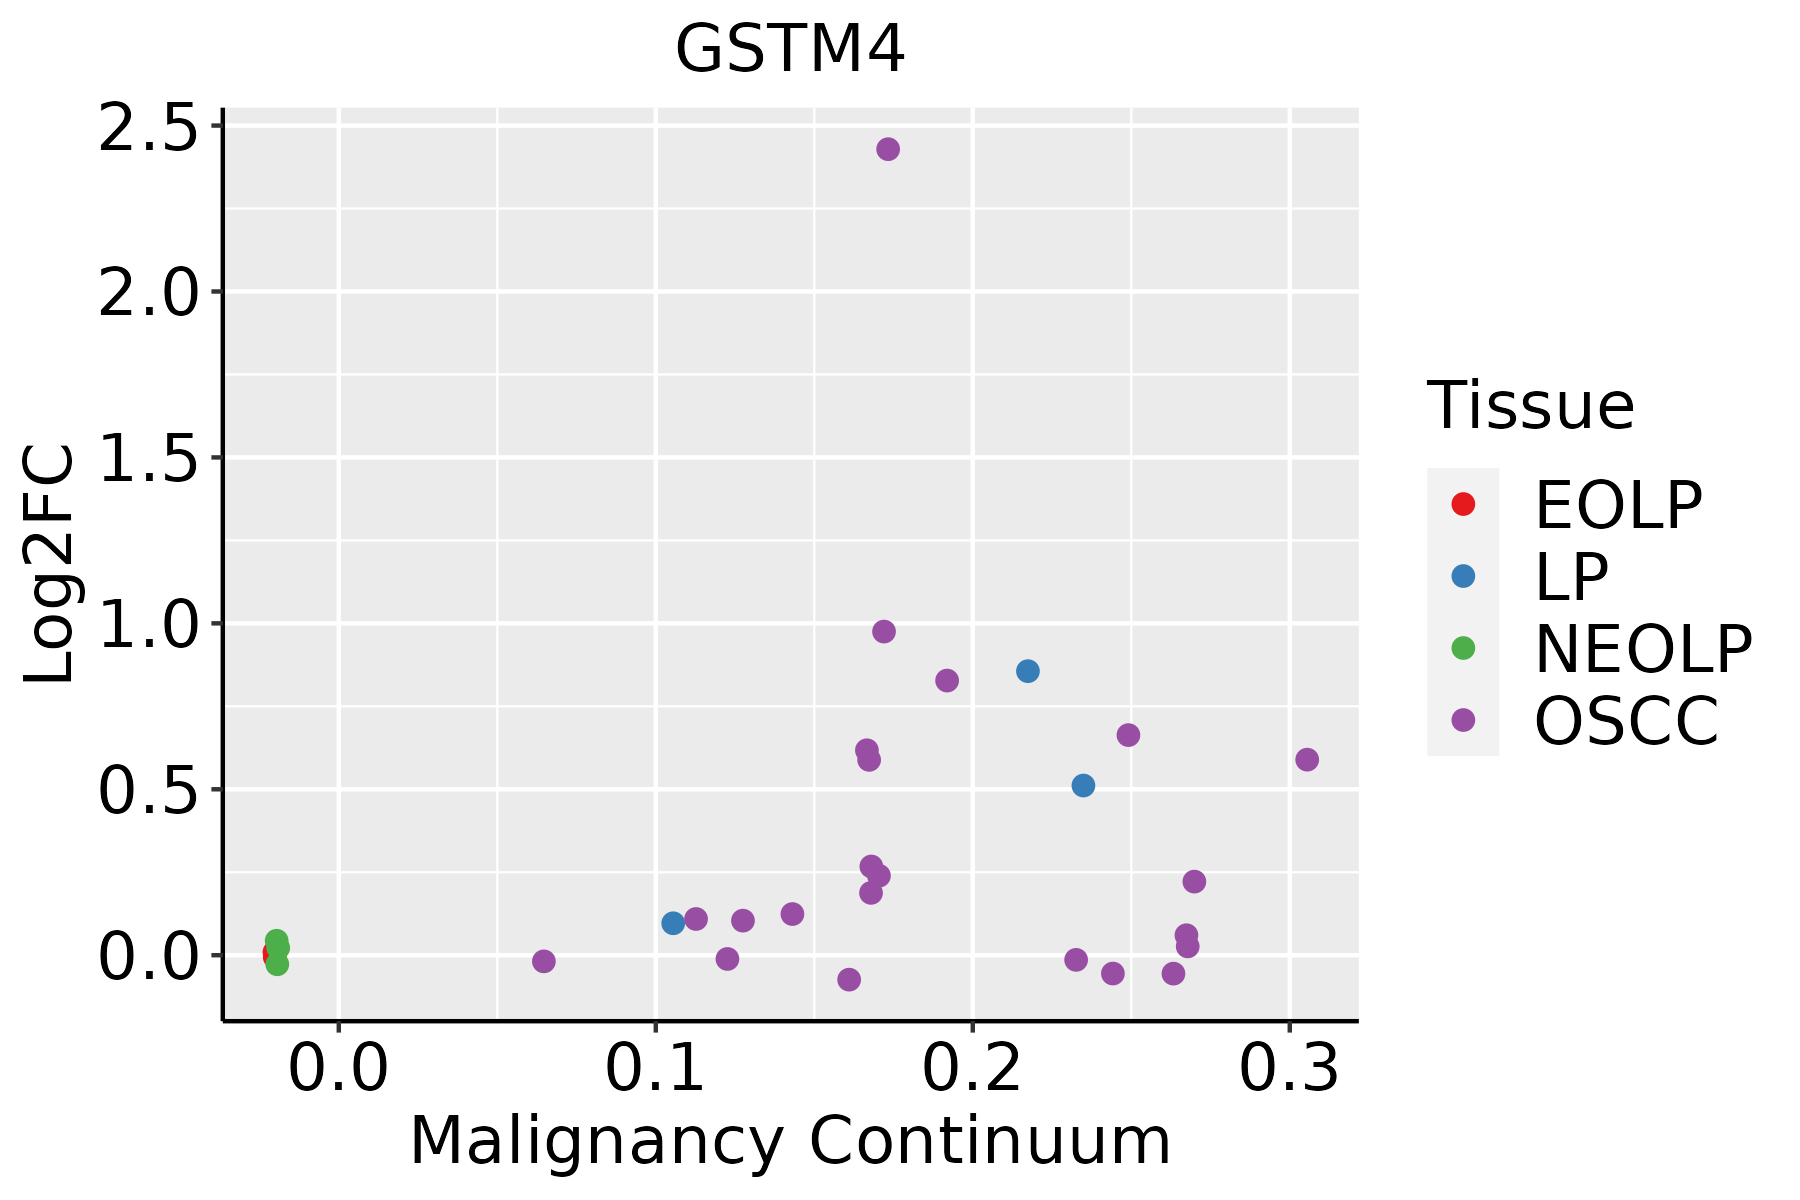 | EOLP: Erosive Oral lichen planus |
| LP: leukoplakia | ||
| NEOLP: Non-erosive oral lichen planus | ||
| OSCC: Oral squamous cell carcinoma |
| ∗log2FC in expression of this searched gene in stem-like cells from each diseased tissue sample relative to stem-like cells in normal samples in each tissue plotted against the malignancy continuum. Samples are colored based on if they are from different disease stage. |
Top |
Malignant transformation related pathway analysis |
| Find out the enriched GO biological processes and KEGG pathways involved in transition from healthy to precancer to cancer |
| Tissue | Disease Stage | Enriched GO biological Processes |
| Colorectum | AD |  |
| Colorectum | SER |  |
| Colorectum | MSS |  |
| Colorectum | MSI-H |  |
| Colorectum | FAP |  |
| ∗Top 15 enriched GO BP terms are showed in the bar plot of each disease state in each tissue. Each row represents a significant GO biological process which is colored according to the -log10(p.adjust). |
| Page: 1 2 3 4 5 6 7 8 9 |
| GO ID | Tissue | Disease Stage | Description | Gene Ratio | Bg Ratio | pvalue | p.adjust | Count |
| GO:0006631 | Colorectum | AD | fatty acid metabolic process | 114/3918 | 390/18723 | 5.58e-05 | 9.44e-04 | 114 |
| GO:0006790 | Colorectum | AD | sulfur compound metabolic process | 101/3918 | 339/18723 | 6.46e-05 | 1.07e-03 | 101 |
| GO:0009410 | Colorectum | AD | response to xenobiotic stimulus | 128/3918 | 462/18723 | 2.69e-04 | 3.31e-03 | 128 |
| GO:0006575 | Colorectum | AD | cellular modified amino acid metabolic process | 59/3918 | 188/18723 | 4.80e-04 | 5.27e-03 | 59 |
| GO:00067901 | Colorectum | SER | sulfur compound metabolic process | 73/2897 | 339/18723 | 1.75e-03 | 1.81e-02 | 73 |
| GO:00066311 | Colorectum | SER | fatty acid metabolic process | 79/2897 | 390/18723 | 6.34e-03 | 4.56e-02 | 79 |
| GO:00065751 | Colorectum | MSS | cellular modified amino acid metabolic process | 55/3467 | 188/18723 | 2.16e-04 | 3.01e-03 | 55 |
| GO:00067902 | Colorectum | MSS | sulfur compound metabolic process | 85/3467 | 339/18723 | 1.52e-03 | 1.39e-02 | 85 |
| GO:00066312 | Colorectum | MSS | fatty acid metabolic process | 95/3467 | 390/18723 | 2.20e-03 | 1.84e-02 | 95 |
| GO:00094101 | Colorectum | MSS | response to xenobiotic stimulus | 110/3467 | 462/18723 | 2.36e-03 | 1.92e-02 | 110 |
| GO:0046394 | Colorectum | MSS | carboxylic acid biosynthetic process | 76/3467 | 314/18723 | 6.71e-03 | 4.38e-02 | 76 |
| GO:0016053 | Colorectum | MSS | organic acid biosynthetic process | 76/3467 | 316/18723 | 7.88e-03 | 4.84e-02 | 76 |
| GO:00067906 | Esophagus | ESCC | sulfur compound metabolic process | 201/8552 | 339/18723 | 2.64e-07 | 3.94e-06 | 201 |
| GO:00066318 | Esophagus | ESCC | fatty acid metabolic process | 217/8552 | 390/18723 | 4.21e-05 | 3.39e-04 | 217 |
| GO:000941020 | Esophagus | ESCC | response to xenobiotic stimulus | 253/8552 | 462/18723 | 4.55e-05 | 3.58e-04 | 253 |
| GO:00065757 | Esophagus | ESCC | cellular modified amino acid metabolic process | 112/8552 | 188/18723 | 8.31e-05 | 6.06e-04 | 112 |
| GO:00463948 | Esophagus | ESCC | carboxylic acid biosynthetic process | 175/8552 | 314/18723 | 1.98e-04 | 1.26e-03 | 175 |
| GO:00160538 | Esophagus | ESCC | organic acid biosynthetic process | 175/8552 | 316/18723 | 3.04e-04 | 1.82e-03 | 175 |
| GO:000674912 | Esophagus | ESCC | glutathione metabolic process | 42/8552 | 64/18723 | 1.01e-03 | 5.12e-03 | 42 |
| GO:000663112 | Liver | Cirrhotic | fatty acid metabolic process | 165/4634 | 390/18723 | 1.29e-14 | 1.26e-12 | 165 |
| Page: 1 2 3 |
| Pathway ID | Tissue | Disease Stage | Description | Gene Ratio | Bg Ratio | pvalue | p.adjust | qvalue | Count |
| hsa05208 | Colorectum | AD | Chemical carcinogenesis - reactive oxygen species | 126/2092 | 223/8465 | 1.01e-24 | 1.68e-22 | 1.07e-22 | 126 |
| hsa05418 | Colorectum | AD | Fluid shear stress and atherosclerosis | 54/2092 | 139/8465 | 1.41e-04 | 1.16e-03 | 7.37e-04 | 54 |
| hsa05225 | Colorectum | AD | Hepatocellular carcinoma | 59/2092 | 168/8465 | 1.50e-03 | 8.69e-03 | 5.54e-03 | 59 |
| hsa00480 | Colorectum | AD | Glutathione metabolism | 23/2092 | 57/8465 | 6.52e-03 | 2.76e-02 | 1.76e-02 | 23 |
| hsa052081 | Colorectum | AD | Chemical carcinogenesis - reactive oxygen species | 126/2092 | 223/8465 | 1.01e-24 | 1.68e-22 | 1.07e-22 | 126 |
| hsa054181 | Colorectum | AD | Fluid shear stress and atherosclerosis | 54/2092 | 139/8465 | 1.41e-04 | 1.16e-03 | 7.37e-04 | 54 |
| hsa052251 | Colorectum | AD | Hepatocellular carcinoma | 59/2092 | 168/8465 | 1.50e-03 | 8.69e-03 | 5.54e-03 | 59 |
| hsa004801 | Colorectum | AD | Glutathione metabolism | 23/2092 | 57/8465 | 6.52e-03 | 2.76e-02 | 1.76e-02 | 23 |
| hsa052082 | Colorectum | SER | Chemical carcinogenesis - reactive oxygen species | 103/1580 | 223/8465 | 1.60e-21 | 7.57e-20 | 5.50e-20 | 103 |
| hsa054182 | Colorectum | SER | Fluid shear stress and atherosclerosis | 40/1580 | 139/8465 | 2.28e-03 | 1.75e-02 | 1.27e-02 | 40 |
| hsa052083 | Colorectum | SER | Chemical carcinogenesis - reactive oxygen species | 103/1580 | 223/8465 | 1.60e-21 | 7.57e-20 | 5.50e-20 | 103 |
| hsa054183 | Colorectum | SER | Fluid shear stress and atherosclerosis | 40/1580 | 139/8465 | 2.28e-03 | 1.75e-02 | 1.27e-02 | 40 |
| hsa052084 | Colorectum | MSS | Chemical carcinogenesis - reactive oxygen species | 118/1875 | 223/8465 | 2.71e-24 | 4.54e-22 | 2.78e-22 | 118 |
| hsa054184 | Colorectum | MSS | Fluid shear stress and atherosclerosis | 51/1875 | 139/8465 | 6.06e-05 | 5.80e-04 | 3.55e-04 | 51 |
| hsa052252 | Colorectum | MSS | Hepatocellular carcinoma | 56/1875 | 168/8465 | 5.04e-04 | 3.45e-03 | 2.11e-03 | 56 |
| hsa004802 | Colorectum | MSS | Glutathione metabolism | 22/1875 | 57/8465 | 3.58e-03 | 1.64e-02 | 1.01e-02 | 22 |
| hsa01524 | Colorectum | MSS | Platinum drug resistance | 25/1875 | 73/8465 | 1.17e-02 | 3.99e-02 | 2.44e-02 | 25 |
| hsa052085 | Colorectum | MSS | Chemical carcinogenesis - reactive oxygen species | 118/1875 | 223/8465 | 2.71e-24 | 4.54e-22 | 2.78e-22 | 118 |
| hsa054185 | Colorectum | MSS | Fluid shear stress and atherosclerosis | 51/1875 | 139/8465 | 6.06e-05 | 5.80e-04 | 3.55e-04 | 51 |
| hsa052253 | Colorectum | MSS | Hepatocellular carcinoma | 56/1875 | 168/8465 | 5.04e-04 | 3.45e-03 | 2.11e-03 | 56 |
| Page: 1 2 3 4 |
Top |
Cell-cell communication analysis |
| Identification of potential cell-cell interactions between two cell types and their ligand-receptor pairs for different disease states |
| Ligand | Receptor | LRpair | Pathway | Tissue | Disease Stage |
| Page: 1 |
Top |
Single-cell gene regulatory network inference analysis |
| Find out the significant the regulons (TFs) and the target genes of each regulon across cell types for different disease states |
| TF | Cell Type | Tissue | Disease Stage | Target Gene | RSS | Regulon Activity |
| ∗The dot plots of a searched regulon are shown for all cell subpopulations in each disease state of each tissue based on the regulon specific score inferred using pySCENIC and by calculating the average expression. |
| Page: 1 |
Top |
Somatic mutation of malignant transformation related genes |
| Annotation of somatic variants for genes involved in malignant transformation |
| Hugo Symbol | Variant Class | Variant Classification | dbSNP RS | HGVSc | HGVSp | HGVSp Short | SWISSPROT | BIOTYPE | SIFT | PolyPhen | Tumor Sample Barcode | Tissue | Histology | Sex | Age | Stage | Therapy Types | Drugs | Outcome |
| GSTM4 | SNV | Missense_Mutation | c.471N>G | p.Asp157Glu | p.D157E | Q03013 | protein_coding | deleterious(0) | probably_damaging(0.959) | TCGA-D8-A1Y0-01 | Breast | breast invasive carcinoma | Female | >=65 | III/IV | Chemotherapy | cyclophosphamide+methotrexatum+fluorouracillum | SD | |
| GSTM4 | SNV | Missense_Mutation | c.472N>A | p.Phe158Ile | p.F158I | Q03013 | protein_coding | deleterious(0.01) | possibly_damaging(0.606) | TCGA-D8-A1Y0-01 | Breast | breast invasive carcinoma | Female | >=65 | III/IV | Chemotherapy | cyclophosphamide+methotrexatum+fluorouracillum | SD | |
| GSTM4 | SNV | Missense_Mutation | rs765712268 | c.101N>T | p.Thr34Met | p.T34M | Q03013 | protein_coding | deleterious(0.03) | benign(0.063) | TCGA-A6-6140-01 | Colorectum | colon adenocarcinoma | Male | <65 | I/II | Chemotherapy | oxaliplatin | SD |
| GSTM4 | SNV | Missense_Mutation | novel | c.496C>A | p.Leu166Ile | p.L166I | Q03013 | protein_coding | tolerated(0.13) | benign(0.007) | TCGA-AA-3710-01 | Colorectum | colon adenocarcinoma | Female | >=65 | I/II | Unknown | Unknown | SD |
| GSTM4 | SNV | Missense_Mutation | c.451G>T | p.Asp151Tyr | p.D151Y | Q03013 | protein_coding | deleterious(0.03) | possibly_damaging(0.753) | TCGA-AA-3977-01 | Colorectum | colon adenocarcinoma | Male | >=65 | I/II | Unknown | Unknown | SD | |
| GSTM4 | SNV | Missense_Mutation | novel | c.85G>A | p.Glu29Lys | p.E29K | Q03013 | protein_coding | deleterious(0.05) | benign(0.076) | TCGA-AZ-4315-01 | Colorectum | colon adenocarcinoma | Male | <65 | I/II | Unknown | Unknown | SD |
| GSTM4 | SNV | Missense_Mutation | novel | c.147N>C | p.Glu49Asp | p.E49D | Q03013 | protein_coding | tolerated(0.12) | benign(0.003) | TCGA-CA-6717-01 | Colorectum | colon adenocarcinoma | Male | <65 | I/II | Chemotherapy | oxaliplatin | CR |
| GSTM4 | SNV | Missense_Mutation | rs375686135 | c.560G>A | p.Arg187His | p.R187H | Q03013 | protein_coding | tolerated(0.07) | benign(0.125) | TCGA-CM-6674-01 | Colorectum | colon adenocarcinoma | Male | <65 | I/II | Unknown | Unknown | SD |
| GSTM4 | SNV | Missense_Mutation | rs761147429 | c.286N>T | p.Arg96Cys | p.R96C | Q03013 | protein_coding | deleterious(0.01) | benign(0.181) | TCGA-A5-A0G1-01 | Endometrium | uterine corpus endometrioid carcinoma | Female | >=65 | I/II | Unknown | Unknown | SD |
| GSTM4 | SNV | Missense_Mutation | rs534135982 | c.52N>T | p.Arg18Cys | p.R18C | Q03013 | protein_coding | deleterious(0.03) | probably_damaging(0.977) | TCGA-A5-A0G2-01 | Endometrium | uterine corpus endometrioid carcinoma | Female | <65 | III/IV | Unknown | Unknown | SD |
| Page: 1 2 3 |
Top |
Related drugs of malignant transformation related genes |
| Identification of chemicals and drugs interact with genes involved in malignant transfromation |
| (DGIdb 4.0) |
| Entrez ID | Symbol | Category | Interaction Types | Drug Claim Name | Drug Name | PMIDs |
| Page: 1 |

Copyright 2023-Present -The University of Texas Health Science Center at Houston |