
|
|||||
|
 | |
| |
| |
| |
| |
| |
|
Gene: GSTM3 |
Gene summary for GSTM3 |
| Gene information | Species | Human | Gene symbol | GSTM3 | Gene ID | 2947 |
| Gene name | glutathione S-transferase mu 3 | |
| Gene Alias | GST5 | |
| Cytomap | 1p13.3 | |
| Gene Type | protein-coding | GO ID | GO:0001885 | UniProtAcc | P21266 |
Top |
Malignant transformation analysis |
| Identification of the aberrant gene expression in precancerous and cancerous lesions by comparing the gene expression of stem-like cells in diseased tissues with normal stem cells |
| Entrez ID | Symbol | Replicates | Species | Organ | Tissue | Adj P-value | Log2FC | Malignancy |
| 2947 | GSTM3 | GSM4909281 | Human | Breast | IDC | 6.05e-05 | -2.34e-01 | 0.21 |
| 2947 | GSTM3 | GSM4909282 | Human | Breast | IDC | 2.07e-03 | -2.18e-01 | -0.0288 |
| 2947 | GSTM3 | GSM4909285 | Human | Breast | IDC | 4.75e-04 | -6.09e-02 | 0.21 |
| 2947 | GSTM3 | GSM4909286 | Human | Breast | IDC | 2.88e-10 | -3.62e-01 | 0.1081 |
| 2947 | GSTM3 | GSM4909287 | Human | Breast | IDC | 7.22e-09 | -4.20e-01 | 0.2057 |
| 2947 | GSTM3 | GSM4909291 | Human | Breast | IDC | 6.50e-20 | 7.66e-01 | 0.1753 |
| 2947 | GSTM3 | GSM4909293 | Human | Breast | IDC | 3.94e-06 | 2.43e-01 | 0.1581 |
| 2947 | GSTM3 | GSM4909294 | Human | Breast | IDC | 2.29e-16 | 6.06e-01 | 0.2022 |
| 2947 | GSTM3 | GSM4909296 | Human | Breast | IDC | 3.21e-04 | -2.07e-01 | 0.1524 |
| 2947 | GSTM3 | GSM4909297 | Human | Breast | IDC | 3.43e-04 | -9.22e-02 | 0.1517 |
| 2947 | GSTM3 | GSM4909298 | Human | Breast | IDC | 2.87e-04 | -2.36e-01 | 0.1551 |
| 2947 | GSTM3 | GSM4909304 | Human | Breast | IDC | 2.27e-07 | 4.30e-01 | 0.1636 |
| 2947 | GSTM3 | GSM4909305 | Human | Breast | IDC | 4.01e-04 | 3.45e-01 | 0.0436 |
| 2947 | GSTM3 | GSM4909306 | Human | Breast | IDC | 1.99e-41 | 8.93e-01 | 0.1564 |
| 2947 | GSTM3 | GSM4909308 | Human | Breast | IDC | 2.23e-04 | 8.56e-02 | 0.158 |
| 2947 | GSTM3 | GSM4909309 | Human | Breast | IDC | 4.40e-08 | 5.22e-01 | 0.0483 |
| 2947 | GSTM3 | GSM4909311 | Human | Breast | IDC | 8.29e-17 | -2.61e-01 | 0.1534 |
| 2947 | GSTM3 | GSM4909312 | Human | Breast | IDC | 1.86e-05 | -2.78e-01 | 0.1552 |
| 2947 | GSTM3 | GSM4909315 | Human | Breast | IDC | 1.56e-12 | 5.83e-01 | 0.21 |
| 2947 | GSTM3 | GSM4909316 | Human | Breast | IDC | 1.78e-03 | 4.97e-01 | 0.21 |
| Page: 1 2 3 4 5 6 7 8 |
| Tissue | Expression Dynamics | Abbreviation |
| Breast |  | IDC: Invasive ductal carcinoma |
| DCIS: Ductal carcinoma in situ | ||
| Precancer(BRCA1-mut): Precancerous lesion from BRCA1 mutation carriers | ||
| Esophagus | 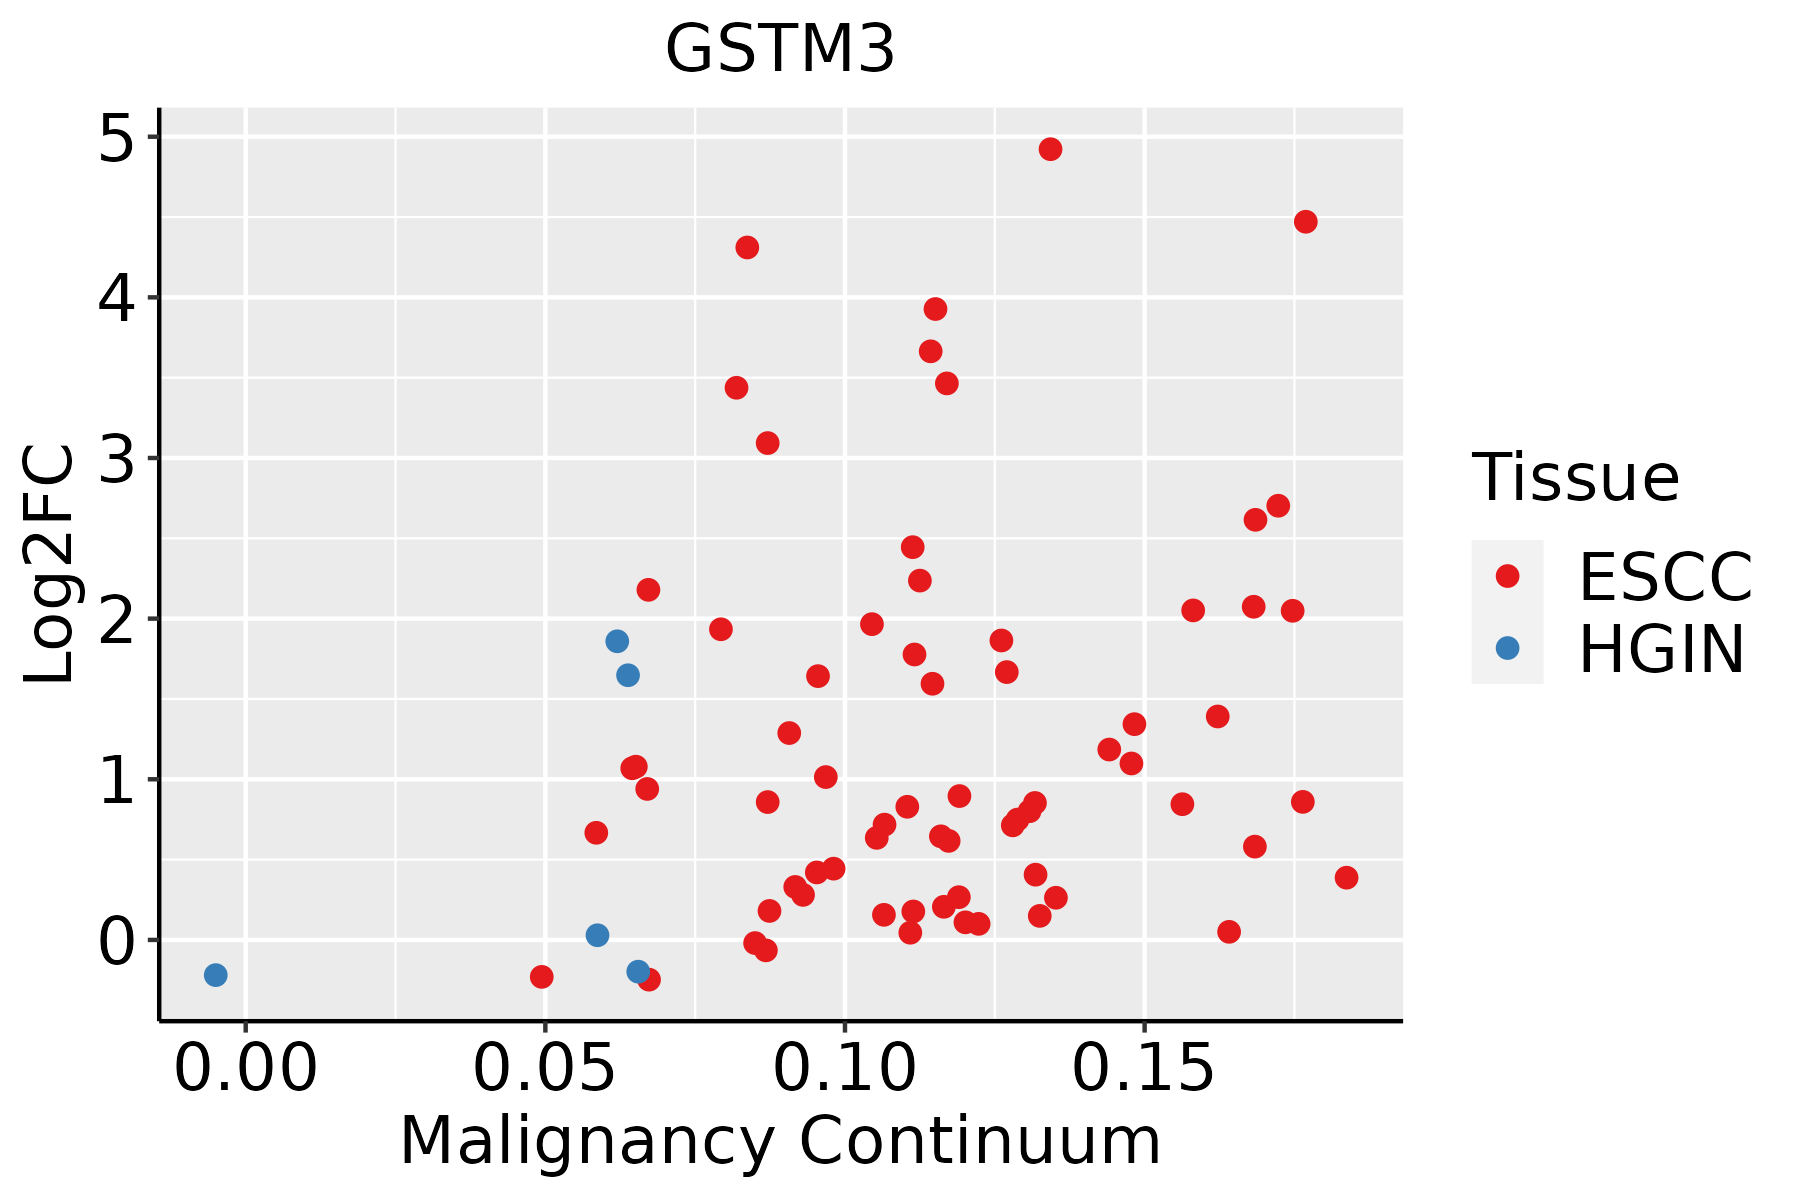 | ESCC: Esophageal squamous cell carcinoma |
| HGIN: High-grade intraepithelial neoplasias | ||
| LGIN: Low-grade intraepithelial neoplasias | ||
| Liver | 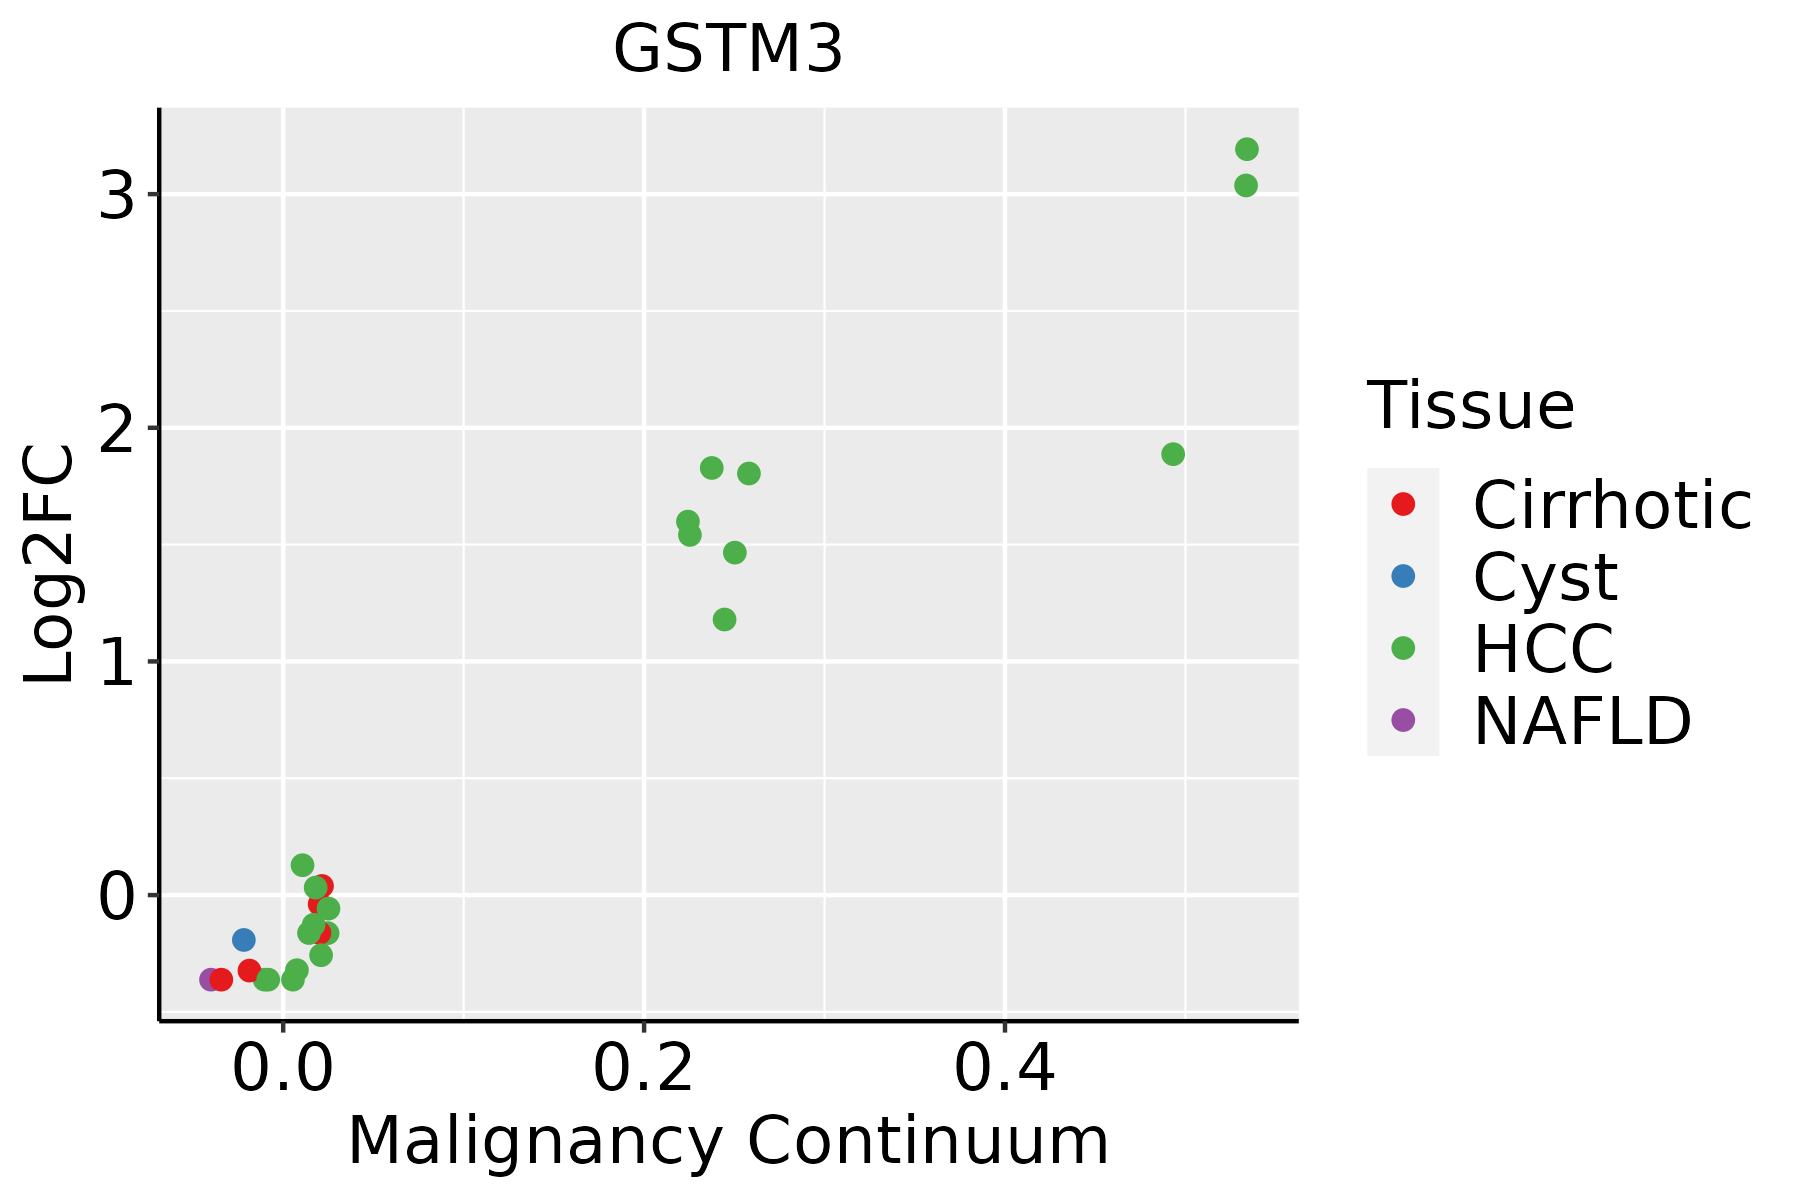 | HCC: Hepatocellular carcinoma |
| NAFLD: Non-alcoholic fatty liver disease | ||
| Oral Cavity | 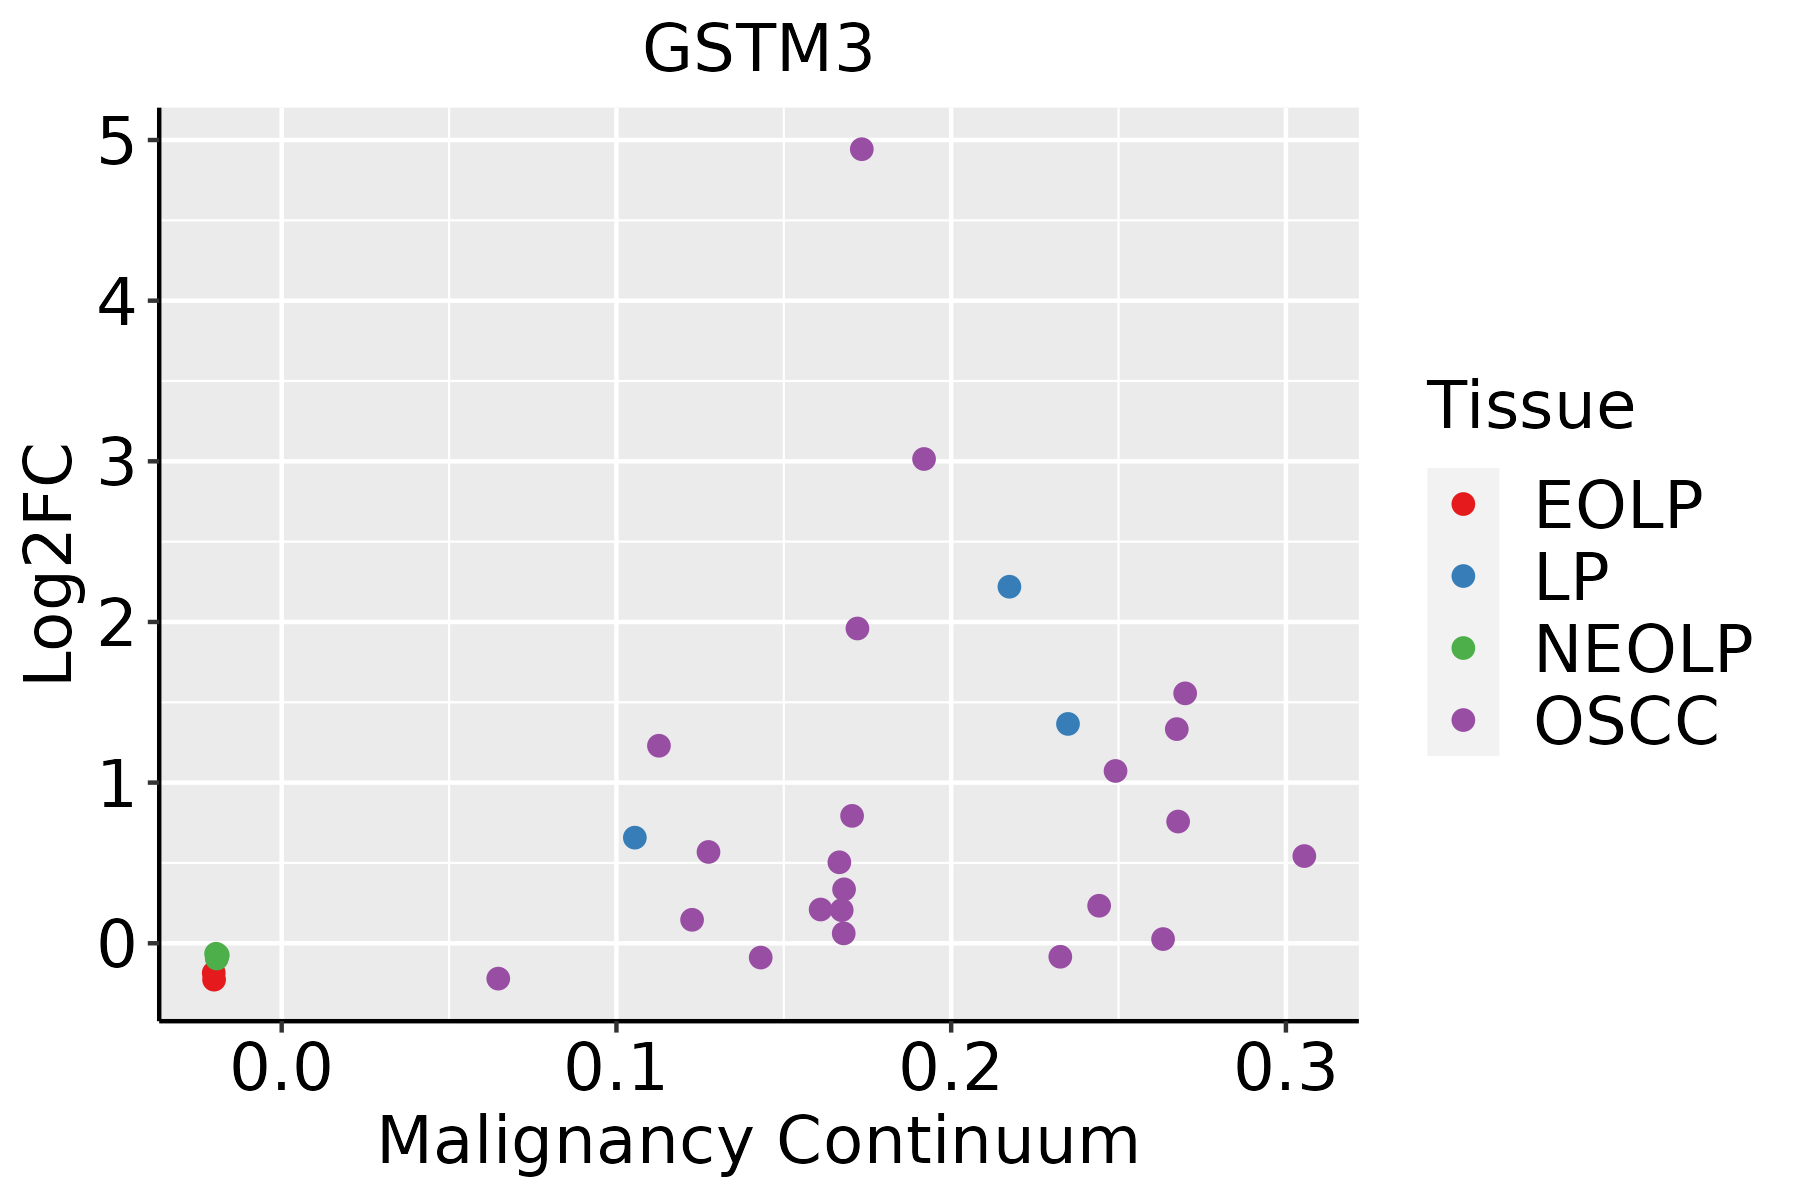 | EOLP: Erosive Oral lichen planus |
| LP: leukoplakia | ||
| NEOLP: Non-erosive oral lichen planus | ||
| OSCC: Oral squamous cell carcinoma | ||
| Skin |  | AK: Actinic keratosis |
| cSCC: Cutaneous squamous cell carcinoma | ||
| SCCIS:squamous cell carcinoma in situ | ||
| Thyroid |  | ATC: Anaplastic thyroid cancer |
| HT: Hashimoto's thyroiditis | ||
| PTC: Papillary thyroid cancer |
| ∗log2FC in expression of this searched gene in stem-like cells from each diseased tissue sample relative to stem-like cells in normal samples in each tissue plotted against the malignancy continuum. Samples are colored based on if they are from different disease stage. |
Top |
Malignant transformation related pathway analysis |
| Find out the enriched GO biological processes and KEGG pathways involved in transition from healthy to precancer to cancer |
| Tissue | Disease Stage | Enriched GO biological Processes |
| Colorectum | AD |  |
| Colorectum | SER |  |
| Colorectum | MSS |  |
| Colorectum | MSI-H |  |
| Colorectum | FAP |  |
| ∗Top 15 enriched GO BP terms are showed in the bar plot of each disease state in each tissue. Each row represents a significant GO biological process which is colored according to the -log10(p.adjust). |
| Page: 1 2 3 4 5 6 7 8 9 |
| GO ID | Tissue | Disease Stage | Description | Gene Ratio | Bg Ratio | pvalue | p.adjust | Count |
| GO:19907488 | Breast | Precancer | cellular detoxification | 21/1080 | 116/18723 | 2.67e-06 | 8.89e-05 | 21 |
| GO:00987548 | Breast | Precancer | detoxification | 24/1080 | 152/18723 | 6.49e-06 | 1.81e-04 | 24 |
| GO:00972378 | Breast | Precancer | cellular response to toxic substance | 21/1080 | 124/18723 | 7.98e-06 | 2.17e-04 | 21 |
| GO:00436273 | Breast | Precancer | response to estrogen | 15/1080 | 75/18723 | 2.06e-05 | 4.83e-04 | 15 |
| GO:00096368 | Breast | Precancer | response to toxic substance | 31/1080 | 262/18723 | 1.18e-04 | 2.12e-03 | 31 |
| GO:00094108 | Breast | Precancer | response to xenobiotic stimulus | 45/1080 | 462/18723 | 4.17e-04 | 5.56e-03 | 45 |
| GO:00020649 | Breast | Precancer | epithelial cell development | 23/1080 | 220/18723 | 4.28e-03 | 3.35e-02 | 23 |
| GO:000963613 | Breast | IDC | response to toxic substance | 44/1434 | 262/18723 | 6.33e-07 | 3.00e-05 | 44 |
| GO:009875413 | Breast | IDC | detoxification | 29/1434 | 152/18723 | 3.97e-06 | 1.43e-04 | 29 |
| GO:000941013 | Breast | IDC | response to xenobiotic stimulus | 62/1434 | 462/18723 | 1.05e-05 | 2.88e-04 | 62 |
| GO:199074813 | Breast | IDC | cellular detoxification | 23/1434 | 116/18723 | 2.02e-05 | 4.92e-04 | 23 |
| GO:009723713 | Breast | IDC | cellular response to toxic substance | 24/1434 | 124/18723 | 2.05e-05 | 4.97e-04 | 24 |
| GO:004362711 | Breast | IDC | response to estrogen | 17/1434 | 75/18723 | 4.05e-05 | 9.25e-04 | 17 |
| GO:000206414 | Breast | IDC | epithelial cell development | 28/1434 | 220/18723 | 5.53e-03 | 4.05e-02 | 28 |
| GO:000963623 | Breast | DCIS | response to toxic substance | 42/1390 | 262/18723 | 1.76e-06 | 6.56e-05 | 42 |
| GO:009875423 | Breast | DCIS | detoxification | 29/1390 | 152/18723 | 2.15e-06 | 7.79e-05 | 29 |
| GO:199074823 | Breast | DCIS | cellular detoxification | 23/1390 | 116/18723 | 1.22e-05 | 3.12e-04 | 23 |
| GO:009723723 | Breast | DCIS | cellular response to toxic substance | 24/1390 | 124/18723 | 1.22e-05 | 3.12e-04 | 24 |
| GO:000941023 | Breast | DCIS | response to xenobiotic stimulus | 59/1390 | 462/18723 | 3.00e-05 | 6.61e-04 | 59 |
| GO:00436272 | Breast | DCIS | response to estrogen | 16/1390 | 75/18723 | 1.01e-04 | 1.84e-03 | 16 |
| Page: 1 2 3 4 5 6 7 |
| Pathway ID | Tissue | Disease Stage | Description | Gene Ratio | Bg Ratio | pvalue | p.adjust | qvalue | Count |
| hsa0520818 | Breast | Precancer | Chemical carcinogenesis - reactive oxygen species | 68/684 | 223/8465 | 3.61e-23 | 1.14e-21 | 8.73e-22 | 68 |
| hsa0541818 | Breast | Precancer | Fluid shear stress and atherosclerosis | 28/684 | 139/8465 | 4.74e-06 | 6.00e-05 | 4.59e-05 | 28 |
| hsa0048010 | Breast | Precancer | Glutathione metabolism | 12/684 | 57/8465 | 1.68e-03 | 1.08e-02 | 8.30e-03 | 12 |
| hsa0520819 | Breast | Precancer | Chemical carcinogenesis - reactive oxygen species | 68/684 | 223/8465 | 3.61e-23 | 1.14e-21 | 8.73e-22 | 68 |
| hsa0541819 | Breast | Precancer | Fluid shear stress and atherosclerosis | 28/684 | 139/8465 | 4.74e-06 | 6.00e-05 | 4.59e-05 | 28 |
| hsa0048013 | Breast | Precancer | Glutathione metabolism | 12/684 | 57/8465 | 1.68e-03 | 1.08e-02 | 8.30e-03 | 12 |
| hsa0520824 | Breast | IDC | Chemical carcinogenesis - reactive oxygen species | 71/867 | 223/8465 | 2.55e-19 | 7.53e-18 | 5.63e-18 | 71 |
| hsa0541824 | Breast | IDC | Fluid shear stress and atherosclerosis | 34/867 | 139/8465 | 9.41e-07 | 1.61e-05 | 1.20e-05 | 34 |
| hsa0048023 | Breast | IDC | Glutathione metabolism | 13/867 | 57/8465 | 4.25e-03 | 2.56e-02 | 1.91e-02 | 13 |
| hsa0520834 | Breast | IDC | Chemical carcinogenesis - reactive oxygen species | 71/867 | 223/8465 | 2.55e-19 | 7.53e-18 | 5.63e-18 | 71 |
| hsa0541834 | Breast | IDC | Fluid shear stress and atherosclerosis | 34/867 | 139/8465 | 9.41e-07 | 1.61e-05 | 1.20e-05 | 34 |
| hsa0048033 | Breast | IDC | Glutathione metabolism | 13/867 | 57/8465 | 4.25e-03 | 2.56e-02 | 1.91e-02 | 13 |
| hsa0520843 | Breast | DCIS | Chemical carcinogenesis - reactive oxygen species | 70/846 | 223/8465 | 2.82e-19 | 8.29e-18 | 6.10e-18 | 70 |
| hsa0541844 | Breast | DCIS | Fluid shear stress and atherosclerosis | 34/846 | 139/8465 | 5.31e-07 | 9.03e-06 | 6.65e-06 | 34 |
| hsa0048041 | Breast | DCIS | Glutathione metabolism | 13/846 | 57/8465 | 3.44e-03 | 1.98e-02 | 1.46e-02 | 13 |
| hsa0520853 | Breast | DCIS | Chemical carcinogenesis - reactive oxygen species | 70/846 | 223/8465 | 2.82e-19 | 8.29e-18 | 6.10e-18 | 70 |
| hsa0541854 | Breast | DCIS | Fluid shear stress and atherosclerosis | 34/846 | 139/8465 | 5.31e-07 | 9.03e-06 | 6.65e-06 | 34 |
| hsa0048051 | Breast | DCIS | Glutathione metabolism | 13/846 | 57/8465 | 3.44e-03 | 1.98e-02 | 1.46e-02 | 13 |
| hsa0520839 | Esophagus | HGIN | Chemical carcinogenesis - reactive oxygen species | 92/1383 | 223/8465 | 2.41e-19 | 9.83e-18 | 7.80e-18 | 92 |
| hsa0541839 | Esophagus | HGIN | Fluid shear stress and atherosclerosis | 42/1383 | 139/8465 | 2.92e-05 | 3.81e-04 | 3.02e-04 | 42 |
| Page: 1 2 3 4 |
Top |
Cell-cell communication analysis |
| Identification of potential cell-cell interactions between two cell types and their ligand-receptor pairs for different disease states |
| Ligand | Receptor | LRpair | Pathway | Tissue | Disease Stage |
| Page: 1 |
Top |
Single-cell gene regulatory network inference analysis |
| Find out the significant the regulons (TFs) and the target genes of each regulon across cell types for different disease states |
| TF | Cell Type | Tissue | Disease Stage | Target Gene | RSS | Regulon Activity |
| ∗The dot plots of a searched regulon are shown for all cell subpopulations in each disease state of each tissue based on the regulon specific score inferred using pySCENIC and by calculating the average expression. |
| Page: 1 |
Top |
Somatic mutation of malignant transformation related genes |
| Annotation of somatic variants for genes involved in malignant transformation |
| Hugo Symbol | Variant Class | Variant Classification | dbSNP RS | HGVSc | HGVSp | HGVSp Short | SWISSPROT | BIOTYPE | SIFT | PolyPhen | Tumor Sample Barcode | Tissue | Histology | Sex | Age | Stage | Therapy Types | Drugs | Outcome |
| GSTM3 | insertion | Frame_Shift_Ins | novel | c.409_410insA | p.Gly137GlufsTer30 | p.G137Efs*30 | P21266 | protein_coding | TCGA-B6-A0IN-01 | Breast | breast invasive carcinoma | Female | <65 | I/II | Unknown | Unknown | PD | ||
| GSTM3 | SNV | Missense_Mutation | rs199933862 | c.595G>A | p.Ala199Thr | p.A199T | P21266 | protein_coding | deleterious(0.01) | benign(0.066) | TCGA-AA-3864-01 | Colorectum | colon adenocarcinoma | Male | >=65 | I/II | Unknown | Unknown | SD |
| GSTM3 | SNV | Missense_Mutation | c.544T>C | p.Phe182Leu | p.F182L | P21266 | protein_coding | tolerated(0.05) | benign(0.34) | TCGA-AZ-6601-01 | Colorectum | colon adenocarcinoma | Male | >=65 | I/II | Unknown | Unknown | PD | |
| GSTM3 | SNV | Missense_Mutation | c.613G>C | p.Asp205His | p.D205H | P21266 | protein_coding | deleterious(0.01) | benign(0.133) | TCGA-CK-4951-01 | Colorectum | colon adenocarcinoma | Female | >=65 | I/II | Unknown | Unknown | PD | |
| GSTM3 | SNV | Missense_Mutation | c.53N>T | p.Ala18Val | p.A18V | P21266 | protein_coding | deleterious(0.02) | benign(0.234) | TCGA-CK-6746-01 | Colorectum | colon adenocarcinoma | Female | >=65 | I/II | Unknown | Unknown | SD | |
| GSTM3 | SNV | Missense_Mutation | novel | c.358T>C | p.Tyr120His | p.Y120H | P21266 | protein_coding | deleterious(0.03) | benign(0.192) | TCGA-AG-A002-01 | Colorectum | rectum adenocarcinoma | Male | <65 | I/II | Unknown | Unknown | SD |
| GSTM3 | SNV | Missense_Mutation | novel | c.610T>G | p.Ser204Ala | p.S204A | P21266 | protein_coding | deleterious(0) | benign(0.19) | TCGA-B5-A11E-01 | Endometrium | uterine corpus endometrioid carcinoma | Female | <65 | I/II | Unknown | Unknown | SD |
| GSTM3 | SNV | Missense_Mutation | c.322N>T | p.Val108Leu | p.V108L | P21266 | protein_coding | tolerated(0.59) | benign(0.005) | TCGA-B5-A1MR-01 | Endometrium | uterine corpus endometrioid carcinoma | Female | >=65 | III/IV | Unknown | Unknown | SD | |
| GSTM3 | SNV | Missense_Mutation | rs779672621 | c.244N>T | p.Arg82Cys | p.R82C | P21266 | protein_coding | deleterious(0.04) | probably_damaging(0.94) | TCGA-D1-A103-01 | Endometrium | uterine corpus endometrioid carcinoma | Female | >=65 | I/II | Unknown | Unknown | SD |
| GSTM3 | SNV | Missense_Mutation | rs773356369 | c.344N>C | p.Leu115Pro | p.L115P | P21266 | protein_coding | deleterious(0) | probably_damaging(0.997) | TCGA-DI-A1BU-01 | Endometrium | uterine corpus endometrioid carcinoma | Female | <65 | I/II | Chemotherapy | paclitaxel | SD |
| Page: 1 2 |
Top |
Related drugs of malignant transformation related genes |
| Identification of chemicals and drugs interact with genes involved in malignant transfromation |
| (DGIdb 4.0) |
| Entrez ID | Symbol | Category | Interaction Types | Drug Claim Name | Drug Name | PMIDs |
| 2947 | GSTM3 | ENZYME, DRUGGABLE GENOME | olanzapine | OLANZAPINE | 23559402 |
| Page: 1 |

Copyright 2023-Present -The University of Texas Health Science Center at Houston |